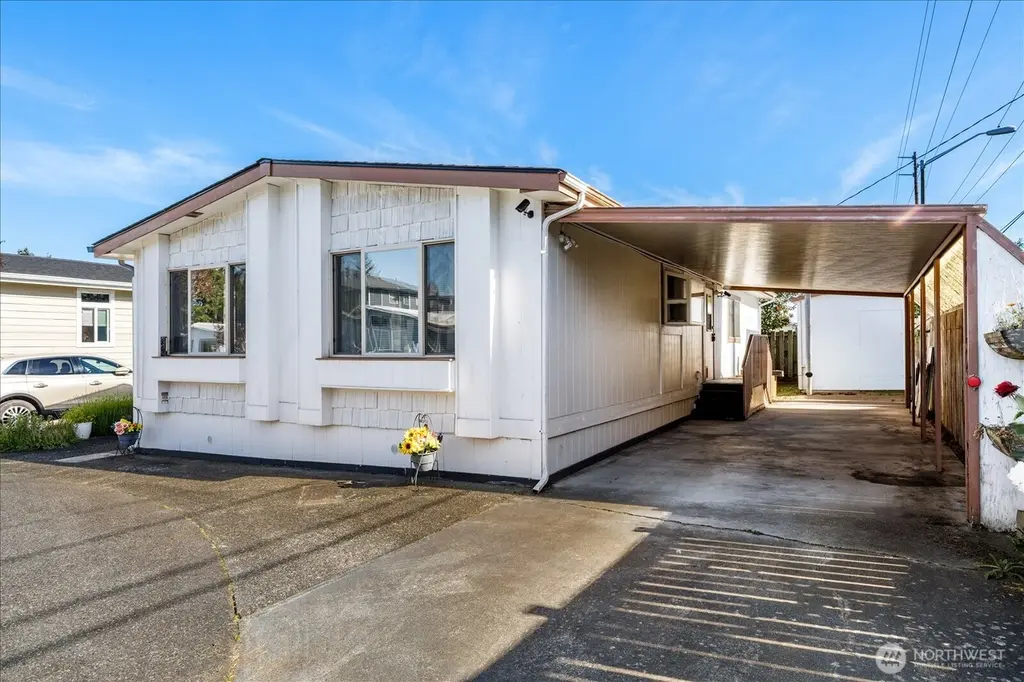
225 NE Ernst St #93 · Oak Harbor, WA
Flood risk 1/10 · Minimal
- FEMA flood zone
- X (unshaded)
- Chance of flooding over 30 yrs
- 0.0%
- Est. flood insurance / yr
- $507 – $1,088
Fire risk 3/10 · Minor
- Est. fire insurance / yr
- $604 – $1,122
Heat risk 2/10 · Minimal
- Hot days now (above 78°F)
- 7 days/yr
- Hot days in 30 yrs
- 20 days/yr
Wind risk 1/10 · Minimal
- Chance of severe wind over 30 yrs
- —
Air-quality risk 6/10 · Moderate
- Unhealthy air days now
- 7 days/yr
- Unhealthy air days in 30 yrs
- 8 days/yr
Risk factors via First Street. Map © Google.
Why this score? — see what drove the A- grade
The composite is a weighted blend of 9 inputs, each scored 0–100. Each bar is that input's sub-score; the figure is the points it added to the 100-point composite (weight × sub-score).
- Cash flow +30.0/30.0
- ARV discount +15.0/15.0
- 1% rule +10.0/10.0
- DSCR +10.0/10.0
- Schools +4.9/10.0
- Livability +3.9/5.0
- Rent growth +3.8/5.0
- Condition / age +2.5/5.0
- Appreciation +0.0/10.0
$90,000
🖨 Deal sheet (PDF) 📄 Offer letter ✓ Due diligence
Listing remarks
Looking for affordable Island living? This beautifully maintained home located in Oak Harbor's premier senior park (55+) Western Village, is the answer! Set at the end of a dead-end street for additional privacy, yet right in the heart of town, this home offers functional serenity. Upon entering you are greeted by the bright, open-concept layout including dining area w/ built-in hutch. The spacious eat-in kitchen has loads of cupboard space & a wonderfully oversized garden window, ideal for growing herbs. Don't overlook the generous guest bedroom, full bath & dedicated laundry/utility room. The primary bedroom sits at the back of the home, boasting an expansive ensuite w/ loads
Key facts
- Expansive ensuite
- Built-in hutch
- Open-concept layout
Tags
Property features AI
Finance
- Financial info: Land lease amount: $850; Acceptable financing: Cash, Conventional
- HOA & community: Located in a senior community (Western Village); Park amenities: clubhouse, common area, laundry, high-speed internet available; Pets: see remarks; Land lease
Exterior
- Parking: Carport; RV parking available in the park
- Utilities: Electric energy; Public water; Public sewer; Electric water heater (located in exterior rear closet); Power by PSE
- Home design: Manufactured double-wide home; One level; Faces northwest; Manufactured after 6/15/1976; Good condition; Paramount make; Mobile home remains
- Construction: Metal/vinyl and wood construction; Composition roof; Tie-down foundation
- Exterior features: Metal/vinyl and wood exterior; Awnings; Wood skirting; Dead-end street; Paved access; Has view
Interior
- Kitchen: Dishwasher; Garbage disposal; Microwave; Refrigerator; Stove/Range
- Bedrooms: 2 bedrooms
- Flooring: Laminate; Vinyl; Carpet
- Bathrooms: 2 full bathrooms (includes 2 bathtubs and 2 showers)
- Heating & cooling: Forced air heating; No central air
- Interior features: Water heater; Ceiling fan(s); Double pane windows; Drapes; Patio/porch/deck
- Laundry & utility: Washer; Dryer; Washer/Dryer included
Neighborhood map
What this means for you Summary
Snapshot
- This is a 2-bed/2.0-bath manufactured listed at $90k.
Deal economics
- At list price, monthly cash flow is $1k ($13k/yr) — positive.
- The deal already cash-flows at list — no discount required.
- Meets the 1% rule at list price ($2k rent vs $90k).
- Recommended offer: $89k (1.5% below list) — sets the bar for market timing.
- Cap rate 20.6% vs local median 2.7% in Oak Harbor — top-decile yield for the area; either an underpriced asset or a hidden risk that comps aren't pricing in. Stress-test before assuming the spread holds.
Location & tenants
- Location reads 77/100 on livability (#149 in WA, #3,120 nationally) — a middle-class / working-renter tenant base. Strengths: crime A+, health & safety A+, housing A; Watch: amenities D+, cost of living D+.
- Oak Harbor School District (town): math 49% / reading 61% proficiency, ranked #98 of 291 in WA (top 34%) — acceptable for families but not a draw, mixed tenant base, ~2y average lease.
- Market conditions: Rents rising fast (+5.4%/yr); 277 active listings in the ZIP; 16 comparable units currently listed for rent nearby; rentals lingering (median 45d on market — plan ~5-8 weeks vacancy on turnover, expect pricing pressure); 88% of comp listings sitting > 30 days — soft ceiling on asking rent; solid renter incomes; 402 units permitted in Island County in 2024 (54 in 5+ unit buildings).
Forward outlook
- Local home prices are declining (-3.0%/yr); year-one equity from $622 of loan paydown is wiped out by about $3k of value loss. Plan a longer hold.
- Island County population projected to shrink 6% by 2050 — rents likely to lag national; underwrite the cash flow, not the appreciation.
- At projected returns (-3.0% appreciation + 5.4% rent growth), your $25k cash investment doubles in ~3 years — after that, you're playing with house money.
Negotiation context
- It's been on market 20 days — a 2% lower offer ($89k) is reasonable based on typical stale-listing flexibility.
- 5 sale attempts since 21y ago with the ask held roughly flat each time — persistent listings suggest the price (not the market) is what's stuck; bring a comps-based counter.
- Current owner paid $22k; list at $90k implies a 309% gain — meaningful room to come down on a strong offer.
Questions for the listing agent
- Built in 1979 — when were the roof, HVAC, electrical panel, plumbing, and water heater last replaced?
- Is there a deadline driving the sale (1031 exchange, divorce, estate, relocation)? That informs how much negotiation room exists.
- Schools are B-rated — typically a magnet for longer-tenancy family renters. What's the average tenant stay here, and is there a school-zone premium baked into asking?
- What's the average days-on-market for RENTAL listings here right now (not sales)? A rising rental-DOM trend means longer vacancies and softer asking-rent achievability than the comps imply.
- What's the recent tenant-quality profile in this submarket — average credit score on applications, eviction rate, late-payment / NSF rate, and stable-employment percentage? A property-management company in the area should have these aggregated.
- How much new for-sale + rental construction is in the pipeline within 1–3 miles? Heavy new supply typically softens prices + rents 12–24 months out; constrained supply supports both.
Investment metrics
- 1% rule
- 2.25% ✓
- Cap rate
- 20.62%
- Cash-on-cash
- 51.16%
- DSCR
- 3.28
- GRM
- 3.7
CMA / ARV
- ARV (on-the-fly)
- $115,544
- Comps found
- 6
Show comp detail 6 sales within ~0.75 mi
| Address | Dist | Beds/Ba | Sqft | Sold | Price | $/sf | Match |
|---|---|---|---|---|---|---|---|
| 225 NE Ernst St #26 | 0.00mi | 2/2.0 | 1,120 (-2%) | 12mo | $110,000 | $98 | 87 |
| 225 NE Ernst St #73 | 0.12mi | 2/2.0 | 976 (-15%) | 2mo | $126,900 | $130 | 68 |
| 1320 N Oak Harbor St #97 | 0.61mi | 3/2.0 (+1) | 1,140 (-0%) | 1mo | $55,000 | $48 | 66 |
| 225 NE Ernst St #17 | 0.06mi | 2/2.0 | 1,056 (-8%) | 23mo | $160,000 | $152 | 65 |
| 1361 NE Goldie Rd #17 | 0.71mi | 2/2.0 | 1,196 (+4%) | 10mo | $76,000 | $64 | 52 |
| 1320 N Oak Harbor St #178 | 0.61mi | 3/2.0 (+1) | 1,202 (+5%) | 15mo | $121,000 | $101 | 46 |
Match score weights: distance 35% · size 25% · config 20% · recency 20%. Top-matched comps best support the ARV.
Projected returns pro-forma
-3.0% appreciation · 5.36% rent growth · sell at horizon
- IRR
- 51.5%
- Equity multiple
- 3.33×
- Total profit
- $58,736
- Equity at exit
- $13,419
- IRR
- 57.7%
- Equity multiple
- 7.36×
- Total profit
- $160,357
- Equity at exit
- $7,782
Cash invested: $25,200 (down + closing). Projections, not guarantees.
Landlord ↔ Tenant lean methodology
- Overall (STATE)
- 28 Tenant-Leaning
- State Washington
- 28 Tenant-Leaning · D+8
- County
- — inherits STATE
- City
- — inherits STATE
ZIP-level market 98277
- Rents YoY
- 5.4%
- Active inventory
- 277
- Price-to-rent
- 3.7×
Monthly cashflow live
- Estimated rent
- $2,027 high interval (Pro) →
- Mortgage (P&I)
- −$472
- Tax from tax record
- −$18 /mo · $213/yr
- Insurance
- −$38
- HOA
- −$0
- Vacancy / Maint / Mgmt
- −$426
- Net cashflow
- $1,074
Break-even live
Sensitivity live
| Price | -10% $1,125 | -5% $1,100 | +0% $1,074 | +5% $1,049 | +10% $1,023 |
|---|---|---|---|---|---|
| Rent | -10% $914 | -5% $994 | +0% $1,074 | +5% $1,154 | +10% $1,234 |
| Rate | -1.0pp $1,120 | -0.5pp $1,097 | base $1,074 | +0.5pp $1,051 | +1.0pp $1,027 |
UW: 25.0% down · 7.5% · 30yr · 1.5% tax · 5.0% vac · 8.0% maint · 8.0% mgmt
Financing live
Cash to close
- Down payment
- $22,500
- Closing costs
- $2,700
- Reserves months
- —
- Total cash needed
- —
Loan-product check · same deal, 3 products live
Conventional
25% down · 7.5% · 30yr
- Down + closing
- —
- Monthly P&I
- —
- Monthly cashflow
- —
- DSCR
- —
- Eligible?
- —
Personal DTI + credit; lowest rate.
DSCR
20% down · 8.5% · 30yr
- Down + closing
- —
- Monthly P&I
- —
- Monthly cashflow
- —
- DSCR
- —
- Eligible?
- —
No personal income docs; deal must DSCR.
Hard money
10% down · 12.0% · 12mo
- Down + closing
- —
- Monthly P&I
- —
- Monthly cashflow
- —
- DSCR
- —
- Eligible?
- —
Short-term bridge; refi at stabilization.
Rent comps 16 comps
| Address | Beds | Baths | Sqft | Rent | $/sqft | DOM | Units | Dist |
|---|---|---|---|---|---|---|---|---|
| 300 N Oak Harbor St Unit B102 Oak Harbor, WA | 3.0 | 2.0 | 1284 | $2,015 | $1.57 | 44d | 1 | 0.14mi |
| 865 N Oak Harbor St Unit 203 Oak Harbor, WA | 2.0 | 1.0 | 750 | $1,565 | $2.09 | 44d | 1 | 0.34mi |
| 395 S Oak Harbor St Unit 207 [[?]165] Oak Harbor, WA | 2.0 | 1.5 | 1000 | $2,030 | $2.03 | 44d | 1 | 0.43mi |
| 563 NE Kettle St Unit A2 Oak Harbor, WA | 3.0 | 2.5 | 1241 | $2,415 | $1.95 | 44d | 1 | 0.43mi |
| 310 SE Midway Blvd Unit 207 Oak Harbor, WA | 2.0 | 1.0 | 791 | $1,640 | $2.07 | 44d | 1 | 0.63mi |
| 141 SW 6th Ave Unit D101 Oak Harbor, WA | 2.0 | 1.5 | 982 | $1,915 | $1.95 | 44d | 1 | 0.65mi |
| 33010 State Route 20 Unit B Oak Harbor, WA | 2.0 | 1.0 | 1100 | $2,440 | $2.22 | 44d | 1 | 0.67mi |
| 413 SE Maylor St Apt 202 Oak Harbor, WA | 2.0 | 1.0 | 884 | $1,650 | $1.87 | 44d | 1 | 0.68mi |
| 790 NW Dory Dr Oak Harbor, WA | 3.0 | 2.0 | 1344 | $2,415 | $1.80 | 44d | 1 | 0.71mi |
| 1051 SE 8th Ave Unit C201 Oak Harbor, WA | 2.0 | 1.0 | 970 | $1,500 | $1.55 | 44d | 1 | 0.79mi |
| 1282 NW Lanyard Loop #2 Oak Harbor, WA | 3.0 | 2.5 | 1330 | $2,315 | $1.74 | 44d | 1 | 0.91mi |
| 1661 NE 16th Ave Oak Harbor, WA | 2.0 | 1.0 | 825 | $1,840 | $2.23 | 2d | 1 | 1.00mi |
| 1518 NW 9th Pl Oak Harbor, WA | 3.0 | 2.0 | 1167 | $2,415 | $2.07 | 21d | 1 | 1.09mi |
| 30875 State Route 20 Unit M3 Oak Harbor, WA | 3.0 | 2.5 | 1437 | $2,415 | $1.68 | 44d | 1 | 1.26mi |
| 1651 SW Mulberry Pl Unit E101 Oak Harbor, WA | 3.0 | 2.0 | 1296 | $2,215 | $1.71 | 44d | 1 | 1.45mi |
| 1725 SW Nienhuis St Oak Harbor, WA | 3.0 | 2.0 | 1326 | $2,515 | $1.90 | 44d | 1 | 1.50mi |
Listing history 16 events
-
2026-06-19days on market $90,000 Active 20 DOM
-
2026-06-18days on market $90,000 Active 19 DOM
-
2026-06-17days on market $90,000 Active 18 DOM
-
2026-06-16days on market $90,000 Active 17 DOM
-
2026-06-15days on market $90,000 Active 16 DOM
-
2026-06-14days on market $90,000 Active 14 DOM
-
2026-06-13days on market $90,000 Active 13 DOM
-
2026-06-10days on market $90,000 Active 11 DOM
-
2026-06-09days on market $90,000 Active 10 DOM
-
2026-06-08days on market $90,000 Active 9 DOM
-
2026-06-07days on market $90,000 Active 8 DOM
-
2026-06-03days on market $90,000 Active 4 DOM
-
2026-06-02days on market $90,000 Active 3 DOM
-
2026-06-01days on market $90,000 Active 2 DOM
-
2026-05-30remarks 691-char remark
-
2026-05-30$90,000 Active 1 DOM
ⓘ Source: listings_history table (triggers on properties + properties_extension) + one-shot
backfill from property_details.listing_events for pre-trigger history.
Tax reassessment forecast WA · Resets to sale price
- Current annual tax
- $213 · $18/mo
- Projected year-2 tax
- $882 · $74/mo
- Expected delta
- +$669/yr (+$56/mo · 313.4%)
ⓘ Screening estimate from a state-policy table — verify with the county assessor before closing.
Climate risk First Street
- Flood 1/10 Low FEMA zone X (unshaded) · 0% chance over 30 yrs
- Wildfire 3/10 Moderate
- Heat 2/10 Low 7 d/yr ≥78°F today · 20 d/yr by 30 yrs out
- Wind 1/10 Low
- Air quality 6/10 Major 7 unhealthy d/yr today · 8 by 30 yrs out
Nearby sold comps map
Loading sold comps map…
Walkable amenities ~0.75 mi
Loading nearby amenities…
Taxation est. · year 1
- Rental income
- $24,327
- − Mortgage interest
- −$5,041
- − Property taxes
- −$213
- − Insurance
- −$450
- − Repairs & maintenance
- −$1,946
- − Management
- −$1,946
- − Depreciation
- −$2,618
- Taxable income
- $12,112
- Est. tax owed @ 24.0%
- −$2,907
- After-tax cash flow
- $9,984/yr
For passive investors: Depreciation is non-cash, so a rental often shows a tax loss while cash-flowing — sheltering income. Rental losses are passive: they offset passive income freely, and up to $25,000/yr can offset ordinary (W-2) income if you actively participate and your MAGI is under $100k (phasing out to $0 by $150k); unused losses carry forward. On sale, claimed depreciation is recaptured at up to 25%, and gains may owe capital-gains tax (a 1031 exchange can defer both). Figures are a year-1 estimate at your 24.0% rate — not tax advice; consult a CPA.
Schools (NCES district)
- District
- Oak Harbor School District
- NCES district ID
- 5305940
- Math proficiency
- 49% ▲ 1.00%
- Reading proficiency
- 61% ▲ 1.00%
- Median HH income
- $53,606
- Composite
- 49.07/100
- National rank
- #4427
- State rank
- #98 of 291 in WA
Livability — Oak Harbor
- Score
- 77/100
- State rank
- #149
- US rank
- #3120
Category grades
Schools grade is shown separately in the Schools card above.
Census & demographics
- Census place
- Oak Harbor, WA
- County
- Island County · 71,196 people
- City population
- 40,917
- Metro
- Oak Harbor, WA
- Population (ZIP)
- 40,917
- Household income
- $83,253
- Rent vs Own
- Severe rent burden
- 1359.0
Population outlook (Island County) Hauer SSP2
- Today (2025)
- 82,019 people
- By 2030
- 81,329 · -0.8%
- By 2040
- 78,552 · -4.2%
- By 2050
- 77,042 · -6.1%
- By 2075
- 80,799 · -1.5%
- By 2100
- 84,451 · +3.0%
Race, ethnicity, and origin ACS 2023
- Neighborhood character
- Predominantly White (66%)
- Race & ethnicity
- White 66% Two or more races 14% Hispanic / Latino 12% Asian 8% Black 4%
- Hispanic origin (detail)
- Mexican 9%
- Common ancestry
- Portuguese 4% Slovak 3% Iranian 3%
- Foreign-born
- 9% · Canada, Vietnam
- Languages at home
- 87% English-only · Spanish 5% Tagalog/Filipino 4% Other Asian/Pacific 1%
Political lean MEDSL · Island
- 2024 margin
- D (+16.6) · D 56.8% · R 40.3% · Other 2.9%
- 2008→2024 swing
- +10.3pp toward D · 2008: 6.2pp · 2024: 16.6pp
- All cycles
- 2024: D+16.6 2020: D+12.0 2016: D+5.9 2012: D+4.4 2008: D+6.2
Not yet ingested
- Civics
- —
Market trends
- HPI YoY
- ▼ -608.47%
- Current HPI
- 188.2874
- Rent YoY
- ▲ 5.36%
- Metro
- Oak Harbor, WA
- State GDP YoY
- ▲ 4.65%
- F500 in state
- 22
Industry mix (Fortune 500 HQ in WA)
| Industry | F500 HQs | Revenue |
|---|---|---|
| Retail | 2 | $269B |
|
||
| Technology / Retail | 1 | $638B |
|
||
| Technology | 1 | $245B |
|
||
| Telecommunications | 1 | $38B |
|
||
| Food / Beverage | 1 | $36B |
|
||
| Automotive / Trucks | 1 | $34B |
|
||
Price history
+260.0% since first listed15 events — show timeline
- 2026-05-30 Listed $90,000 NWMLS as Distributed by MLS Grid
- 2011-12-13 Sold (MLS) $22,000 NWMLS as Distributed by MLS Grid
- 2011-11-30 Pending — NWMLS as Distributed by MLS Grid
- 2011-11-19 Pending — NWMLS as Distributed by MLS Grid
- 2011-11-11 Relisted — NWMLS as Distributed by MLS Grid
- 2011-11-01 Delisted — NWMLS as Distributed by MLS Grid
- 2011-08-23 Relisted — NWMLS as Distributed by MLS Grid
- 2011-08-23 Price Changed $24,900 NWMLS as Distributed by MLS Grid
- 2011-08-12 Pending — NWMLS as Distributed by MLS Grid
- 2011-04-24 Listed $29,900 NWMLS as Distributed by MLS Grid
- 2006-01-20 Sold (MLS) $30,000 NWMLS as Distributed by MLS Grid
- 2005-09-19 Listed $31,800 NWMLS as Distributed by MLS Grid
- 2000-11-16 Sold (Public Records) $27,500 Public Records
- 1999-05-07 Sold (Public Records) $28,000 Public Records
- 1983-09-01 Sold (Public Records) $25,000 Public Records
Property tax history
-1.8%/yrLatest (2024): $213 · -3.8% YoY. Source: county tax records.
Cash-flow waterfall
monthlySold comps — $/sqft
last 12 mo · ≤1 miLoading sold comps…