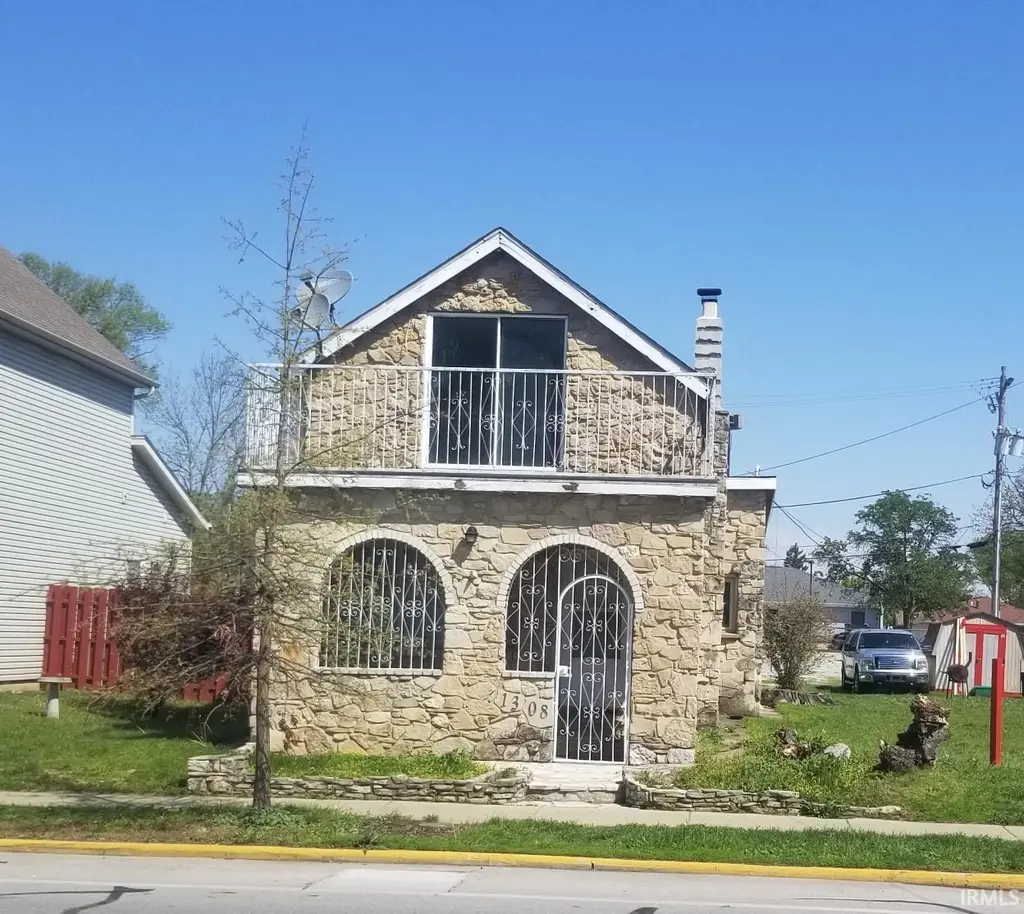
1308 Salem St · Lafayette, IN
Flood risk 4/10 · Minor
- FEMA flood zone
- X (unshaded)
- Chance of flooding over 30 yrs
- 0.22%
- Est. flood insurance / yr
- $473 – $860
Fire risk 1/10 · Minimal
- Est. fire insurance / yr
- $717 – $1,331
Heat risk 4/10 · Minor
- Hot days now (above 102°F)
- 7 days/yr
- Hot days in 30 yrs
- 18 days/yr
Wind risk 2/10 · Minimal
- Chance of severe wind over 30 yrs
- —
Air-quality risk 2/10 · Minimal
- Unhealthy air days now
- 1 days/yr
- Unhealthy air days in 30 yrs
- 2 days/yr
Risk factors via First Street. Map © Google.
Why this score? — see what drove the C- grade
The composite is a weighted blend of 9 inputs, each scored 0–100. Each bar is that input's sub-score; the figure is the points it added to the 100-point composite (weight × sub-score).
- Cash flow +20.9/30.0
- ARV discount +7.2/15.0
- DSCR +6.7/10.0
- 1% rule +4.4/10.0
- Livability +3.7/5.0
- Rent growth +3.2/5.0
- Schools +2.6/10.0
- Condition / age +2.5/5.0
- Appreciation +0.0/10.0
$179,900
🖨 Deal sheet (PDF) 📄 Offer letter ✓ Due diligence
Listing remarks MLS
Don't miss out on an amazing opportunity in the heart of Lafayette! This property presents an ideal canvas for renovation and revitalization poised to unlock its full potential with strategic updates and improvements. With its prime location and solid bones, this house offers a lucrative opportunity for investors looking to flip or rent! New roof in 2016, new furnace 2020. Turn this vision into profit!
Key facts
- Walkout balcony
- Enclosed porch
- 3,456 sq ft lot
Tags
Property features AI
Exterior
- Parking: Detached gravel garage; 1 garage space
- Utilities: Public water; Sewer: None specified; Cable available
- Home design: Single-family residence (site-built); 2 stories
- Construction: Stone and vinyl siding exterior; Block foundation; Asphalt/rubber shingle roof; Built as a site-built home
- Exterior features: Balcony; Enclosed porch
Interior
- Kitchen: Refrigerator; Gas oven; Gas range
- Bedrooms: Total of 8 rooms (bedroom count not specified)
- Flooring: Carpet; Vinyl
- Bathrooms: 2 full bathrooms; 1 main-level bathroom
- Heating & cooling: Natural gas forced air heating; Window and wall cooling units
- Interior features: Laminate counters; Window treatments; Finished full basement with sump pump
- Laundry & utility: Washer; Dryer; Washer hookup and electric dryer hookup on main level
Neighborhood map
What this means for you Summary
Snapshot
- This is a 4-bed/1.0-bath single-family listed at $180k.
Deal economics
- At list price, monthly cash flow is $251 ($3k/yr) — positive.
- The deal already cash-flows at list — no discount required.
- To meet the 1% rule (rent ≥ 1% of price), the offer needs to be $169k (6.0% below list).
- Recommended offer: $169k (6.0% below list) — sets the bar for 1% rule.
- Cap rate 8.0% vs local median 4.2% in Lafayette — top-decile yield for the area; either an underpriced asset or a hidden risk that comps aren't pricing in. Stress-test before assuming the spread holds.
Location & tenants
- Location reads 74/100 on livability (#68 in IN, #4,374 nationally) — a middle-class / working-renter tenant base. Strengths: cost of living A+, housing A+, health & safety A+; Watch: amenities D+, employment D+, crime F.
- Lafayette School Corporation (urban): math 29% / reading 34% proficiency, ranked #235 of 301 in IN (top 78%) — families likely to look elsewhere, expect single-tenant / working-renter base with shorter leases; 63% free/reduced lunch — lower-income household profile, screen leases tightly.
- Zoned schools: Vinton Elementary School (math 42% / reading 27%, grade F, #597 of 994 statewide, top 63%, 452 students, 86% FRL); Lafayette Sunnyside Intermediate (math 26% / reading 26%, grade F, #240 of 330 statewide, top 73%, 1,047 students, 77% FRL); Jefferson High School (math 23% / reading 55%, grade F, #235 of 369 statewide, top 65%, 2,118 students, 69% FRL).
- Market conditions: Rents rising (+2.8%/yr); 75 active listings in the ZIP; 15 comparable units currently listed for rent nearby; rentals at typical pace (median 15d on market — plan ~3-4 weeks tenant-placement turnaround); 1,341 units permitted in Tippecanoe County in 2024 (869 in 5+ unit buildings).
- This rent runs 39% of the median local income ($52k/yr) — at the standard rent-burdened threshold; future hikes will face affordability resistance.
Forward outlook
- Local home prices are declining (-3.0%/yr); year-one equity from $1k of loan paydown is wiped out by about $5k of value loss. Plan a longer hold.
- Tippecanoe County population projected at +41% by 2050 — long-run rental-demand tailwind backs the buy-and-hold thesis.
Negotiation context
- It's been on market 40 days — a 3% lower offer ($175k) is reasonable based on typical stale-listing flexibility.
- 3 sale attempts since 2y ago; this cycle's ask has dropped $19k (10%) from the opening price — seller is motivated, your offer sets the floor, not the list.
- Current owner paid $120k; 50% above their basis — modest negotiation headroom, anchor on the comps not their cost.
Risks & watch-outs
- Watch-outs: built in 1915 — expect roof / HVAC / electrical / plumbing capex.
Questions for the listing agent
- It's been on market 40 days. Have you received any prior offers? Is the seller open to a 6% concession, seller financing, or rate buy-down credit?
- Built in 1915 — when were the roof, HVAC, electrical panel, plumbing, and water heater last replaced?
- Is there a deadline driving the sale (1031 exchange, divorce, estate, relocation)? That informs how much negotiation room exists.
- Schools are D-rated, which usually means shorter tenancies and higher turnover. Who's the typical renter profile here, and what's been the actual vacancy rate?
- Crime grade is F in this area — have there been break-ins, vandalism, or insurance claims at this property in the last 3 years? What carrier currently insures it and at what premium?
- What's the average days-on-market for RENTAL listings here right now (not sales)? A rising rental-DOM trend means longer vacancies and softer asking-rent achievability than the comps imply.
- What's the recent tenant-quality profile in this submarket — average credit score on applications, eviction rate, late-payment / NSF rate, and stable-employment percentage? A property-management company in the area should have these aggregated.
- How much new for-sale + rental construction is in the pipeline within 1–3 miles? Heavy new supply typically softens prices + rents 12–24 months out; constrained supply supports both.
Investment metrics
- 1% rule
- 0.94% ✗
- Cap rate
- 7.97%
- Cash-on-cash
- 5.98%
- DSCR
- 1.27
- GRM
- 8.9
CMA / ARV
- ARV (median comp)
- $178,641
- List price
- $179,900
- Delta
- 0.70%
- Verdict
- FAIR
- Comps
- 20 within 1.0 mi
Show comp detail 12 sales within ~0.75 mi
| Address | Dist | Beds/Ba | Sqft | Sold | Price | $/sf | Match |
|---|---|---|---|---|---|---|---|
| 1123 N 9th St | 0.28mi | 3/1.5 (-1) | 1,552 (+2%) | 1mo | $236,000 | $152 | 75 |
| 1039 Tulip Ln | 0.68mi | 4/1.5 | 1,534 (+1%) | 3mo | $228,000 | $149 | 62 |
| 1118 Cincinnati St | 0.22mi | 3/2.0 (-1) | 1,632 (+8%) | 9mo | $148,000 | $91 | 61 |
| 1410 Morton St | 0.38mi | 3/1.0 (-1) | 1,392 (-8%) | 9mo | $100,000 | $72 | 57 |
| 1213 Morton St | 0.35mi | 3/1.5 (-1) | 1,683 (+11%) | 4mo | $220,000 | $131 | 55 |
| 1430 N 16th St | 0.44mi | 3/2.0 (-1) | 1,408 (-7%) | 6mo | $152,000 | $108 | 53 |
| 1904 Greenbush St | 0.57mi | 4/2.0 | 1,652 (+9%) | 4mo | $250,000 | $151 | 51 |
| 1706 Pierce St | 0.39mi | 3/2.0 (-1) | 1,700 (+12%) | 9mo | $210,000 | $124 | 45 |
| 414 Cincinnati St | 0.55mi | 3/2.0 (-1) | 1,701 (+12%) | 0mo | $275,000 | $162 | 45 |
| 1811 N 15th St | 0.64mi | 3/2.0 (-1) | 1,664 (+10%) | 3mo | $220,000 | $132 | 43 |
| 1940 Morton St | 0.59mi | 3/1.5 (-1) | 1,328 (-12%) | 4mo | $156,000 | $117 | 42 |
| 2217 Rainbow Dr | 0.71mi | 3/1.5 (-1) | 1,698 (+12%) | 7mo | $200,000 | $118 | 34 |
Match score weights: distance 35% · size 25% · config 20% · recency 20%. Top-matched comps best support the ARV.
Projected returns pro-forma
-3.0% appreciation · 2.8% rent growth · sell at horizon
- IRR
- -7.3%
- Equity multiple
- 0.73×
- Total profit
- $-13,568
- Equity at exit
- $26,824
- IRR
- 2.0%
- Equity multiple
- 1.14×
- Total profit
- $7,101
- Equity at exit
- $15,554
Cash invested: $50,372 (down + closing). Projections, not guarantees.
Landlord ↔ Tenant lean methodology
- Overall (STATE)
- 90 Strongly Landlord-Friendly
- State Indiana
- 90 Strongly Landlord-Friendly · R+11
- County
- — inherits STATE
- City
- — inherits STATE
ZIP-level market 47904
- Rents YoY
- 2.8%
- Active inventory
- 75
- Price-to-rent
- 8.9×
Monthly cashflow live
- Estimated rent
- $1,691 high interval (Pro) →
- Mortgage (P&I)
- −$943
- Tax from tax record
- −$66 /mo · $796/yr
- Insurance
- −$75
- HOA
- −$0
- Vacancy / Maint / Mgmt
- −$355
- Net cashflow
- $251
Break-even live
Sensitivity live
| Price | -10% $353 | -5% $302 | +0% $251 | +5% $200 | +10% $149 |
|---|---|---|---|---|---|
| Rent | -10% $118 | -5% $184 | +0% $251 | +5% $318 | +10% $385 |
| Rate | -1.0pp $342 | -0.5pp $297 | base $251 | +0.5pp $205 | +1.0pp $157 |
UW: 25.0% down · 7.5% · 30yr · 1.5% tax · 5.0% vac · 8.0% maint · 8.0% mgmt
Financing live
Cash to close
- Down payment
- $44,975
- Closing costs
- $5,397
- Reserves months
- —
- Total cash needed
- —
Loan-product check · same deal, 3 products live
Conventional
25% down · 7.5% · 30yr
- Down + closing
- —
- Monthly P&I
- —
- Monthly cashflow
- —
- DSCR
- —
- Eligible?
- —
Personal DTI + credit; lowest rate.
DSCR
20% down · 8.5% · 30yr
- Down + closing
- —
- Monthly P&I
- —
- Monthly cashflow
- —
- DSCR
- —
- Eligible?
- —
No personal income docs; deal must DSCR.
Hard money
10% down · 12.0% · 12mo
- Down + closing
- —
- Monthly P&I
- —
- Monthly cashflow
- —
- DSCR
- —
- Eligible?
- —
Short-term bridge; refi at stabilization.
Rent comps 15 comps
| Address | Beds | Baths | Sqft | Rent | $/sqft | DOM | Units | Dist |
|---|---|---|---|---|---|---|---|---|
| 1038 Heath St Unit 1038 1/2 Lafayette, IN | 4.0 | 2.0 | 1650 | $1,850 | $1.12 | 22d | 1 | 0.23mi |
| 1510 N 10th St Unit FP205 Lafayette, IN | 3.0 | 1.0 | 1050 | $1,197 | $1.14 | 15d | 1 | 0.48mi |
| 1707 Meharry St Lafayette, IN | 3.0 | 2.0 | 1348 | $1,500 | $1.11 | 22d | 1 | 0.57mi |
| 327 N 23rd St Lafayette, IN | 4.0 | 2.5 | 2002 | $1,995 | $1.00 | 15d | 1 | 0.77mi |
| 224 S 14th St Lafayette, IN | 4.0 | 2.0 | 1900 | $1,810 | $0.95 | 15d | 1 | 0.78mi |
| 1611 Grove St Lafayette, IN | 3.0 | 1.5 | 1250 | $1,195 | $0.96 | 15d | 1 | 0.78mi |
| 407 N 24th St Lafayette, IN | 3.0 | 2.0 | 1388 | $2,200 | $1.59 | 45d | 1 | 0.80mi |
| 6 S 4th St Lafayette, IN | 1.0–3.0 | 1.0–3.0 | 1102 | $1,649 | $1.50 | 15d | 1 | 0.82mi |
| 320 Brown St West Lafayette, IN | 1.0–4.0 | 1.0–2.0 | 835 | $1,599 | $1.91 | 15d | 12 | 0.89mi |
| 400 N River Rd West Lafayette, IN | 3.0 | 1.0–3.0 | 693 | $1,229 | $1.77 | 15d | 42 | 0.93mi |
| 1609 Arlington Rd Lafayette, IN | 3.0 | 1.0 | 1268 | $1,300 | $1.03 | 22d | 1 | 0.94mi |
| 270 Littleton St West Lafayette, IN | 4.0 | 1.0–2.5 | 972 | $1,115 | $1.15 | 22d | 1 | 1.06mi |
| 932 Robinson St West Lafayette, IN | 3.0 | 1.5 | 1944 | $2,800 | $1.44 | 15d | 1 | 1.31mi |
| 2773 PROSPERITY WAY West Lafayette, IN | 3.0 | 2.0 | 1691 | $3,095 | $1.83 | 22d | 1 | 1.32mi |
| 2209 Monon Ave Lafayette, IN | 3.0 | 2.0 | 2200 | $1,650 | $0.75 | 45d | 1 | 1.39mi |
Listing history 13 events
-
2026-06-07statusdays on market $179,900 Pending 40 DOM
-
2026-06-02days on market $179,900 Active 38 DOM
-
2026-06-01days on market $179,900 Active 37 DOM
-
2026-05-31days on market $179,900 Active 36 DOM
-
2026-05-30days on market $179,900 Active 35 DOM
-
2026-05-14price $179,900 966-char remark
-
2026-05-05price $189,000 966-char remark
-
2026-04-25$199,000 Active 966-char remark
-
2026-03-02historical $1,600
-
2026-01-29$1,600
-
2024-04-02soldstatus $120,000 Closed 406-char remark
Show marketing remark (406 chars)
Don't miss out on an amazing opportunity in the heart of Lafayette! This property presents an ideal canvas for renovation and revitalization poised to unlock its full potential with strategic updates and improvements. With its prime location and solid bones, this house offers a lucrative opportunity for investors looking to flip or rent! New roof in 2016, new furnace 2020. Turn this vision into profit!
-
2024-03-12status Pending 406-char remark
Show marketing remark (406 chars)
Don't miss out on an amazing opportunity in the heart of Lafayette! This property presents an ideal canvas for renovation and revitalization poised to unlock its full potential with strategic updates and improvements. With its prime location and solid bones, this house offers a lucrative opportunity for investors looking to flip or rent! New roof in 2016, new furnace 2020. Turn this vision into profit!
-
2024-02-20$140,000 Active 406-char remark
Show marketing remark (406 chars)
Don't miss out on an amazing opportunity in the heart of Lafayette! This property presents an ideal canvas for renovation and revitalization poised to unlock its full potential with strategic updates and improvements. With its prime location and solid bones, this house offers a lucrative opportunity for investors looking to flip or rent! New roof in 2016, new furnace 2020. Turn this vision into profit!
ⓘ Source: listings_history table (triggers on properties + properties_extension) + one-shot
backfill from property_details.listing_events for pre-trigger history.
Tax reassessment forecast IN · Partial reset (capped growth)
- Current annual tax
- $796 · $66/mo
- Projected year-2 tax
- $1,163 · $97/mo
- Expected delta
- +$366/yr (+$31/mo · 46.0%)
ⓘ Screening estimate from a state-policy table — verify with the county assessor before closing.
Climate risk First Street
- Flood 4/10 Moderate FEMA zone X (unshaded) · 22% chance over 30 yrs
- Wildfire 1/10 Low
- Heat 4/10 Moderate 7 d/yr ≥102°F today · 18 d/yr by 30 yrs out
- Wind 2/10 Low
- Air quality 2/10 Low 1 unhealthy d/yr today · 2 by 30 yrs out
Nearby sold comps map
Loading sold comps map…
Walkable amenities ~0.75 mi
Loading nearby amenities…
Taxation est. · year 1
- Rental income
- $20,292
- − Mortgage interest
- −$10,077
- − Property taxes
- −$796
- − Insurance
- −$900
- − Repairs & maintenance
- −$1,623
- − Management
- −$1,623
- − Depreciation
- −$5,233
- Taxable income
- $39
- Est. tax owed @ 24.0%
- −$9
- After-tax cash flow
- $3,004/yr
For passive investors: Depreciation is non-cash, so a rental often shows a tax loss while cash-flowing — sheltering income. Rental losses are passive: they offset passive income freely, and up to $25,000/yr can offset ordinary (W-2) income if you actively participate and your MAGI is under $100k (phasing out to $0 by $150k); unused losses carry forward. On sale, claimed depreciation is recaptured at up to 25%, and gains may owe capital-gains tax (a 1031 exchange can defer both). Figures are a year-1 estimate at your 24.0% rate — not tax advice; consult a CPA.
Schools (NCES district)
- District
- Lafayette School Corporation
- NCES district ID
- 1805400
- Math proficiency
- 29% ▼ -9.00%
- Reading proficiency
- 34% ▼ -7.00%
- Median HH income
- $39,817
- Composite
- 26.46/100
- National rank
- #7217
- State rank
- #235 of 301 in IN
Livability — Lafayette
- Score
- 74/100
- State rank
- #68
- US rank
- #4374
Category grades
Schools grade is shown separately in the Schools card above.
Census & demographics
- Census place
- Lafayette, IN
- County
- Tippecanoe County · 181,820 people
- City population
- 106,622
- Metro
- Lafayette-West Lafayette, IN
- Population (ZIP)
- 16,257
- Household income
- $51,687
- Rent vs Own
- Severe rent burden
- 563.0
Population outlook (Tippecanoe County) Hauer SSP2
- Today (2025)
- 215,327 people
- By 2030
- 232,284 · +7.9%
- By 2040
- 266,517 · +23.8%
- By 2050
- 302,826 · +40.6%
- By 2075
- 394,445 · +83.2%
- By 2100
- 463,500 · +115.3%
Race, ethnicity, and origin ACS 2023
- Neighborhood character
- Predominantly White (73%)
- Race & ethnicity
- White 73% Hispanic / Latino 16% Two or more races 11% Black 5% Asian 1%
- Hispanic origin (detail)
- Mexican 14%
- Common ancestry
- Romanian 3% Lithuanian 1% Iranian 1%
- Foreign-born
- 9% · Canada, China
- Languages at home
- 88% English-only · Spanish 10% Other Asian/Pacific 1%
Political lean MEDSL · Tippecanoe
- 2024 margin
- Toss-up / Even · D 49.0% · R 49.1% · Other 1.9%
- 2008→2024 swing
- -11.8pp toward R · 2008: 11.6pp · 2024: -0.1pp
- All cycles
- 2024: R+0.1 2020: D+0.6 2016: R+5.7 2012: R+3.6 2008: D+11.6
Not yet ingested
- Civics
- —
Market trends
- HPI YoY
- ▼ -147.53%
- Current HPI
- 227.1555
- Rent YoY
- ▲ 2.80%
- Metro
- Lafayette-West Lafayette, IN
- State GDP YoY
- ▲ 2.90%
- F500 in state
- 18
Industry mix (Fortune 500 HQ in IN)
| Industry | F500 HQs | Revenue |
|---|---|---|
| Industrial Machinery | 2 | $37B |
|
||
| Healthcare | 1 | $177B |
|
||
| Pharmaceuticals | 1 | $45B |
|
||
| Metals / Steel | 1 | $18B |
|
||
| Agriculture | 1 | $17B |
|
||
| Packaging | 1 | $12B |
|
||
Price history
+28.5% since first listed9 events — show timeline
- 2026-06-05 Pending — IRMLS
- 2026-05-14 Price Changed $179,900 IRMLS
- 2026-05-05 Price Changed $189,000 IRMLS
- 2026-04-25 Listed $199,000 IRMLS
- 2026-03-02 Rental Removed $1,600 APPFOLIO
- 2026-01-29 Listed for Rent $1,600 APPFOLIO
- 2024-04-02 Sold (MLS) $120,000 IRMLS
- 2024-03-12 Pending — IRMLS
- 2024-02-20 Listed $140,000 IRMLS
Property tax history
+12.0%/yrLatest (2024): $796 · +20.5% YoY. Source: county tax records.
Cash-flow waterfall
monthlySold comps — $/sqft
last 12 mo · ≤1 miLoading sold comps…