3625 N Country Club Dr #304 · Aventura, FL
Flood risk 8/10 · Major
- FEMA flood zone
- X
- Chance of flooding over 30 yrs
- 0.98%
- Est. flood insurance / yr
- $507 – $1,088
Fire risk 1/10 · Minimal
- Est. fire insurance / yr
- $947 – $1,759
Heat risk 10/10 · Severe
- Hot days now (above 103°F)
- 7 days/yr
- Hot days in 30 yrs
- 25 days/yr
Wind risk 10/10 · Severe
- Chance of severe wind over 30 yrs
- 99.0%
Air-quality risk 2/10 · Minimal
- Unhealthy air days now
- 1 days/yr
- Unhealthy air days in 30 yrs
- 2 days/yr
Risk factors via First Street. Map © Google.
Why this score? — see what drove the B grade
The composite is a weighted blend of 9 inputs, each scored 0–100. Each bar is that input's sub-score; the figure is the points it added to the 100-point composite (weight × sub-score).
- Cash flow +30.0/30.0
- 1% rule +10.0/10.0
- DSCR +10.0/10.0
- ARV discount +7.5/15.0
- Schools +4.2/10.0
- Livability +4.0/5.0
- Condition / age +2.5/5.0
- Rent growth +2.1/5.0
- Appreciation +0.0/10.0
$189,000
🖨 Deal sheet (PDF) 📄 Offer letter ✓ Due diligence
Listing remarks
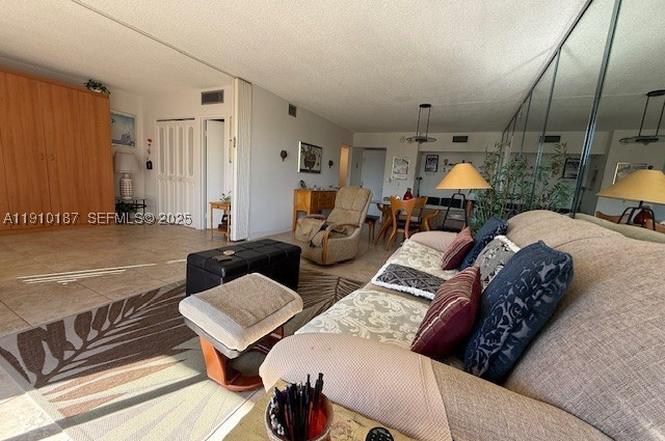
Spacious 2-bedroom (1+Den), 1.5-bath unit in original condition, ready for full renovation. Great opportunity to customize and create your ideal home. Features a bright floor plan with golf course and street views. Building offers pool, fitness center, clubhouse, and 24-hour security. Convenient Aventura location near shopping, dining, and beaches. No leasing allowed during the first two years of ownership. Sellers are motivated and open to negotiation.
Key facts
- Fitness center
- Street views
- Clubhouse
Tags
Property features AI
Finance
- Financial info: Pets not allowed
- HOA & community: Monthly association fee of $1,200; Association amenities include clubhouse, elevators, fitness center, pool, and trash service
Exterior
- Parking: Assigned parking; One covered space (garage)
- Security: Doorman; Secured elevator; Security guard
- Utilities: Association pool
- Home design: Condo/attached property; Faces south; Entry on level 3; 27-story building
- Construction: Block construction; Effective year built
- Exterior features: Balcony (open); Canal-front waterfront
Interior
- Kitchen: Electric range; Refrigerator
- Bedrooms: Includes main-level bedroom
- Flooring: Carpet
- Bathrooms: 2 full bathrooms
- Heating & cooling: Central heating; Central air conditioning
- Interior features: Accessible elevator installed; First-floor entry; Bedroom on main level; Eat-in kitchen; Open living/dining area; Elevator
- Laundry & utility: Electric water heater
Neighborhood map
What this means for you Summary
Snapshot
- This is a 2-bed/2.0-bath condo listed at $189k.
Deal economics
- At list price, monthly cash flow is $769 ($9k/yr) — positive.
- The deal already cash-flows at list — no discount required.
- Meets the 1% rule at list price ($4k rent vs $189k).
- Recommended offer: $166k (12.0% below list) — sets the bar for market timing.
- Cap rate 11.6% vs local median 2.6% in Aventura — top-decile yield for the area; either an underpriced asset or a hidden risk that comps aren't pricing in. Stress-test before assuming the spread holds.
Location & tenants
- Location reads 80/100 on livability (#127 in FL, #1,834 nationally) — a professional / high-income tenant draw. Strengths: schools A+, health & safety A+, amenities A; Watch: crime D+, cost of living F.
- Miami-Dade (suburban): math 45% / reading 54% proficiency, ranked #40 of 73 in FL (top 55%) — families likely to look elsewhere, expect single-tenant / working-renter base with shorter leases; 64% free/reduced lunch — lower-income household profile, screen leases tightly.
- Market conditions: Rents soft (-1.5%/yr); 992 active listings in the ZIP; 40 comparable units currently listed for rent nearby; rentals at typical pace (median 25d on market — plan ~3-4 weeks tenant-placement turnaround); solid renter incomes; 10,051 units permitted in Miami-Dade County in 2024 (7,758 in 5+ unit buildings).
- At $4,056/mo this rent would consume 53% of the median local household income ($91k/yr) (locally 1838% of renters already pay >50% of income on rent) — very limited rent-growth headroom before tenants either downsize or default.
Forward outlook
- Local home prices are declining (-3.0%/yr); year-one equity from $1k of loan paydown is wiped out by about $6k of value loss. Plan a longer hold.
- Miami-Dade County population projected at +28% by 2050 — long-run rental-demand tailwind backs the buy-and-hold thesis.
Negotiation context
- It's been on market 226 days — a 12% lower offer ($166k) is reasonable based on typical stale-listing flexibility.
- 2 sale attempts since 3y ago; this cycle's ask has dropped $50k (21%) from the opening price — seller is motivated, your offer sets the floor, not the list.
- Current owner paid $100k; list at $189k implies a 89% gain — meaningful room to come down on a strong offer.
Risks & watch-outs
- Watch-outs: flood insurance adds $66/mo; HOA is 30% of rent.
- Climate carrying-cost: severe flood risk; severe wind risk, 99% chance of damaging wind over 30y; extreme-heat days projected 7→25/yr by 2055 (HVAC capex compounding) — expect insurance premiums to compound above CPI over the hold.
Questions for the listing agent
- It's been on market 226 days. Have you received any prior offers? Is the seller open to a 12% concession, seller financing, or rate buy-down credit?
- Built in 1974 — when were the roof, HVAC, electrical panel, plumbing, and water heater last replaced?
- What's the actual annual flood-insurance premium (NFIP or private), and is the property in a SFHA with mandatory coverage?
- What does the HOA fee cover, when was the last increase, and are there any pending special assessments or reserve-fund shortfalls?
- Any open or pending special assessments — roof, HVAC, plumbing, elevator, façade? What's the per-unit balance and payoff schedule, and is the seller paying it off at close or rolling it to the buyer?
- Why hasn't it sold? Are there any deal-killer items the seller is aware of (foundation, flood, title, zoning, code violations)?
- Is there a deadline driving the sale (1031 exchange, divorce, estate, relocation)? That informs how much negotiation room exists.
- Schools are A-rated — typically a magnet for longer-tenancy family renters. What's the average tenant stay here, and is there a school-zone premium baked into asking?
- Crime grade is D in this area — have there been break-ins, vandalism, or insurance claims at this property in the last 3 years? What carrier currently insures it and at what premium?
- What's the average days-on-market for RENTAL listings here right now (not sales)? A rising rental-DOM trend means longer vacancies and softer asking-rent achievability than the comps imply.
- What's the recent tenant-quality profile in this submarket — average credit score on applications, eviction rate, late-payment / NSF rate, and stable-employment percentage? A property-management company in the area should have these aggregated.
- How much new apartment / multifamily construction is in the pipeline within 1–3 miles? Heavy new supply (>2% of stock underway) typically softens rents 12–24 months out; light construction supports rent growth.
Investment metrics
- 1% rule
- 2.15% ✓
- Cap rate
- 11.59%
- Cash-on-cash
- 18.93%
- DSCR
- 1.84
- GRM
- 3.9
CMA / ARV
No comps found within radius.
Projected returns pro-forma
-3.0% appreciation · 0.0% rent growth · sell at horizon
- IRR
- 3.7%
- Equity multiple
- 1.14×
- Total profit
- $7,194
- Equity at exit
- $28,181
- IRR
- 8.3%
- Equity multiple
- 1.50×
- Total profit
- $26,431
- Equity at exit
- $16,341
Cash invested: $52,920 (down + closing). Projections, not guarantees.
Landlord ↔ Tenant lean methodology
- Overall (STATE)
- 87 Strongly Landlord-Friendly
- State Florida
- 87 Strongly Landlord-Friendly · R+3
- County
- — inherits STATE
- City
- — inherits STATE
ZIP-level market 33180
- Rents YoY
- -1.5%
- Active inventory
- 992
- Price-to-rent
- 3.9×
Monthly cashflow live
- Estimated rent
- $4,056 high interval (Pro) →
- Mortgage (P&I)
- −$991
- Tax from tax record
- −$99 /mo · $1,188/yr
- Insurance
- −$79
- Flood insurance flood zone
- −$66 /mo · $798/yr
- HOA
- −$1,200
- Vacancy / Maint / Mgmt
- −$852
- Net cashflow
- $769
Break-even live
Sensitivity live
| Price | -10% $876 | -5% $822 | +0% $769 | +5% $715 | +10% $662 |
|---|---|---|---|---|---|
| Rent | -10% $448 | -5% $608 | +0% $769 | +5% $929 | +10% $1,089 |
| Rate | -1.0pp $864 | -0.5pp $817 | base $769 | +0.5pp $720 | +1.0pp $670 |
UW: 25.0% down · 7.5% · 30yr · 1.5% tax · 5.0% vac · 8.0% maint · 8.0% mgmt
Financing live
Cash to close
- Down payment
- $47,250
- Closing costs
- $5,670
- Reserves months
- —
- Total cash needed
- —
Loan-product check · same deal, 3 products live
Conventional
25% down · 7.5% · 30yr
- Down + closing
- —
- Monthly P&I
- —
- Monthly cashflow
- —
- DSCR
- —
- Eligible?
- —
Personal DTI + credit; lowest rate.
DSCR
20% down · 8.5% · 30yr
- Down + closing
- —
- Monthly P&I
- —
- Monthly cashflow
- —
- DSCR
- —
- Eligible?
- —
No personal income docs; deal must DSCR.
Hard money
10% down · 12.0% · 12mo
- Down + closing
- —
- Monthly P&I
- —
- Monthly cashflow
- —
- DSCR
- —
- Eligible?
- —
Short-term bridge; refi at stabilization.
Rent comps 40 comps
| Address | Beds | Baths | Sqft | Rent | $/sqft | DOM | Units | Dist |
|---|---|---|---|---|---|---|---|---|
| 3180 S Ocean Dr #1709 Hallandale Beach, FL | 2.0 | 2.0 | 1105 | $4,000 | $3.62 | 8d | 1 | 0.91mi |
| 3180 S Ocean Dr Hallandale Beach, FL | 2.0–3.0 | 2.0 | 1263 | $3,750 | $2.97 | 21d | 2 | 0.91mi |
| 3180 S Ocean Dr Hallandale Beach, FL | 2.0–3.0 | 2.0 | 1285 | $3,650 | $2.84 | 25d | 3 | 0.91mi |
| 3140 S Ocean Dr Hallandale Beach, FL | 2.0 | 2.0 | 1100 | $4,250 | $3.86 | 2d | 2 | 0.95mi |
| 2065 S Ocean Dr Unit 1049793P Hallandale Beach, FL | 2.0 | 2.0 | 871 | $4,971 | $5.71 | 8d | 1 | 0.98mi |
| 2080 S Ocean Dr Hallandale Beach, FL | 2.0–3.0 | 2.0–2.5 | 1270 | $3,800 | $2.99 | 4d | 11 | 0.99mi |
| 2080 S Ocean Dr Hallandale Beach, FL | 2.0–3.0 | 2.0–2.5 | 1270 | $3,900 | $3.07 | 25d | 7 | 0.99mi |
| 2080 S Ocean Dr #8 Hallandale Beach, FL | 2.0 | 2.0 | 1100 | $4,000 | $3.64 | 25d | 1 | 1.00mi |
| 1950 S Ocean Dr Unit 12M Hallandale Beach, FL | 1.0 | 1.5 | 870 | $3,800 | $4.37 | 18d | 1 | 1.18mi |
| 1950 S Ocean Dr Unit 3D Hallandale Beach, FL | 1.0 | 1.5 | 870 | $3,950 | $4.54 | 6d | 1 | 1.18mi |
| 1950 S Ocean Dr Unit 12M Hallandale Beach, FL | 1.0 | 1.5 | 870 | $3,800 | $4.37 | 3d | 1 | 1.18mi |
| 1950 S Ocean Dr Unit 3D Hallandale Beach, FL | 1.0 | 1.5 | 870 | $3,950 | $4.54 | 13d | 1 | 1.18mi |
| 1180 E Hallandale Beach Blvd Unit 1241877P Hallandale Beach, FL | 1.0–2.0 | 1.0–2.0 | 844 | $5,453 | $6.46 | 4d | 2 | 1.34mi |
| 1850 S Ocean Dr #4009 Hallandale Beach, FL | 2.0 | 1.0 | 1086 | $3,900 | $3.59 | 25d | 1 | 1.42mi |
| 1850 S Ocean Dr #3509 Hallandale Beach, FL | 2.0 | 1.0 | 1086 | $4,000 | $3.68 | 4d | 1 | 1.42mi |
| 1850 S Ocean Dr #3509 Hallandale Beach, FL | 2.0 | 1.0 | 1086 | $4,300 | $3.96 | 25d | 1 | 1.42mi |
| 1850 S Ocean Dr #2909 Hallandale Beach, FL | 2.0 | 1.0 | 1086 | $4,050 | $3.73 | 25d | 1 | 1.42mi |
| 2602 E Hallandale Beach Blvd Hallandale Beach, FL | 1.0–2.0 | 1.0–2.0 | 1092 | $5,950 | $5.45 | 25d | 3 | 1.42mi |
| 2602 E Hallandale Beach Blvd Hallandale Beach, FL | 3.0 | 1.0–3.0 | 1011 | $5,495 | $5.44 | 2d | 5 | 1.42mi |
| 2602 E Hallandale Beach Blvd Hallandale Beach, FL | 1.0–2.0 | 1.0–2.0 | 1070 | $5,950 | $5.56 | 21d | 4 | 1.42mi |
| 2600 E Hallandale Beach Blvd Unit T3208 Hallandale Beach, FL | 2.0 | 2.0 | 1030 | $6,950 | $6.75 | 25d | 1 | 1.43mi |
| 2600 E Hallandale Beach Blvd Unit T3307 Hallandale Beach, FL | 2.0 | 2.0 | 1030 | $4,500 | $4.37 | 25d | 1 | 1.43mi |
| 2600 E Hallandale Beach Blvd Unit T3110 Hallandale Beach, FL | 2.0 | 2.0 | 1028 | $3,650 | $3.55 | 25d | 1 | 1.43mi |
| 215 SE 5th St Hallandale Beach, FL | 2.0–3.0 | 2.0 | 1133 | $2,700 | $2.38 | 25d | 5 | 1.43mi |
| 2601 E Hallandale Beach Blvd Unit 1227344P Hallandale Beach, FL | 1.0–2.0 | 1.0–2.0 | 844 | $4,219 | $5.00 | 2d | 2 | 1.43mi |
| 1830 S Ocean Dr #3005 Hallandale Beach, FL | 1.0 | 1.0 | 811 | $4,000 | $4.93 | 3d | 1 | 1.46mi |
| 1830 S Ocean Dr #3909 Hallandale Beach, FL | 1.0 | 1.0 | 844 | $5,000 | $5.92 | 25d | 1 | 1.46mi |
| 1830 S Ocean Dr #4612 Hallandale Beach, FL | 1.0 | 1.0 | 844 | $4,950 | $5.86 | 25d | 1 | 1.46mi |
| 1830 S Ocean Dr #4005 Hallandale Beach, FL | 1.0 | 1.0 | 811 | $4,600 | $5.67 | 25d | 1 | 1.46mi |
| 1830 S Ocean Dr #1709 Hallandale Beach, FL | 1.0 | 1.0 | 844 | $4,500 | $5.33 | 25d | 1 | 1.46mi |
| 1830 S Ocean Dr #4307 Hallandale Beach, FL | 1.0 | 1.0 | 871 | $4,100 | $4.71 | 25d | 1 | 1.46mi |
| 1830 S Ocean Dr #3407 Hallandale Beach, FL | 1.0 | 1.0 | 871 | $4,000 | $4.59 | 25d | 1 | 1.46mi |
| 1830 S Ocean Dr #4712 Hallandale Beach, FL | 1.0 | 1.0 | 844 | $3,950 | $4.68 | 25d | 1 | 1.46mi |
| 1830 S Ocean Dr #4309 Hallandale Beach, FL | 1.0 | 1.0 | 844 | $3,900 | $4.62 | 25d | 1 | 1.46mi |
| 1830 S Ocean Dr #4212 Hallandale Beach, FL | 1.0 | 1.0 | 844 | $3,800 | $4.50 | 25d | 1 | 1.46mi |
| 1830 S Ocean Dr #1107 Hallandale Beach, FL | 1.0 | 1.0 | 871 | $3,750 | $4.31 | 25d | 1 | 1.46mi |
| 1830 S Ocean Dr #1812 Hallandale Beach, FL | 1.0 | 1.0 | 844 | $4,999 | $5.92 | 21d | 1 | 1.46mi |
| 1830 S Ocean Dr #2409 Hallandale Beach, FL | 1.0 | 1.0 | 844 | $4,300 | $5.09 | 15d | 1 | 1.46mi |
| 1830 S Ocean Dr #2412 Hallandale Beach, FL | 1.0 | 1.0 | 844 | $3,600 | $4.27 | 11d | 1 | 1.46mi |
| 1830 S Ocean Dr #4412 Hallandale Beach, FL | 1.0 | 1.0 | 844 | $4,500 | $5.33 | 8d | 1 | 1.46mi |
HOA detail condo
- Monthly dues
- $1,200 · $14,400/yr
- Likely covers
- poolgymsecurity
- Assessments
- None detected in remarks — confirm with the listing agent.
Listing history 25 events
-
2026-06-21days on market $189,000 Active 226 DOM
-
2026-06-18days on market $189,000 Active 223 DOM
-
2026-06-17days on market $189,000 Active 222 DOM
-
2026-06-16days on market $189,000 Active 221 DOM
-
2026-06-15days on market $189,000 Active 220 DOM
-
2026-06-13days on market $189,000 Active 218 DOM
-
2026-06-09days on market $189,000 Active 214 DOM
-
2026-06-08days on market $189,000 Active 213 DOM
-
2026-06-08days on market $189,000 Active 212 DOM
-
2026-06-04days on market $189,000 Active 209 DOM
-
2026-06-03days on market $189,000 Active 208 DOM
-
2026-06-02days on market $189,000 Active 207 DOM
-
2026-06-01days on market $189,000 Active 206 DOM
-
2026-05-31days on market $189,000 Active 205 DOM
-
2026-02-12price $199,900
-
2025-12-18price $220,000
-
2025-11-07$239,000 Active
-
2023-12-31historical
-
2023-08-04price $330,000
-
2023-06-10price $350,000
-
2023-05-19$365,000 Active
-
2000-11-06soldstatus $100,000
-
2000-02-18soldstatus $80,000
-
1989-05-03soldstatus $73,000
-
1979-04-01soldstatus $62,000
ⓘ Source: listings_history table (triggers on properties + properties_extension) + one-shot
backfill from property_details.listing_events for pre-trigger history.
Tax reassessment forecast FL · Resets to sale price
- Current annual tax
- $1,188 · $99/mo
- Projected year-2 tax
- $1,569 · $131/mo
- Expected delta
- +$381/yr (+$32/mo · 32.1%)
ⓘ Screening estimate from a state-policy table — verify with the county assessor before closing.
Climate risk First Street
- Flood 8/10 Severe FEMA zone X · 98% chance over 30 yrs
- Wildfire 1/10 Low
- Heat 10/10 Extreme 7 d/yr ≥103°F today · 25 d/yr by 30 yrs out
- Wind 10/10 Extreme 99% chance of damaging wind over 30 yrs
- Air quality 2/10 Low 1 unhealthy d/yr today · 2 by 30 yrs out
Nearby sold comps map
Loading sold comps map…
Walkable amenities ~0.75 mi
Loading nearby amenities…
Taxation est. · year 1
- Rental income
- $48,667
- − Mortgage interest
- −$10,587
- − Property taxes
- −$1,188
- − Insurance
- −$1,742
- − Repairs & maintenance
- −$3,893
- − Management
- −$3,893
- − HOA
- −$14,400
- − Depreciation
- −$5,498
- Taxable income
- $7,465
- Est. tax owed @ 24.0%
- −$1,792
- After-tax cash flow
- $7,431/yr
For passive investors: Depreciation is non-cash, so a rental often shows a tax loss while cash-flowing — sheltering income. Rental losses are passive: they offset passive income freely, and up to $25,000/yr can offset ordinary (W-2) income if you actively participate and your MAGI is under $100k (phasing out to $0 by $150k); unused losses carry forward. On sale, claimed depreciation is recaptured at up to 25%, and gains may owe capital-gains tax (a 1031 exchange can defer both). Figures are a year-1 estimate at your 24.0% rate — not tax advice; consult a CPA.
Schools (NCES district)
- District
- Miami-Dade
- NCES district ID
- 1200390
- Math proficiency
- 45% ▼ -16.00%
- Reading proficiency
- 54% ▼ -5.00%
- Median HH income
- $43,928
- Composite
- 41.76/100
- National rank
- #3397
- State rank
- #40 of 73 in FL
Livability — Aventura
- Score
- 80/100
- State rank
- #127
- US rank
- #1834
Category grades
Schools grade is shown separately in the Schools card above.
Census & demographics
- Census place
- Aventura, FL
- County
- Miami-Dade County · 2,697,751 people
- City population
- 34,147
- Metro
- Miami-Fort Lauderdale-Pompano Beach, FL
- Population (ZIP)
- 34,147
- Household income
- $91,055
- Rent vs Own
- Severe rent burden
- 1838.0
Population outlook (Miami-Dade County) Hauer SSP2
- Today (2025)
- 3,126,439 people
- By 2030
- 3,325,765 · +6.4%
- By 2040
- 3,697,561 · +18.3%
- By 2050
- 4,012,134 · +28.3%
- By 2075
- 4,605,612 · +47.3%
- By 2100
- 4,866,598 · +55.7%
Race, ethnicity, and origin ACS 2023
- Neighborhood character
- Diverse neighborhood (Simpson 0.59)
- Race & ethnicity
- White 46% Hispanic / Latino 45% Two or more races 28% Black 2% Asian 2%
- Hispanic origin (detail)
- Mexican 2% Puerto Rican 2% Cuban 7% Dominican 1% Salvadoran 6%
- Common ancestry
- Scotch-Irish 5% Romanian 5% Italian 3%
- Foreign-born
- 52% · Canada, Jamaica, Dominican Republic
- Languages at home
- 30% English-only · Spanish 49% Other Indo-European 6% Russian/Polish/Slavic 4%
Political lean MEDSL · Miami-Dade
- 2024 margin
- R (+11.4) · D 43.9% · R 55.4%
- 2008→2024 swing
- -27.6pp toward R · 2008: 16.1pp · 2024: -11.4pp
- All cycles
- 2024: R+11.4 2020: D+7.3 2016: D+29.6 2012: D+23.7 2008: D+16.1
Not yet ingested
- Civics
- —
Market trends
- HPI YoY
- ▼ -343.81%
- Current HPI
- 234.7715
- Rent YoY
- ▼ -1.51%
- Metro
- Miami-Fort Lauderdale-Pompano Beach, FL
- State GDP YoY
- ▲ 3.28%
- F500 in state
- 36
Industry mix (Fortune 500 HQ in FL)
| Industry | F500 HQs | Revenue |
|---|---|---|
| Industrial Technology | 2 | $29B |
|
||
| Insurance | 2 | $17B |
|
||
| Retail | 1 | $60B |
|
||
| Technology Distribution | 1 | $58B |
|
||
| Homebuilding | 1 | $35B |
|
||
| Technology Manufacturing | 1 | $35B |
|
||
Price history
+222.4% since first listed11 events — show timeline
- 2026-02-12 Price Changed $199,900 MARMLS
- 2025-12-18 Price Changed $220,000 MARMLS
- 2025-11-07 Listed $239,000 MARMLS
- 2023-12-31 Listing Removed — MARMLS
- 2023-08-04 Price Changed $330,000 MARMLS
- 2023-06-10 Price Changed $350,000 MARMLS
- 2023-05-19 Listed $365,000 MARMLS
- 2000-11-06 Sold (Public Records) $100,000 Public Records
- 2000-02-18 Sold (Public Records) $80,000 Public Records
- 1989-05-03 Sold (Public Records) $73,000 Public Records
- 1979-04-01 Sold (Public Records) $62,000 Public Records
Property tax history
+3.3%/yrLatest (2025): $1,188 · +10.9% YoY. Source: county tax records.
Cash-flow waterfall
monthlySold comps — $/sqft
last 12 mo · ≤1 miLoading sold comps…