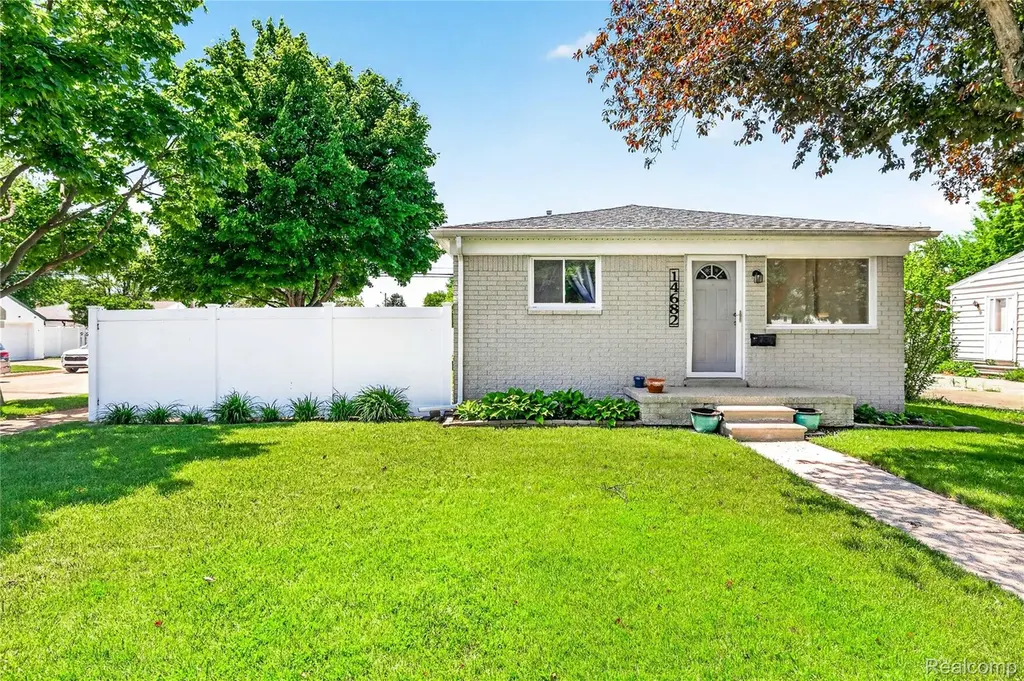
14682 Fordline St · Southgate, MI
Flood risk 3/10 · Minor
- FEMA flood zone
- X (unshaded)
- Chance of flooding over 30 yrs
- 0.2%
- Est. flood insurance / yr
- $473 – $860
Fire risk 1/10 · Minimal
- Est. fire insurance / yr
- $784 – $1,456
Heat risk 3/10 · Minor
- Hot days now (above 96°F)
- 7 days/yr
- Hot days in 30 yrs
- 15 days/yr
Wind risk 2/10 · Minimal
- Chance of severe wind over 30 yrs
- —
Air-quality risk 3/10 · Minor
- Unhealthy air days now
- 3 days/yr
- Unhealthy air days in 30 yrs
- 5 days/yr
Risk factors via First Street. Map © Google.
Why this score? — see what drove the D- grade
The composite is a weighted blend of 9 inputs, each scored 0–100. Each bar is that input's sub-score; the figure is the points it added to the 100-point composite (weight × sub-score).
- Cash flow +14.6/30.0
- DSCR +4.5/10.0
- Livability +4.2/5.0
- 1% rule +3.9/10.0
- Rent growth +3.5/5.0
- ARV discount +3.2/15.0
- Schools +2.5/10.0
- Condition / age +2.5/5.0
- Appreciation +0.0/10.0
$190,000
🖨 Deal sheet (PDF) 📄 Offer letter ✓ Due diligence
Listing remarks MLS
3 BD/1BA GREY BRICK RANCH CLOSE TO SHOPPING & SCHOOLS * LARGE CORNER LOT W/ PRIVACY FENCE * UPDATED OPEN CONCEPT KITCHEN & UPDATED BATH * APPL. STAY * HARDWOOD THRU-OUT * VINYL WINDOWS * COPPER PLUMBING * GREAT PLACE TO CALL HOME!
Key facts
- Vinyl windows
- Updated bath
- Large corner lot
Tags
Property features AI
Exterior
- Parking: No garage
- Utilities: Public water; Public sewer; Electric service with circuit breakers
- Home design: Single-family residence; One story; Ground-level entry with steps
- Construction: Aluminum siding and brick exterior; Asphalt roof; Block foundation; Built with above-grade finished area of 1,032
- Exterior features: Paved road; Porch
Interior
- Kitchen: Dishwasher; Microwave; Free-standing refrigerator; Gas water heater
- Bedrooms: Total rooms: 5
- Bathrooms: 1 full bathroom
- Heating & cooling: Central air conditioning; Forced air heating (natural gas)
- Interior features: Unfurnished; Porch; Back yard fencing; Unfinished basement
- Laundry & utility: Washer; Dryer
Neighborhood map
What this means for you Summary
Snapshot
- This is a 3-bed/1.0-bath single-family listed at $190k.
Deal economics
- At list price, monthly cash flow is $45 ($538/yr) — positive.
- The deal already cash-flows at list — no discount required.
- To meet the 1% rule (rent ≥ 1% of price), the offer needs to be $169k (11.0% below list).
- Recommended offer: $169k (11.0% below list) — sets the bar for 1% rule.
- Cap rate 6.6% vs local median 5.2% in Southgate — meaningfully above typical; check what's discounted (condition, days-on-market, listing class) to confirm the premium yield is real.
Location & tenants
- Location reads 85/100 on livability (#29 in MI, #582 nationally) — a professional / high-income tenant draw. Strengths: amenities A+, commute A+, cost of living A+; Watch: crime D-.
- Southgate Community School District (suburban): math 21% / reading 36% proficiency, ranked #379 of 540 in MI (top 70%) — low school quality limits family demand, transient renter base, plan for 1-2y turnover.
- Zoned schools: Fordline Elementary School (math 17% / reading 27%, grade F, #1,035 of 1,397 statewide, top 77%, 288 students, 64% FRL); Davidson Middle School (math 23% / reading 36%, grade F, #343 of 493 statewide, top 72%, 631 students, 52% FRL); Southgate Anderson High School (math 22% / reading 62%, grade F, #264 of 713 statewide, top 41%, 990 students, 45% FRL).
- Market conditions: Rents rising fast (+4.0%/yr); 117 active listings in the ZIP; 11 comparable units currently listed for rent nearby; rentals leasing fast (median 5d on market — plan ~1-2 weeks tenant-placement turnaround); 2,639 units permitted in Wayne County in 2024 (1,216 in 5+ unit buildings).
- This rent runs 31% of the median local income ($66k/yr) — at the standard rent-burdened threshold; future hikes will face affordability resistance.
Forward outlook
- Local home prices are declining (-3.0%/yr); year-one equity from $1k of loan paydown is wiped out by about $6k of value loss. Plan a longer hold.
- Wayne County population projected at -17% by 2050 — secular population decline; favor cash flow + early exit over multi-decade hold.
Negotiation context
- Only 12 days on market — expect competitive offers; lowballing is unlikely to land.
- 4 sale attempts since 20y ago with the ask held roughly flat each time — persistent listings suggest the price (not the market) is what's stuck; bring a comps-based counter.
- Current owner paid $77k; list at $190k implies a 147% gain — meaningful room to come down on a strong offer.
Questions for the listing agent
- Built in 1971 — when were the roof, HVAC, electrical panel, plumbing, and water heater last replaced?
- Is there a deadline driving the sale (1031 exchange, divorce, estate, relocation)? That informs how much negotiation room exists.
- Schools are D-rated, which usually means shorter tenancies and higher turnover. Who's the typical renter profile here, and what's been the actual vacancy rate?
- Crime grade is D in this area — have there been break-ins, vandalism, or insurance claims at this property in the last 3 years? What carrier currently insures it and at what premium?
- The area grade is low — what's the realistic commute time and amenity access for the typical tenant pool here? Any planned neighborhood developments (good or bad) we should know about?
- What's the average days-on-market for RENTAL listings here right now (not sales)? A rising rental-DOM trend means longer vacancies and softer asking-rent achievability than the comps imply.
- What's the recent tenant-quality profile in this submarket — average credit score on applications, eviction rate, late-payment / NSF rate, and stable-employment percentage? A property-management company in the area should have these aggregated.
- How much new for-sale + rental construction is in the pipeline within 1–3 miles? Heavy new supply typically softens prices + rents 12–24 months out; constrained supply supports both.
Investment metrics
- 1% rule
- 0.89% ✗
- Cap rate
- 6.58%
- Cash-on-cash
- 1.01%
- DSCR
- 1.05
- GRM
- 9.4
CMA / ARV
- ARV (on-the-fly)
- $173,376
- Comps found
- 12
Show comp detail 12 sales within ~0.75 mi
| Address | Dist | Beds/Ba | Sqft | Sold | Price | $/sf | Match |
|---|---|---|---|---|---|---|---|
| 14559 Balsam St | 0.29mi | 3/1.0 | 1,026 (-1%) | 2mo | $165,000 | $161 | 84 |
| 14706 Eureka Rd | 0.24mi | 3/1.0 | 1,088 (+5%) | 2mo | $192,000 | $176 | 78 |
| 14834 Kennebec St | 0.23mi | 3/1.0 | 1,088 (+5%) | 7mo | $160,000 | $147 | 75 |
| 15444 Mulberry St | 0.49mi | 3/1.0 | 1,073 (+4%) | 1mo | $180,000 | $168 | 70 |
| 14620 Trenton Rd | 0.33mi | 3/1.0 | 1,100 (+7%) | 6mo | $172,000 | $156 | 68 |
| 15464 Mulberry St | 0.51mi | 3/1.0 | 1,073 (+4%) | 2mo | $198,000 | $185 | 68 |
| 15338 Helen St | 0.42mi | 3/1.0 | 1,096 (+6%) | 4mo | $160,000 | $146 | 67 |
| 15110 Drake St | 0.46mi | 3/1.5 | 972 (-6%) | 2mo | $155,000 | $159 | 65 |
| 14420 Trenton Rd | 0.34mi | 2/1.0 (-1) | 910 (-12%) | 3mo | $165,000 | $181 | 57 |
| 15675 Mulberry St | 0.60mi | 2/2.0 (-1) | 1,073 (+4%) | 1mo | $204,000 | $190 | 56 |
| 13668 Agnes St | 0.50mi | 3/1.5 | 1,180 (+14%) | 0mo | $180,000 | $153 | 51 |
| 13080 Poplar St | 0.74mi | 3/1.0 | 1,120 (+8%) | 1mo | $227,500 | $203 | 50 |
Match score weights: distance 35% · size 25% · config 20% · recency 20%. Top-matched comps best support the ARV.
Projected returns pro-forma
-3.0% appreciation · 4.04% rent growth · sell at horizon
- IRR
- -13.5%
- Equity multiple
- 0.51×
- Total profit
- $-26,132
- Equity at exit
- $28,330
- IRR
- -3.1%
- Equity multiple
- 0.78×
- Total profit
- $-11,536
- Equity at exit
- $16,428
Cash invested: $53,200 (down + closing). Projections, not guarantees.
Landlord ↔ Tenant lean methodology
- Overall (STATE)
- 62 Landlord-Friendly
- State Michigan
- 62 Landlord-Friendly · EVEN
- County
- — inherits STATE
- City
- — inherits STATE
ZIP-level market 48195
- Rents YoY
- 4.0%
- Active inventory
- 117
- Price-to-rent
- 9.4×
Monthly cashflow live
- Estimated rent
- $1,691 high interval (Pro) →
- Mortgage (P&I)
- −$996
- Tax from tax record
- −$216 /mo · $2,586/yr
- Insurance
- −$79
- HOA
- −$0
- Vacancy / Maint / Mgmt
- −$355
- Net cashflow
- $45
Break-even live
Sensitivity live
| Price | -10% $152 | -5% $99 | +0% $45 | +5% $-9 | +10% $-63 |
|---|---|---|---|---|---|
| Rent | -10% $-89 | -5% $-22 | +0% $45 | +5% $112 | +10% $178 |
| Rate | -1.0pp $141 | -0.5pp $93 | base $45 | +0.5pp $-4 | +1.0pp $-54 |
UW: 25.0% down · 7.5% · 30yr · 1.5% tax · 5.0% vac · 8.0% maint · 8.0% mgmt
Financing live
Cash to close
- Down payment
- $47,500
- Closing costs
- $5,700
- Reserves months
- —
- Total cash needed
- —
Loan-product check · same deal, 3 products live
Conventional
25% down · 7.5% · 30yr
- Down + closing
- —
- Monthly P&I
- —
- Monthly cashflow
- —
- DSCR
- —
- Eligible?
- —
Personal DTI + credit; lowest rate.
DSCR
20% down · 8.5% · 30yr
- Down + closing
- —
- Monthly P&I
- —
- Monthly cashflow
- —
- DSCR
- —
- Eligible?
- —
No personal income docs; deal must DSCR.
Hard money
10% down · 12.0% · 12mo
- Down + closing
- —
- Monthly P&I
- —
- Monthly cashflow
- —
- DSCR
- —
- Eligible?
- —
Short-term bridge; refi at stabilization.
Rent comps 11 comps
| Address | Beds | Baths | Sqft | Rent | $/sqft | DOM | Units | Dist |
|---|---|---|---|---|---|---|---|---|
| 13750 Village Green Blvd Southgate, MI | 1.0–2.0 | 1.0 | 862 | $1,620 | $1.88 | 0d | 10 | 0.63mi |
| 13185 Sycamore St Southgate, MI | 3.0 | 1.0 | 1080 | $1,700 | $1.57 | 26d | 1 | 0.79mi |
| 13165 Turnberry Ct Southgate, MI | 2.0 | 2.0 | 1275 | $1,795 | $1.41 | 7d | 1 | 0.82mi |
| 13165 Turnberry Ct Southgate, MI | 2.0 | 2.0 | 1275 | $1,795 | $1.41 | 45d | 1 | 0.82mi |
| 13861 Strathcona St Southgate, MI | 1.0–2.0 | 1.0–1.5 | 797 | $1,140 | $1.43 | 0d | 5 | 0.83mi |
| 13210 Village Park Dr Southgate, MI | 2.0 | 1.0 | 630 | $1,125 | $1.78 | 0d | 9 | 0.97mi |
| 12939 Devoe St Southgate, MI | 3.0 | 1.0 | 1177 | $1,695 | $1.44 | 45d | 1 | 1.06mi |
| 13020 Pullman St Southgate, MI | 4.0 | 1.0 | 1050 | $1,550 | $1.48 | 4d | 1 | 1.07mi |
| 15027 Brookview Dr Riverview, MI | 1.0–2.0 | 1.0 | 1020 | $1,499 | $1.47 | 0d | 34 | 1.38mi |
| 1569 Sycamore St Wyandotte, MI | 3.0 | 1.0 | 944 | $1,695 | $1.80 | 45d | 1 | 1.44mi |
| 17400 Fort St Riverview, MI | 1.0–2.0 | 1.0 | 800 | $1,225 | $1.53 | 0d | 11 | 1.50mi |
Listing history 9 events
-
2026-06-13statusdays on market $190,000 Pending 12 DOM
-
2026-06-09days on market $190,000 Active Under Contract 11 DOM
-
2026-06-08days on market $190,000 Active Under Contract 10 DOM
-
2026-06-07days on market $190,000 Active Under Contract 9 DOM
-
2026-06-04statusdays on market $190,000 Active Under Contract 6 DOM
-
2026-06-03days on market $190,000 Active 5 DOM
-
2026-06-02days on market $190,000 Active 4 DOM
-
2026-06-01days on market $190,000 Active 3 DOM
-
2026-05-31days on market $190,000 Active 2 DOM
ⓘ Source: listings_history table (triggers on properties + properties_extension) + one-shot
backfill from property_details.listing_events for pre-trigger history.
Tax reassessment forecast MI · Partial reset (capped growth)
- Current annual tax
- $2,586 · $216/mo
- Projected year-2 tax
- $2,756 · $230/mo
- Expected delta
- +$170/yr (+$14/mo · 6.6%)
ⓘ Screening estimate from a state-policy table — verify with the county assessor before closing.
Climate risk First Street
- Flood 3/10 Moderate FEMA zone X (unshaded) · 20% chance over 30 yrs
- Wildfire 1/10 Low
- Heat 3/10 Moderate 7 d/yr ≥96°F today · 15 d/yr by 30 yrs out
- Wind 2/10 Low
- Air quality 3/10 Moderate 3 unhealthy d/yr today · 5 by 30 yrs out
Nearby sold comps map
Loading sold comps map…
Walkable amenities ~0.75 mi
Loading nearby amenities…
Taxation est. · year 1
- Rental income
- $20,292
- − Mortgage interest
- −$10,643
- − Property taxes
- −$2,586
- − Insurance
- −$950
- − Repairs & maintenance
- −$1,623
- − Management
- −$1,623
- − Depreciation
- −$5,527
- Taxable loss
- −$2,661
- Est. tax savings @ 24.0%
- +$639
- After-tax cash flow
- $1,177/yr
For passive investors: Depreciation is non-cash, so a rental often shows a tax loss while cash-flowing — sheltering income. Rental losses are passive: they offset passive income freely, and up to $25,000/yr can offset ordinary (W-2) income if you actively participate and your MAGI is under $100k (phasing out to $0 by $150k); unused losses carry forward. On sale, claimed depreciation is recaptured at up to 25%, and gains may owe capital-gains tax (a 1031 exchange can defer both). Figures are a year-1 estimate at your 24.0% rate — not tax advice; consult a CPA.
Schools (NCES district)
- District
- Southgate Community School District
- NCES district ID
- 2632340
- Math proficiency
- 21% ▼ -8.00%
- Reading proficiency
- 36% ▬ 0.00%
- Median HH income
- $49,234
- Composite
- 24.83/100
- National rank
- #7591
- State rank
- #379 of 540 in MI
Livability — Southgate
- Score
- 85/100
- State rank
- #29
- US rank
- #582
Category grades
Schools grade is shown separately in the Schools card above.
Census & demographics
- Census place
- Southgate, MI
- County
- Wayne County · 1,562,939 people
- City population
- 29,366
- Metro
- Detroit-Warren-Dearborn, MI
- Population (ZIP)
- 29,366
- Household income
- $66,118
- Rent vs Own
- Severe rent burden
- 727.0
Population outlook (Wayne County) Hauer SSP2
- Today (2025)
- 1,675,273 people
- By 2030
- 1,620,300 · -3.3%
- By 2040
- 1,502,341 · -10.3%
- By 2050
- 1,384,039 · -17.4%
- By 2075
- 1,124,592 · -32.9%
- By 2100
- 881,193 · -47.4%
Race, ethnicity, and origin ACS 2023
- Neighborhood character
- Predominantly White (75%)
- Race & ethnicity
- White 75% Hispanic / Latino 11% Black 8% Two or more races 8% Asian 3%
- Hispanic origin (detail)
- Mexican 8% Puerto Rican 1%
- Common ancestry
- Romanian 9% Lithuanian 3% Slovak 3%
- Foreign-born
- 6% · Canada, China
- Languages at home
- 90% English-only · Other Indo-European 4% Spanish 3% Other Asian/Pacific 1%
Political lean MEDSL · Wayne
- 2024 margin
- Strong D (+29.0) · D 62.7% · R 33.7% · Other 3.6%
- 2008→2024 swing
- -20.5pp toward R · 2008: 49.5pp · 2024: 29.0pp
- All cycles
- 2024: D+29.0 2020: D+38.1 2016: D+37.3 2012: D+46.9 2008: D+49.5
Not yet ingested
- Civics
- —
Market trends
- HPI YoY
- ▼ -187.28%
- Current HPI
- 207.9776
- Rent YoY
- ▲ 4.04%
- Metro
- Detroit-Warren-Dearborn, MI
- State GDP YoY
- ▲ 1.37%
- F500 in state
- 28
Industry mix (Fortune 500 HQ in MI)
| Industry | F500 HQs | Revenue |
|---|---|---|
| Automotive Parts | 3 | $48B |
|
||
| Automotive | 2 | $372B |
|
||
| Chemicals | 1 | $45B |
|
||
| Automotive Retail | 1 | $29B |
|
||
| Healthcare / Medical Devices | 1 | $23B |
|
||
| Automotive Technology | 1 | $20B |
|
||
Price history
+52.1% since first listed6 events — show timeline
- 2026-05-29 Listed $190,000 MiRealSource-MiMLS
- 2026-05-29 Listed $190,000 REALCOMP
- 2015-04-21 Sold (Public Records) $77,000 Public Records
- 2006-08-26 Listing Removed — MiRealSource-MiMLS
- 2006-04-10 Listed $124,899 REALCOMP
- 2006-04-10 Listed $124,899 MiRealSource-MiMLS
Property tax history
-0.5%/yrLatest (2025): $2,586 · -17.2% YoY. Source: county tax records.
Cash-flow waterfall
monthlySold comps — $/sqft
last 12 mo · ≤1 miLoading sold comps…