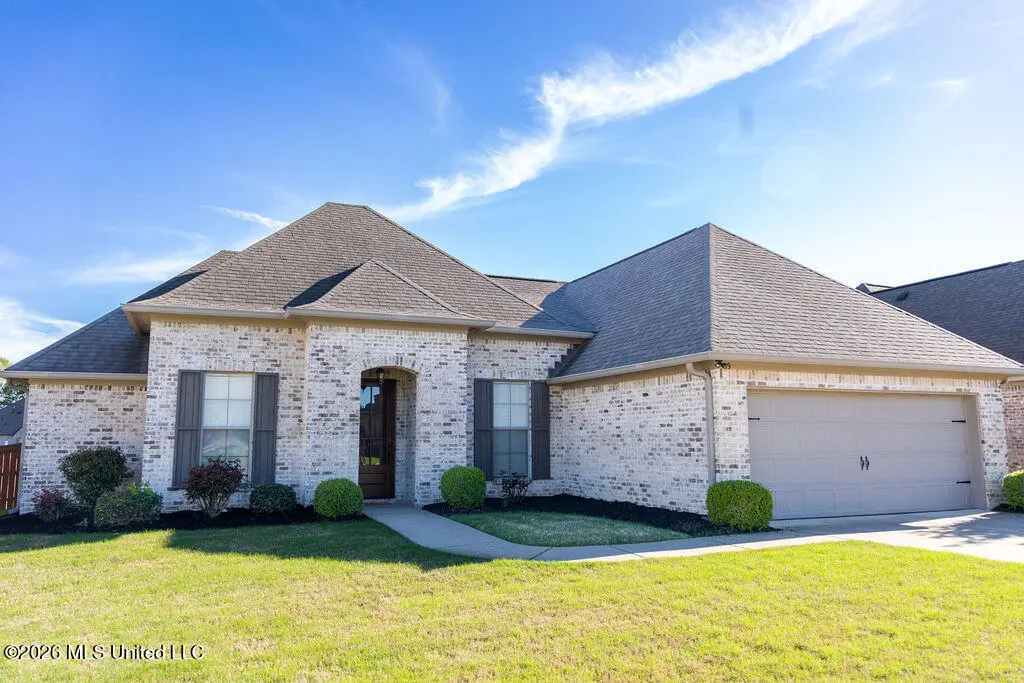
119 Essen Ln · Gluckstadt, MS
Flood risk 1/10 · Minimal
- FEMA flood zone
- X (unshaded)
- Chance of flooding over 30 yrs
- 0.0%
- Est. flood insurance / yr
- $507 – $1,088
Fire risk 3/10 · Minor
- Est. fire insurance / yr
- $1,241 – $2,305
Heat risk 7/10 · Major
- Hot days now (above 108°F)
- 7 days/yr
- Hot days in 30 yrs
- 20 days/yr
Wind risk 6/10 · Moderate
- Chance of severe wind over 30 yrs
- 76.0%
Air-quality risk 2/10 · Minimal
- Unhealthy air days now
- 0 days/yr
- Unhealthy air days in 30 yrs
- 1 days/yr
Risk factors via First Street. Map © Google.
Why this score? — see what drove the D- grade
The composite is a weighted blend of 9 inputs, each scored 0–100. Each bar is that input's sub-score; the figure is the points it added to the 100-point composite (weight × sub-score).
- Cash flow +12.6/30.0
- ARV discount +6.1/15.0
- Schools +4.8/10.0
- DSCR +3.8/10.0
- Rent growth +3.2/5.0
- 1% rule +3.1/10.0
- Livability +2.5/5.0
- Condition / age +2.5/5.0
- Appreciation +0.0/10.0
$328,000
🖨 Deal sheet (PDF) 📄 Offer letter ✓ Due diligence
Listing remarks MLS
This gorgeous home has an open concept layout and split floor plan. The house has plenty of extra features like a privacy fence,an extra large back patio, and gutters. It is practically new, as the house has been incredibly well maintained. Contact a Realtor today because this house will not be available for long.
Key facts
- 9,583 sq ft lot
- 2 garage spots
- Built 2016
Neighborhood map
What this means for you Summary
Snapshot
- This is a 3-bed/2.0-bath single-family listed at $328k.
Deal economics
- At list price, monthly cash flow is $-40 ($-482/yr) — negative.
- To cash-flow at today's rent, offer at most $321k (2.2% below list).
- To meet the 1% rule (rent ≥ 1% of price), the offer needs to be $267k (18.5% below list).
- Recommended offer: $267k (18.5% below list) — sets the bar for 1% rule.
- Cap rate 6.1% vs local median 4.9% in Gluckstadt — meaningfully above typical; check what's discounted (condition, days-on-market, listing class) to confirm the premium yield is real.
Location & tenants
- Location reads: area grade D — affects rentability + tenant quality, not the cash-flow math above.
- Madison County School District (rural): math 54% / reading 54% proficiency, ranked #3 of 130 in MS (top 2%) — acceptable for families but not a draw, mixed tenant base, ~2y average lease.
- Zoned schools: Mannsdale Elementary (633 students, 100% FRL); Germantown Middle School (math 55% / reading 58%, grade B, #14 of 179 statewide, top 7%, 1,008 students, 100% FRL); Germantown High School (math 34% / reading 41%, grade F, #59 of 197 statewide, top 30%, 1,396 students, 100% FRL) — zoned schools average 100% FRL vs 29% district-wide (70 pts higher); higher-poverty schools than district average — tighter screening recommended.
- Market conditions: Rents rising (+2.6%/yr); 634 active listings in the ZIP; 9 comparable units currently listed for rent nearby; rentals at typical pace (median 16d on market — plan ~3-4 weeks tenant-placement turnaround); high-income renter base; 553 units permitted in Madison County in 2024 (0 in 5+ unit buildings).
Forward outlook
- Local home prices are declining (-3.0%/yr); year-one equity from $2k of loan paydown is wiped out by about $10k of value loss. Plan a longer hold.
- Madison County population projected at +34% by 2050 — long-run rental-demand tailwind backs the buy-and-hold thesis.
Negotiation context
- Only 11 days on market — expect competitive offers; lowballing is unlikely to land.
- 4 sale attempts since 10y ago with the ask held roughly flat each time — persistent listings suggest the price (not the market) is what's stuck; bring a comps-based counter.
Risks & watch-outs
- Climate carrying-cost: major wind risk, 76% chance of damaging wind over 30y; extreme-heat days projected 7→20/yr by 2055 (HVAC capex compounding) — expect insurance premiums to compound above CPI over the hold.
Questions for the listing agent
- What do current leases actually rent for vs. the listed asking? Can we see a recent rent roll and the last 12 months of T-12 income?
- What does the HOA fee cover, when was the last increase, and are there any pending special assessments or reserve-fund shortfalls?
- Is there a deadline driving the sale (1031 exchange, divorce, estate, relocation)? That informs how much negotiation room exists.
- The area grade is low — what's the realistic commute time and amenity access for the typical tenant pool here? Any planned neighborhood developments (good or bad) we should know about?
- What's the average days-on-market for RENTAL listings here right now (not sales)? A rising rental-DOM trend means longer vacancies and softer asking-rent achievability than the comps imply.
- What's the recent tenant-quality profile in this submarket — average credit score on applications, eviction rate, late-payment / NSF rate, and stable-employment percentage? A property-management company in the area should have these aggregated.
- How much new for-sale + rental construction is in the pipeline within 1–3 miles? Heavy new supply typically softens prices + rents 12–24 months out; constrained supply supports both.
Investment metrics
- 1% rule
- 0.81% ✗
- Cap rate
- 6.15%
- Cash-on-cash
- -0.52%
- DSCR
- 0.98
- GRM
- 10.2
CMA / ARV
- ARV (on-the-fly)
- $318,379
- Comps found
- 12
Show comp detail 12 sales within ~0.75 mi
| Address | Dist | Beds/Ba | Sqft | Sold | Price | $/sf | Match |
|---|---|---|---|---|---|---|---|
| 128 Lakeway Dr | 0.22mi | 3/2.0 | 1,771 (+1%) | 3mo | $310,000 | $175 | 86 |
| 132 Hanover St | 0.27mi | 3/2.0 | 1,776 (+1%) | 1mo | $328,500 | $185 | 85 |
| 181 Stillhouse Creek Dr | 0.20mi | 3/2.0 | 1,687 (-4%) | 2mo | $315,000 | $187 | 82 |
| 130 Hanover St | 0.26mi | 3/2.0 | 1,704 (-3%) | 1mo | $324,000 | $190 | 81 |
| 106 Muirfield Pl | 0.33mi | 3/2.0 | 1,825 (+4%) | 3mo | $290,000 | $159 | 76 |
| 137 Owen St | 0.38mi | 3/2.0 | 1,822 (+4%) | 1mo | $328,000 | $180 | 76 |
| 200 Lakeway Dr | 0.06mi | 3/2.0 | 1,497 (-15%) | 2mo | $295,000 | $197 | 71 |
| 105 Owen St | 0.32mi | 3/2.0 | 1,906 (+8%) | 1mo | $340,000 | $178 | 70 |
| 104 Stillhollow Ln | 0.48mi | 3/2.0 | 1,690 (-4%) | 2mo | $329,900 | $195 | 69 |
| 154 Millhouse Dr | 0.34mi | 3/2.0 | 1,576 (-10%) | 2mo | $285,000 | $181 | 65 |
| 224 Stillhouse Creek Dr | 0.38mi | 4/2.0 (+1) | 1,914 (+9%) | 3mo | $340,000 | $178 | 60 |
| 112 Federal Cv | 0.52mi | 4/2.0 (+1) | 1,899 (+8%) | 1mo | $329,900 | $174 | 57 |
Match score weights: distance 35% · size 25% · config 20% · recency 20%. Top-matched comps best support the ARV.
Projected returns pro-forma
-3.0% appreciation · 2.61% rent growth · sell at horizon
- IRR
- -17.6%
- Equity multiple
- 0.38×
- Total profit
- $-56,783
- Equity at exit
- $48,906
- IRR
- -10.4%
- Equity multiple
- 0.38×
- Total profit
- $-57,117
- Equity at exit
- $28,359
Cash invested: $91,840 (down + closing). Projections, not guarantees.
Landlord ↔ Tenant lean methodology
- Overall (STATE)
- 90 Strongly Landlord-Friendly
- State Mississippi
- 90 Strongly Landlord-Friendly · R+11
- County
- — inherits STATE
- City
- — inherits STATE
ZIP-level market 39110
- Home prices YoY
- -28.3%
- Rents YoY
- 2.6%
- Active inventory
- 634
- Price-to-rent
- 10.2×
Monthly cashflow live
- Estimated rent
- $2,672 high interval (Pro) →
- Mortgage (P&I)
- −$1,720
- Tax from tax record
- −$257 /mo · $3,086/yr
- Insurance
- −$137
- HOA
- −$37
- Vacancy / Maint / Mgmt
- −$561
- Net cashflow
- $-40
Break-even live
Sensitivity live
| Price | -10% $146 | -5% $53 | +0% $-40 | +5% $-133 | +10% $-226 |
|---|---|---|---|---|---|
| Rent | -10% $-251 | -5% $-146 | +0% $-40 | +5% $65 | +10% $171 |
| Rate | -1.0pp $125 | -0.5pp $43 | base $-40 | +0.5pp $-125 | +1.0pp $-212 |
UW: 25.0% down · 7.5% · 30yr · 1.5% tax · 5.0% vac · 8.0% maint · 8.0% mgmt
Financing live
Cash to close
- Down payment
- $82,000
- Closing costs
- $9,840
- Reserves months
- —
- Total cash needed
- —
Loan-product check · same deal, 3 products live
Conventional
25% down · 7.5% · 30yr
- Down + closing
- —
- Monthly P&I
- —
- Monthly cashflow
- —
- DSCR
- —
- Eligible?
- —
Personal DTI + credit; lowest rate.
DSCR
20% down · 8.5% · 30yr
- Down + closing
- —
- Monthly P&I
- —
- Monthly cashflow
- —
- DSCR
- —
- Eligible?
- —
No personal income docs; deal must DSCR.
Hard money
10% down · 12.0% · 12mo
- Down + closing
- —
- Monthly P&I
- —
- Monthly cashflow
- —
- DSCR
- —
- Eligible?
- —
Short-term bridge; refi at stabilization.
Rent comps 9 comps
| Address | Beds | Baths | Sqft | Rent | $/sqft | DOM | Units | Dist |
|---|---|---|---|---|---|---|---|---|
| 109 Millhouse Dr Madison, MS | 3.0 | 2.0 | 1550 | $2,395 | $1.55 | 15d | 1 | 0.14mi |
| 173 Clearview Dr W Madison, MS | 3.0 | 2.0 | 1750 | $2,473 | $1.41 | 15d | 1 | 0.28mi |
| 132 Hanover St Madison, MS | 3.0 | 2.0 | 1776 | $2,650 | $1.49 | 15d | 1 | 0.31mi |
| 140 Millhouse Dr Madison, MS | 3.0 | 2.0 | 1411 | $2,400 | $1.70 | 23d | 1 | 0.33mi |
| 104 Fairwind Way Madison, MS | 3.0 | 2.0 | 1557 | $3,000 | $1.93 | 45d | 1 | 0.33mi |
| 145 Stillhouse Creek Dr Madison, MS | 3.0 | 2.0 | 1755 | $2,600 | $1.48 | 45d | 1 | 0.35mi |
| 212 Stillhouse Creek Dr Madison, MS | 3.0 | 2.0 | 1856 | $2,900 | $1.56 | 15d | 1 | 0.36mi |
| 138 Owen St Madison, MS | 3.0 | 2.0 | 1824 | $2,900 | $1.59 | 25d | 1 | 0.45mi |
| 112 Copper Ridge Ct Madison, MS | 3.0 | 2.0 | 1600 | $2,495 | $1.56 | 15d | 1 | 0.50mi |
HOA detail
- Monthly dues
- $37 · $444/yr
Listing history 13 events
-
2026-06-21days on market $328,000 Active 11 DOM
-
2026-06-18days on market $328,000 Active 8 DOM
-
2026-06-18remarks 174-char remark
-
2026-06-18status $328,000 Active 7 DOM
-
2026-04-21status Pending
-
2026-04-12$328,000 Active
-
2020-04-06soldstatus
-
2020-04-02soldstatus 315-char remark
Show marketing remark (315 chars)
This gorgeous home has an open concept layout and split floor plan. The house has plenty of extra features like a privacy fence,an extra large back patio, and gutters. It is practically new, as the house has been incredibly well maintained. Contact a Realtor today because this house will not be available for long.
-
2020-03-13$247,900 315-char remark
Show marketing remark (315 chars)
This gorgeous home has an open concept layout and split floor plan. The house has plenty of extra features like a privacy fence,an extra large back patio, and gutters. It is practically new, as the house has been incredibly well maintained. Contact a Realtor today because this house will not be available for long.
-
2018-06-05$2,300
-
2018-06-05historical
-
2016-04-15soldstatus
-
2016-01-19$231,000
ⓘ Source: listings_history table (triggers on properties + properties_extension) + one-shot
backfill from property_details.listing_events for pre-trigger history.
Tax reassessment forecast MS · Resets to sale price
- Current annual tax
- $3,086 · $257/mo
- Projected year-2 tax
- $3,086 · $257/mo
- Expected delta
- $0/yr ($0/mo · 0.0%)
ⓘ Screening estimate from a state-policy table — verify with the county assessor before closing.
Climate risk First Street
- Flood 1/10 Low FEMA zone X (unshaded) · 0% chance over 30 yrs
- Wildfire 3/10 Moderate
- Heat 7/10 Severe 7 d/yr ≥108°F today · 20 d/yr by 30 yrs out
- Wind 6/10 Major 76% chance of damaging wind over 30 yrs
- Air quality 2/10 Low 0 unhealthy d/yr today · 1 by 30 yrs out
Nearby sold comps map
Loading sold comps map…
Walkable amenities ~0.75 mi
Loading nearby amenities…
Taxation est. · year 1
- Rental income
- $32,062
- − Mortgage interest
- −$18,373
- − Property taxes
- −$3,086
- − Insurance
- −$1,640
- − Repairs & maintenance
- −$2,565
- − Management
- −$2,565
- − HOA
- −$444
- − Depreciation
- −$9,542
- Taxable loss
- −$6,153
- Est. tax savings @ 24.0%
- +$1,477
- After-tax cash flow
- $995/yr
For passive investors: Depreciation is non-cash, so a rental often shows a tax loss while cash-flowing — sheltering income. Rental losses are passive: they offset passive income freely, and up to $25,000/yr can offset ordinary (W-2) income if you actively participate and your MAGI is under $100k (phasing out to $0 by $150k); unused losses carry forward. On sale, claimed depreciation is recaptured at up to 25%, and gains may owe capital-gains tax (a 1031 exchange can defer both). Figures are a year-1 estimate at your 24.0% rate — not tax advice; consult a CPA.
Schools (NCES district)
- District
- Madison County School District
- NCES district ID
- 2802790
- Math proficiency
- 54% ▼ -7.00%
- Reading proficiency
- 54% ▼ -7.00%
- Median HH income
- $70,579
- Composite
- 48.08/100
- National rank
- #2188
- State rank
- #3 of 130 in MS
Livability — Gluckstadt
No livability data for this city. (Only ~50 U.S. cities are tracked.)
Census & demographics
- County
- Madison County · 75,005 people
- Metro
- Jackson, MS
- Population (ZIP)
- 50,443
- Household income
- $125,506
- Rent vs Own
- Severe rent burden
- 227.0
Population outlook (Madison County) Hauer SSP2
- Today (2025)
- 122,509 people
- By 2030
- 131,737 · +7.5%
- By 2040
- 148,930 · +21.6%
- By 2050
- 164,300 · +34.1%
- By 2075
- 197,495 · +61.2%
- By 2100
- 211,429 · +72.6%
Race, ethnicity, and origin ACS 2023
- Neighborhood character
- Predominantly White (76%)
- Race & ethnicity
- White 76% Black 15% Asian 4% Two or more races 3% Hispanic / Latino 2%
- Common ancestry
- Italian 6% Slovak 3% Lithuanian 3%
- Foreign-born
- 5% · China, Canada
- Languages at home
- 92% English-only · Spanish 2% Other Indo-European 2% Chinese 1%
Political lean MEDSL · Madison
- 2024 margin
- R (+17.3) · D 40.8% · R 58.0% · Other 1.2%
- 2008→2024 swing
- -1.7pp toward R · 2008: -15.6pp · 2024: -17.3pp
- All cycles
- 2024: R+17.3 2020: R+11.8 2016: R+16.1 2012: R+15.7 2008: R+15.6
Not yet ingested
- Civics
- —
Market trends
- HPI YoY
- ▼ -60.99%
- Current HPI
- 154.6909
- Rent YoY
- ▲ 2.61%
- Metro
- Jackson, MS
- State GDP YoY
- —
- F500 in state
- 0
Price history
+42.0% since first listed9 events — show timeline
- 2026-04-21 Pending — MLSU
- 2026-04-12 Listed $328,000 MLSU
- 2020-04-06 Sold (Public Records) — Public Records
- 2020-04-02 Sold (MLS) — MLSU
- 2020-03-13 Listed $247,900 MLSU
- 2018-06-05 Listing Removed — MLSU
- 2018-06-05 Listed $2,300 MLSU
- 2016-04-15 Sold (MLS) — MLSU
- 2016-01-19 Listed $231,000 MLSU
Property tax history
+26.9%/yrLatest (2025): $3,086 · +0.0% YoY. Source: county tax records.
Cash-flow waterfall
monthlySold comps — $/sqft
last 12 mo · ≤1 miLoading sold comps…