1600 Pecan Chase Cir #6 · Arlington, TX
Flood risk 1/10 · Minimal
- FEMA flood zone
- X (unshaded)
- Chance of flooding over 30 yrs
- 0.0%
- Est. flood insurance / yr
- $507 – $1,088
Fire risk 1/10 · Minimal
- Est. fire insurance / yr
- $1,222 – $2,270
Heat risk 7/10 · Major
- Hot days now (above 109°F)
- 7 days/yr
- Hot days in 30 yrs
- 23 days/yr
Wind risk 6/10 · Moderate
- Chance of severe wind over 30 yrs
- 27.0%
Air-quality risk 3/10 · Minor
- Unhealthy air days now
- 2 days/yr
- Unhealthy air days in 30 yrs
- 4 days/yr
Risk factors via First Street. Map © Google.
Why this score? — see what drove the C+ grade
The composite is a weighted blend of 9 inputs, each scored 0–100. Each bar is that input's sub-score; the figure is the points it added to the 100-point composite (weight × sub-score).
- Cash flow +23.6/30.0
- 1% rule +9.0/10.0
- DSCR +7.6/10.0
- ARV discount +7.5/15.0
- Livability +3.9/5.0
- Rent growth +3.5/5.0
- Schools +2.5/10.0
- Condition / age +2.5/5.0
- Appreciation +0.0/10.0
$95,000
🖨 Deal sheet 📄 Offer letter ✓ Due diligence
Listing remarks
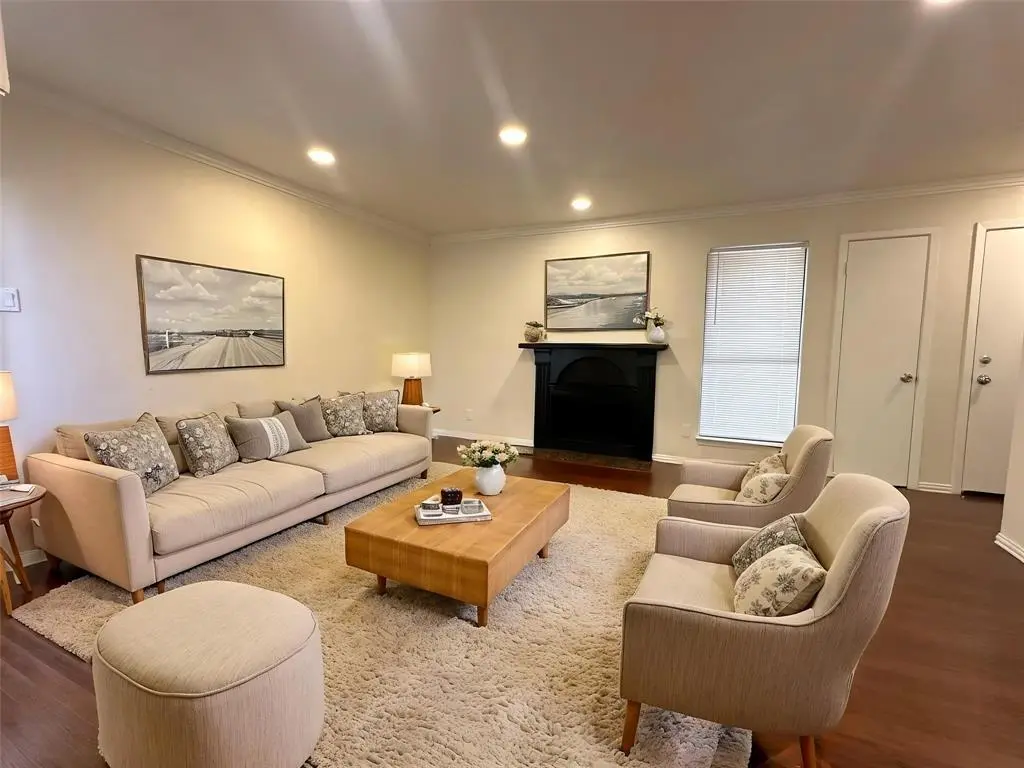
Prime Opportunity in the Heart of Arlington’s Entertainment District! This move-in-ready upgraded and updated, 1-bedroom, 1-bathroom condo at Pecan Chase offers the perfect blend of affordability and location. This unit features a functional, open-concept layout highlighted by a cozy wood-burning fireplace and durable wood-look flooring throughout—no carpet to maintain! as well as updated lighting, upgraded kitchen, Crown molding, Fresh paint, and so forth. The Open kitchen with Movable Island flows seamlessly from the dining into living areas, making the space feel open, bright and inviting. Practicality is key with in-unit laundry hookups, large walk in closets, custom bathroo
Key facts
- Updated kitchen
- Open concept layout
- Custom bathroom
Tags
Property features AI
Finance
- Other: Condominium complex: Pecan Chase Condominiums; Unit is part of a managed community with shared facilities
- Financial info: No second mortgage reported; Loan type treated as clear
- HOA & community: Mandatory association; Monthly association fee of $138; Association covers full use of facilities and grounds maintenance; HOA managed by Allied HOA Management
Exterior
- Parking: Additional off-site parking available; No garage or covered/carport spaces
- Security: Audio and video surveillance permitted for visitors
- Utilities: City water; City sewer; Not in a municipal utility district
- Home design: Condominium (residential); Two levels; Unit located on the 2nd floor, southeast corner of the building
- Construction: Brick construction; Built in 1981; Preowned condition
- Exterior features: Condominium lot setting; Community pool
Interior
- Kitchen: Disposal; Electric oven; Electric range; Eat-in kitchen with built-in cabinets
- Bedrooms: One bedroom (primary bedroom on the 2nd floor with walk-in closet)
- Flooring: No flooring details provided
- Bathrooms: One full bathroom (primary bath on the 2nd floor)
- Heating & cooling: Central air; Ceiling fan(s); Electric heating
- Interior features: Decorative lighting; Eat-in kitchen; High-speed internet available; Open floorplan; Walk-in closet(s); One living area; One dining area; Decorative living room fireplace
- Laundry & utility: No specific laundry information provided
Neighborhood map
What this means for you Summary
Snapshot
- This is a 1-bed/1.0-bath condo listed at $95k.
Deal economics
- At list price, monthly cash flow is $180 ($2k/yr) — positive.
- The deal already cash-flows at list — no discount required.
- Meets the 1% rule at list price ($1k rent vs $95k).
- Recommended offer: $94k (1.5% below list) — sets the bar for market timing.
- Cap rate 8.6% vs local median 3.7% in Arlington — top-decile yield for the area; either an underpriced asset or a hidden risk that comps aren't pricing in. Stress-test before assuming the spread holds.
Location & tenants
- Location reads 78/100 on livability (#75 in TX, #2,697 nationally) — a middle-class / working-renter tenant base. Strengths: amenities A+, cost of living A+, housing A+; Watch: crime F, commute F.
- Arlington ISD (urban): math 24% / reading 34% proficiency, ranked #629 of 826 in TX (top 76%) — low school quality limits family demand, transient renter base, plan for 1-2y turnover.
- Zoned schools: Pope El (math 13% / reading 18%, grade F, #3,990 of 4,322 statewide, top 93%, 524 students, 81% FRL) — zoned schools average 81% FRL vs 60% district-wide (21 pts higher); higher-poverty schools than district average — tighter screening recommended.
- Zoned-school proficiency averages 16% at this address vs 29% district-wide (-14 pts) — the specific schools serving this property underperform the Arlington ISD average; the district grade overstates school quality for this exact location.
- Market conditions: Rents rising (+4.0%/yr); 144 active listings in the ZIP; 30 comparable units currently listed for rent nearby; rentals at typical pace (median 15d on market — plan ~3-4 weeks tenant-placement turnaround); solid renter incomes; 18,938 units permitted in Tarrant County in 2024 (8,336 in 5+ unit buildings).
Forward outlook
- Local home prices are declining (-3.0%/yr); year-one equity from $657 of loan paydown is wiped out by about $3k of value loss. Plan a longer hold.
- Tarrant County population projected at +41% by 2050 — long-run rental-demand tailwind backs the buy-and-hold thesis.
Negotiation context
- It's been on market 29 days — a 2% lower offer ($94k) is reasonable based on typical stale-listing flexibility.
- 7 sale attempts since 24y ago; this cycle's ask is 8161% above the opening price — seller raised mid-cycle; expect resistance to lowballs.
Risks & watch-outs
- Climate carrying-cost: major wind risk, 27% chance of damaging wind over 30y; extreme-heat days projected 7→23/yr by 2055 (HVAC capex compounding) — expect insurance premiums to compound above CPI over the hold.
Questions for the listing agent
- What does the HOA fee cover, when was the last increase, and are there any pending special assessments or reserve-fund shortfalls?
- Any open or pending special assessments — roof, HVAC, plumbing, elevator, façade? What's the per-unit balance and payoff schedule, and is the seller paying it off at close or rolling it to the buyer?
- Is there a deadline driving the sale (1031 exchange, divorce, estate, relocation)? That informs how much negotiation room exists.
- Schools are D-rated, which usually means shorter tenancies and higher turnover. Who's the typical renter profile here, and what's been the actual vacancy rate?
- Crime grade is F in this area — have there been break-ins, vandalism, or insurance claims at this property in the last 3 years? What carrier currently insures it and at what premium?
- What's the average days-on-market for RENTAL listings here right now (not sales)? A rising rental-DOM trend means longer vacancies and softer asking-rent achievability than the comps imply.
- What's the recent tenant-quality profile in this submarket — average credit score on applications, eviction rate, late-payment / NSF rate, and stable-employment percentage? A property-management company in the area should have these aggregated.
- How much new apartment / multifamily construction is in the pipeline within 1–3 miles? Heavy new supply (>2% of stock underway) typically softens rents 12–24 months out; light construction supports rent growth.
Investment metrics
- 1% rule
- 1.40% ✓
- Cap rate
- 8.56%
- Cash-on-cash
- 8.11%
- DSCR
- 1.36
- GRM
- 6.0
CMA / ARV
No comps found within radius.
Projected returns pro-forma
-3.0% appreciation · 3.98% rent growth · sell at horizon
- IRR
- -2.4%
- Equity multiple
- 0.91×
- Total profit
- $-2,472
- Equity at exit
- $14,165
- IRR
- 8.7%
- Equity multiple
- 1.70×
- Total profit
- $18,742
- Equity at exit
- $8,214
Cash invested: $26,600 (down + closing). Projections, not guarantees.
Landlord ↔ Tenant lean methodology
- Overall (STATE)
- 87 Strongly Landlord-Friendly
- State Texas
- 87 Strongly Landlord-Friendly · R+5
- County
- — inherits STATE
- City
- — inherits STATE
ZIP-level market 76012
- Rents YoY
- 4.0%
- Active inventory
- 144
- Price-to-rent
- 6.0×
Monthly cashflow live
- Estimated rent
- $1,329 high interval (Pro) →
- Mortgage (P&I)
- −$498
- Tax from tax record
- −$194 /mo · $2,333/yr
- Insurance
- −$40
- HOA
- −$138
- Vacancy / Maint / Mgmt
- −$279
- Net cashflow
- $180
Break-even live
UW: 25.0% down · 7.5% · 30yr · 1.5% tax · 5.0% vac · 8.0% maint · 8.0% mgmt
Financing live
Cash to close
- Down payment
- $23,750
- Closing costs
- $2,850
- Reserves months
- —
- Total cash needed
- —
Loan-product check · same deal, 3 products live
Conventional
25% down · 7.5% · 30yr
- Down + closing
- —
- Monthly P&I
- —
- Monthly cashflow
- —
- DSCR
- —
- Eligible?
- —
Personal DTI + credit; lowest rate.
DSCR
20% down · 8.5% · 30yr
- Down + closing
- —
- Monthly P&I
- —
- Monthly cashflow
- —
- DSCR
- —
- Eligible?
- —
No personal income docs; deal must DSCR.
Hard money
10% down · 12.0% · 12mo
- Down + closing
- —
- Monthly P&I
- —
- Monthly cashflow
- —
- DSCR
- —
- Eligible?
- —
Short-term bridge; refi at stabilization.
Rent comps 30 comps
| Address | Beds | Baths | Sqft | Rent | $/sqft | DOM | Units | Dist |
|---|---|---|---|---|---|---|---|---|
| 1608 Pecan Chase Cir Arlington, TX | 1.0 | 1.0 | 627 | $1,995 | $3.18 | 43d | 1 | 0.01mi |
| 1608 Pecan Chase Cir Arlington, TX | 1.0–2.0 | 1.0 | 751 | $1,350 | $1.80 | 12d | 2 | 0.01mi |
| 1736 W Randol Mill Rd Arlington, TX | 2.0 | 1.0–2.0 | 629 | $1,512 | $2.40 | 13d | 1 | 0.21mi |
| 1724 W Sanford St Unit D Arlington, TX | 1.0 | 1.0 | 620 | $1,150 | $1.85 | 2d | 1 | 0.46mi |
| 1728 Crest Point Dr Arlington, TX | 1.0 | 1.0 | 641 | $1,100 | $1.72 | 43d | 1 | 0.70mi |
| 2001 Wesley Dr Apt A Arlington, TX | 1.0 | 1.0 | 674 | $995 | $1.48 | 43d | 1 | 0.72mi |
| 1741 Crest Grove Dr Arlington, TX | 2.0 | 1.0 | 696 | $1,050 | $1.51 | 43d | 1 | 0.73mi |
| 1727 Westview Ter Arlington, TX | 1.0–2.0 | 1.5 | 859 | $1,294 | $1.51 | 2d | 10 | 1.01mi |
| 1731 Westview Ter Arlington, TX | 1.0 | 1.0 | 692 | $1,060 | $1.53 | 43d | 1 | 1.01mi |
| 807 Bowie St Unit B Arlington, TX | 1.0 | 1.0 | 500 | $895 | $1.79 | 14d | 1 | 1.05mi |
| 901 Greenway Glen Dr Arlington, TX | 1.0 | 1.0 | 656 | $1,175 | $1.79 | 12d | 1 | 1.12mi |
| 901 Greenway Glen Dr Arlington, TX | 1.0–2.0 | 1.0–2.0 | 818 | $945 | $1.15 | 3d | 27 | 1.12mi |
| 901 Greenway Glen Dr Arlington, TX | 1.0 | 1.0 | 656 | $1,158 | $1.77 | 15d | 1 | 1.12mi |
| 505 N Bowen Rd Arlington, TX | 1.0–2.0 | 1.0 | 610 | $970 | $1.59 | 1d | 11 | 1.13mi |
| 1524 Chukka Dr Arlington, TX | 1.0 | 1.0 | 656 | $1,020 | $1.55 | 43d | 1 | 1.14mi |
| 905 W Abram St Unit 4 Arlington, TX | 1.0 | 1.0 | 641 | $1,445 | $2.25 | 7d | 1 | 1.20mi |
| 507 Cora St Arlington, TX | 1.0–2.0 | 1.0–1.5 | 875 | $1,150 | $1.31 | 13d | 5 | 1.24mi |
| 412 Summit Ave Arlington, TX | 1.0–2.0 | 1.0–1.5 | 962 | $949 | $0.99 | 1d | 10 | 1.26mi |
| 412 Summit Ave Arlington, TX | 1.0–2.0 | 1.0 | 830 | $1,100 | $1.33 | 43d | 4 | 1.26mi |
| 501 Fuller St Arlington, TX | 1.0–2.0 | 1.0–2.0 | 773 | $950 | $1.23 | 43d | 29 | 1.27mi |
| 613 S Fielder Rd Arlington, TX | 2.0 | 1.0 | 640 | $1,325 | $2.07 | 7d | 1 | 1.30mi |
| 505 W Lamar Blvd Unit 17001 Arlington, TX | 1.0 | 1.0 | 741 | $1,146 | $1.55 | 5d | 1 | 1.33mi |
| 509 Sandpiper Dr W Arlington, TX | 1.0 | 1.0 | 578 | $966 | $1.67 | 1d | 10 | 1.41mi |
| 212 S Cooper St Arlington, TX | 1.0 | 1.0 | 640 | $1,099 | $1.72 | 43d | 1 | 1.44mi |
| 212 S Cooper St Arlington, TX | 1.0 | 1.0 | 640 | $1,109 | $1.73 | 15d | 1 | 1.44mi |
| 507 N Oak St Arlington, TX | 1.0 | 1.0 | 512 | $1,045 | $2.04 | 24d | 2 | 1.46mi |
| 9001 Randol Mill Rd Fort Worth, TX | 1.0–2.0 | 1.0–2.0 | 786 | $895 | $1.14 | 2d | 15 | 1.47mi |
| 9001 Randol Mill Rd Fort Worth, TX | 1.0 | 1.0 | 552 | $907 | $1.64 | 16d | 1 | 1.47mi |
| 9001 Randol Mill Rd Unit 9052 Fort Worth, TX | 1.0 | 1.0 | 552 | $940 | $1.70 | 43d | 1 | 1.47mi |
| 1112 W 4th St Arlington, TX | 1.0 | 1.0 | 600 | $575 | $0.96 | 24d | 1 | 1.49mi |
HOA detail condo
- Monthly dues
- $138 · $1,656/yr
- Assessments
- None detected in remarks — confirm with the listing agent.
Listing history 27 events
-
2026-06-18days on market $95,000 Active 29 DOM
-
2026-06-17days on market $95,000 Active 28 DOM
-
2026-06-16days on market $95,000 Active 27 DOM
-
2026-06-15days on market $95,000 Active 26 DOM
-
2026-06-13days on market $95,000 Active 24 DOM
-
2026-06-09days on market $95,000 Active 20 DOM
-
2026-06-08days on market $95,000 Active 19 DOM
-
2026-06-07days on market $95,000 Active 18 DOM
-
2026-06-04days on market $95,000 Active 15 DOM
-
2026-06-03days on market $95,000 Active 14 DOM
-
2026-06-02days on market $95,000 Active 13 DOM
-
2026-06-01days on market $95,000 Active 12 DOM
-
2026-05-31days on market $95,000 Active 11 DOM
-
2026-05-18historical
-
2026-04-09price $95,000
-
2026-03-23$106,000 Active
-
2026-02-26historical $1,100
-
2025-12-31historical
-
2025-11-07$96,900 Active
-
2025-03-17$1,200
-
2024-02-09historical $1,050
-
2023-12-01$1,050
-
2002-11-21soldstatus
-
2002-10-24historical
-
2002-08-31$23,500
-
1991-03-28soldstatus
-
1986-07-03soldstatus
ⓘ Source: listings_history table (triggers on properties + properties_extension) + one-shot
backfill from property_details.listing_events for pre-trigger history.
Tax reassessment forecast TX · Resets to sale price
- Current annual tax
- $2,333 · $194/mo
- Projected year-2 tax
- $2,333 · $194/mo
- Expected delta
- $0/yr ($0/mo · 0.0%)
ⓘ Screening estimate from a state-policy table — verify with the county assessor before closing.
Climate risk First Street
- Flood 1/10 Low FEMA zone X (unshaded) · 0% chance over 30 yrs
- Wildfire 1/10 Low
- Heat 7/10 Severe 7 d/yr ≥109°F today · 23 d/yr by 30 yrs out
- Wind 6/10 Major 27% chance of damaging wind over 30 yrs
- Air quality 3/10 Moderate 2 unhealthy d/yr today · 4 by 30 yrs out
Nearby sold comps map
Loading sold comps map…
Walkable amenities ~0.75 mi
Loading nearby amenities…
Taxation est. · year 1
- Rental income
- $15,948
- − Mortgage interest
- −$5,321
- − Property taxes
- −$2,333
- − Insurance
- −$475
- − Repairs & maintenance
- −$1,276
- − Management
- −$1,276
- − HOA
- −$1,656
- − Depreciation
- −$2,764
- Taxable income
- $847
- Est. tax owed @ 24.0%
- −$203
- After-tax cash flow
- $1,953/yr
For passive investors: Depreciation is non-cash, so a rental often shows a tax loss while cash-flowing — sheltering income. Rental losses are passive: they offset passive income freely, and up to $25,000/yr can offset ordinary (W-2) income if you actively participate and your MAGI is under $100k (phasing out to $0 by $150k); unused losses carry forward. On sale, claimed depreciation is recaptured at up to 25%, and gains may owe capital-gains tax (a 1031 exchange can defer both). Figures are a year-1 estimate at your 24.0% rate — not tax advice; consult a CPA.
Schools (NCES district)
- District
- Arlington ISD
- NCES district ID
- 4808700
- Math proficiency
- 24% ▼ -21.00%
- Reading proficiency
- 34% ▼ -8.00%
- Median HH income
- $50,873
- Composite
- 25.42/100
- National rank
- #7458
- State rank
- #629 of 826 in TX
Livability — Arlington
- Score
- 78/100
- State rank
- #75
- US rank
- #2697
Category grades
Schools grade is shown separately in the Schools card above.
Census & demographics
- Census place
- Arlington, TX
- County
- Tarrant County · 2,033,669 people
- City population
- 366,588
- Metro
- Dallas-Fort Worth-Arlington, TX
- Population (ZIP)
- 27,991
- Household income
- $88,141
- Rent vs Own
- Severe rent burden
- 1121.0
Population outlook (Tarrant County) Hauer SSP2
- Today (2025)
- 2,380,417 people
- By 2030
- 2,578,900 · +8.3%
- By 2040
- 2,974,995 · +25.0%
- By 2050
- 3,350,489 · +40.8%
- By 2075
- 4,216,909 · +77.2%
- By 2100
- 4,741,527 · +99.2%
Race, ethnicity, and origin ACS 2023
- Neighborhood character
- Diverse neighborhood (Simpson 0.65)
- Race & ethnicity
- White 46% Hispanic / Latino 34% Two or more races 20% Black 15% Asian 2%
- Hispanic origin (detail)
- Mexican 25% Cuban 3%
- Common ancestry
- Slovak 2% Italian 2% Lithuanian 1%
- Foreign-born
- 20% · Canada, Jamaica
- Languages at home
- 68% English-only · Spanish 27% French/Haitian/Cajun 2% Arabic 1%
Political lean MEDSL · Tarrant
- 2024 margin
- Lean R (+5.1) · D 46.7% · R 51.9% · Other 1.4%
- 2008→2024 swing
- +6.6pp toward D · 2008: -11.7pp · 2024: -5.1pp
- All cycles
- 2024: R+5.1 2020: D+0.2 2016: R+8.7 2012: R+15.7 2008: R+11.7
Not yet ingested
- Civics
- —
Market trends
- HPI YoY
- ▼ -281.05%
- Current HPI
- 259.0255
- Rent YoY
- ▲ 3.98%
- Metro
- Dallas-Fort Worth-Arlington, TX
- State GDP YoY
- ▲ 3.95%
- F500 in state
- 110
Industry mix (Fortune 500 HQ in TX)
| Industry | F500 HQs | Revenue |
|---|---|---|
| Energy | 16 | $1,198B |
|
||
| Technology | 5 | $198B |
|
||
| Engineering / Construction | 4 | $72B |
|
||
| Energy Services | 3 | $60B |
|
||
| Utilities | 3 | $41B |
|
||
| Healthcare | 2 | $330B |
|
||
Price history
-95.1% since first listed16 events — show timeline
- 2026-05-21 Listed for Rent $1,150 NTREIS
- 2026-05-20 Listed $95,000 NTREIS
- 2026-05-18 Listing Removed — NTREIS
- 2026-04-09 Price Changed $95,000 NTREIS
- 2026-03-23 Listed $106,000 NTREIS
- 2026-02-26 Rental Removed $1,100 NTREIS
- 2025-12-31 Listing Removed — NTREIS
- 2025-11-07 Listed $96,900 NTREIS
- 2025-03-17 Listed for Rent $1,200 NTREIS
- 2024-02-09 Rental Removed $1,050 NTREIS
- 2023-12-01 Listed for Rent $1,050 NTREIS
- 2002-11-21 Sold (Public Records) — Public Records
- 2002-10-24 Listing Removed — NTREIS
- 2002-08-31 Listed $23,500 NTREIS
- 1991-03-28 Sold (Public Records) — Public Records
- 1986-07-03 Sold (Public Records) — Public Records
Property tax history
+11.1%/yrLatest (2025): $2,333 · +0.0% YoY. Source: county tax records.
Cash-flow waterfall
monthlySold comps — $/sqft
last 12 mo · ≤1 miLoading sold comps…