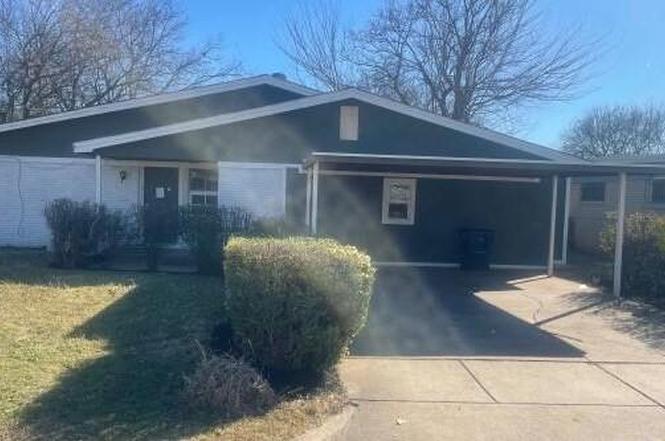
4604 Reed St · Fort Worth, TX
Flood risk 1/10 · Minimal
- FEMA flood zone
- X (unshaded)
- Chance of flooding over 30 yrs
- 0.0%
- Est. flood insurance / yr
- $507 – $1,088
Fire risk 1/10 · Minimal
- Est. fire insurance / yr
- $1,222 – $2,270
Heat risk 7/10 · Major
- Hot days now (above 110°F)
- 7 days/yr
- Hot days in 30 yrs
- 23 days/yr
Wind risk 4/10 · Minor
- Chance of severe wind over 30 yrs
- 24.0%
Air-quality risk 3/10 · Minor
- Unhealthy air days now
- 3 days/yr
- Unhealthy air days in 30 yrs
- 4 days/yr
Risk factors via First Street. Map © Google.
Why this score? — see what drove the C+ grade
The composite is a weighted blend of 9 inputs, each scored 0–100. Each bar is that input's sub-score; the figure is the points it added to the 100-point composite (weight × sub-score).
- Cash flow +24.1/30.0
- ARV discount +15.0/15.0
- DSCR +7.8/10.0
- 1% rule +6.3/10.0
- Livability +4.0/5.0
- Condition / age +2.5/5.0
- Rent growth +2.1/5.0
- Schools +2.0/10.0
- Appreciation +0.0/10.0
$154,900
🖨 Deal sheet 📄 Offer letter ✓ Due diligence
Listing remarks
Great opportunity for investors or buyers looking to renovate and add value. This 3 bedroom 2cbath home offers a functional layout and strong potential with updates and repairs. Conveniently located in an established Fort Worth neighborhood near major roadways, shopping, and local amenities. Property is being sold as-is, with no repairs to be made by seller. Ideal for renovation, resale, or long-term rental. Check it out!
Key facts
- Long-term rental
- Major roadways
- Renovation
Tags
Neighborhood map
What this means for you Summary
Snapshot
- This is a 3-bed/1.0-bath single-family listed at $155k.
Deal economics
- At list price, monthly cash flow is $306 ($4k/yr) — positive.
- The deal already cash-flows at list — no discount required.
- Meets the 1% rule at list price ($2k rent vs $155k).
- Recommended offer: $141k (9.0% below list) — sets the bar for market timing.
- Cap rate 8.7% vs local median 3.9% in Fort Worth — top-decile yield for the area; either an underpriced asset or a hidden risk that comps aren't pricing in. Stress-test before assuming the spread holds.
Location & tenants
- Location reads 80/100 on livability (#49 in TX, #1,954 nationally) — a professional / high-income tenant draw. Strengths: amenities A+, cost of living A+, housing A+; Watch: crime F.
- Fort Worth ISD (urban): math 18% / reading 28% proficiency, ranked #742 of 826 in TX (top 90%) — low school quality limits family demand, transient renter base, plan for 1-2y turnover; 73% free/reduced lunch — lower-income household profile, screen leases tightly.
- Zoned schools: A M Pate El (math 17% / reading 22%, grade F, #3,583 of 4,322 statewide, top 86%, 356 students, 99% FRL) — zoned schools average 99% FRL vs 73% district-wide (26 pts higher); higher-poverty schools than district average — tighter screening recommended.
- Market conditions: Rents soft (-1.6%/yr); 186 active listings in the ZIP; 18 comparable units currently listed for rent nearby; rentals at typical pace (median 24d on market — plan ~3-4 weeks tenant-placement turnaround); 44% of comp listings sitting > 30 days — soft ceiling on asking rent; 18,938 units permitted in Tarrant County in 2024 (8,336 in 5+ unit buildings).
- This rent runs 41% of the median local income ($51k/yr) — at the standard rent-burdened threshold; future hikes will face affordability resistance.
Forward outlook
- Local home prices are declining (-3.0%/yr); year-one equity from $1k of loan paydown is wiped out by about $5k of value loss. Plan a longer hold.
- Tarrant County population projected at +41% by 2050 — long-run rental-demand tailwind backs the buy-and-hold thesis.
Negotiation context
- It's been on market 103 days — a 9% lower offer ($141k) is reasonable based on typical stale-listing flexibility.
- 3 sale attempts; this cycle's ask has dropped $10k (6%) from the opening price — seller is motivated, your offer sets the floor, not the list.
Risks & watch-outs
- Watch-outs: built in 1958 — expect roof / HVAC / electrical / plumbing capex.
- Climate carrying-cost: extreme-heat days projected 7→23/yr by 2055 (HVAC capex compounding) — expect insurance premiums to compound above CPI over the hold.
Questions for the listing agent
- It's been on market 103 days. Have you received any prior offers? Is the seller open to a 9% concession, seller financing, or rate buy-down credit?
- Built in 1958 — when were the roof, HVAC, electrical panel, plumbing, and water heater last replaced?
- Why hasn't it sold? Are there any deal-killer items the seller is aware of (foundation, flood, title, zoning, code violations)?
- Is there a deadline driving the sale (1031 exchange, divorce, estate, relocation)? That informs how much negotiation room exists.
- Schools are D-rated, which usually means shorter tenancies and higher turnover. Who's the typical renter profile here, and what's been the actual vacancy rate?
- Crime grade is F in this area — have there been break-ins, vandalism, or insurance claims at this property in the last 3 years? What carrier currently insures it and at what premium?
- What's the average days-on-market for RENTAL listings here right now (not sales)? A rising rental-DOM trend means longer vacancies and softer asking-rent achievability than the comps imply.
- What's the recent tenant-quality profile in this submarket — average credit score on applications, eviction rate, late-payment / NSF rate, and stable-employment percentage? A property-management company in the area should have these aggregated.
- How much new for-sale + rental construction is in the pipeline within 1–3 miles? Heavy new supply typically softens prices + rents 12–24 months out; constrained supply supports both.
Investment metrics
- 1% rule
- 1.13% ✓
- Cap rate
- 8.66%
- Cash-on-cash
- 8.47%
- DSCR
- 1.38
- GRM
- 7.4
CMA / ARV
- ARV (on-the-fly)
- $270,550
- Comps found
- 12
Show comp detail 12 sales within ~0.75 mi
| Address | Dist | Beds/Ba | Sqft | Sold | Price | $/sf | Match |
|---|---|---|---|---|---|---|---|
| 4613 Emerson St | 0.09mi | 3/2.0 | 1,700 (+10%) | 0mo | $160,000 | $94 | 75 |
| 3913 Pate Dr | 0.36mi | 4/2.0 (+1) | 1,614 (+4%) | 3mo | $245,000 | $152 | 64 |
| 4117 Wiman Dr | 0.50mi | 3/2.5 | 1,513 (-2%) | 3mo | $115,000 | $76 | 64 |
| 4509 Quails Ln | 0.28mi | 4/2.0 (+1) | 1,419 (-8%) | 3mo | $228,999 | $161 | 62 |
| 4824 Sunshine Dr | 0.73mi | 3/2.0 | 1,564 (+1%) | 0mo | $289,000 | $185 | 60 |
| 3918 Miller Ave | 0.54mi | 4/2.0 (+1) | 1,500 (-3%) | 2mo | $235,000 | $157 | 59 |
| 3401 S Hughes Ave | 0.19mi | 4/2.0 (+1) | 1,766 (+14%) | 3mo | $359,000 | $203 | 56 |
| 3879 Freddie St | 0.59mi | 3/1.5 | 1,390 (-10%) | 0mo | $155,000 | $112 | 54 |
| 5000 Reed St | 0.43mi | 4/2.0 (+1) | 1,382 (-11%) | 2mo | $242,000 | $175 | 52 |
| 5030 Pinson St | 0.63mi | 3/2.0 | 1,397 (-10%) | 4mo | $299,000 | $214 | 48 |
| 5013 Cottey St | 0.65mi | 3/2.0 | 1,397 (-10%) | 4mo | $262,500 | $188 | 47 |
| 5017 Cottey St | 0.67mi | 3/2.0 | 1,397 (-10%) | 4mo | $268,500 | $192 | 46 |
Match score weights: distance 35% · size 25% · config 20% · recency 20%. Top-matched comps best support the ARV.
Projected returns pro-forma
-3.0% appreciation · 0.0% rent growth · sell at horizon
- IRR
- -6.9%
- Equity multiple
- 0.75×
- Total profit
- $-10,711
- Equity at exit
- $23,096
- IRR
- -1.5%
- Equity multiple
- 0.91×
- Total profit
- $-3,940
- Equity at exit
- $13,393
Cash invested: $43,372 (down + closing). Projections, not guarantees.
Landlord ↔ Tenant lean methodology
- Overall (STATE)
- 87 Strongly Landlord-Friendly
- State Texas
- 87 Strongly Landlord-Friendly · R+5
- County
- — inherits STATE
- City
- — inherits STATE
ZIP-level market 76119
- Home prices YoY
- -6.4%
- Rents YoY
- -1.6%
- Active inventory
- 186
- Price-to-rent
- 7.4×
Monthly cashflow live
- Estimated rent
- $1,751 high interval (Pro) →
- Mortgage (P&I)
- −$812
- Tax from tax record
- −$201 /mo · $2,408/yr
- Insurance
- −$65
- HOA
- −$0
- Vacancy / Maint / Mgmt
- −$368
- Net cashflow
- $306
Break-even live
UW: 25.0% down · 7.5% · 30yr · 1.5% tax · 5.0% vac · 8.0% maint · 8.0% mgmt
Financing live
Cash to close
- Down payment
- $38,725
- Closing costs
- $4,647
- Reserves months
- —
- Total cash needed
- —
Loan-product check · same deal, 3 products live
Conventional
25% down · 7.5% · 30yr
- Down + closing
- —
- Monthly P&I
- —
- Monthly cashflow
- —
- DSCR
- —
- Eligible?
- —
Personal DTI + credit; lowest rate.
DSCR
20% down · 8.5% · 30yr
- Down + closing
- —
- Monthly P&I
- —
- Monthly cashflow
- —
- DSCR
- —
- Eligible?
- —
No personal income docs; deal must DSCR.
Hard money
10% down · 12.0% · 12mo
- Down + closing
- —
- Monthly P&I
- —
- Monthly cashflow
- —
- DSCR
- —
- Eligible?
- —
Short-term bridge; refi at stabilization.
Rent comps 18 comps
| Address | Beds | Baths | Sqft | Rent | $/sqft | DOM | Units | Dist |
|---|---|---|---|---|---|---|---|---|
| 4336 Jana Dr Fort Worth, TX | 3.0 | 1.0 | 1070 | $1,650 | $1.54 | 3d | 1 | 0.41mi |
| 4217 Wilhelm St Fort Worth, TX | 3.0 | 2.0 | 1380 | $1,650 | $1.20 | 43d | 1 | 0.50mi |
| 5055 Virgil St Fort Worth, TX | 3.0 | 2.0 | 1089 | $1,650 | $1.52 | 24d | 1 | 0.52mi |
| 4312 Lorin Ave Fort Worth, TX | 4.0 | 2.0 | 1230 | $2,000 | $1.63 | 43d | 1 | 0.79mi |
| 2500 S Edgewood Ter Fort Worth, TX | 1.0–3.0 | 1.0–2.5 | 1123 | $1,895 | $1.69 | 1d | 34 | 0.80mi |
| 2302 Coleman Ave Fort Worth, TX | 3.0 | 2.0 | 1960 | $1,550 | $0.79 | 43d | 1 | 0.93mi |
| 2701 Vogt St Fort Worth, TX | 3.0 | 2.0 | 1090 | $1,475 | $1.35 | 13d | 1 | 1.01mi |
| 3865 Stalcup Rd Fort Worth, TX | 3.0 | 2.0 | 1090 | $1,814 | $1.66 | 6d | 1 | 1.09mi |
| 5328 Carol Ave Fort Worth, TX | 4.0 | 2.0 | 1230 | $2,100 | $1.71 | 43d | 1 | 1.10mi |
| 3816 Avenue N Fort Worth, TX | 3.0 | 1.0 | 1108 | $1,550 | $1.40 | 5d | 1 | 1.22mi |
| 3700 Radford Rd Fort Worth, TX | 3.0 | 2.0 | 1124 | $1,650 | $1.47 | 24d | 1 | 1.28mi |
| 3700 Radford Rd Fort Worth, TX | 3.0 | 2.0 | 1124 | $1,650 | $1.47 | 12d | 1 | 1.28mi |
| 4929 Willie St Fort Worth, TX | 3.0 | 2.0 | 1386 | $1,650 | $1.19 | 3d | 1 | 1.29mi |
| 4514 Erath St Fort Worth, TX | 4.0 | 2.0 | 1536 | $1,850 | $1.20 | 43d | 1 | 1.33mi |
| 3731 Avenue M Unit M Fort Worth, TX | 3.0 | 2.0 | 1425 | $1,900 | $1.33 | 21d | 1 | 1.33mi |
| 3211 Montague St Fort Worth, TX | 3.0 | 2.0 | 1460 | $1,999 | $1.37 | 43d | 1 | 1.39mi |
| 5712 Whittlesey Rd Fort Worth, TX | 4.0 | 2.0 | 1610 | $2,000 | $1.24 | 44d | 1 | 1.42mi |
| 4801 Shackleford St Fort Worth, TX | 4.0 | 2.5 | 2009 | $2,375 | $1.18 | 43d | 1 | 1.48mi |
Listing history 15 events
-
2026-06-18days on market $154,900 Active 103 DOM
-
2026-06-17days on market $154,900 Active 102 DOM
-
2026-06-16days on market $154,900 Active 101 DOM
-
2026-06-15days on market $154,900 Active 100 DOM
-
2026-06-13statusdays on market $154,900 Active 98 DOM
-
2026-04-28status Pending
-
2026-03-30price $154,900
-
2026-02-26price $159,900
-
2026-01-22$164,900 Active
-
2026-01-19historical
-
2026-01-08$175,000 Active
-
2025-12-30historical
-
2025-09-10$175,000 Active
-
2020-04-13soldstatus
-
1967-11-02soldstatus
ⓘ Source: listings_history table (triggers on properties + properties_extension) + one-shot
backfill from property_details.listing_events for pre-trigger history.
Tax reassessment forecast TX · Resets to sale price
- Current annual tax
- $2,408 · $201/mo
- Projected year-2 tax
- $2,835 · $236/mo
- Expected delta
- +$427/yr (+$36/mo · 17.7%)
ⓘ Screening estimate from a state-policy table — verify with the county assessor before closing.
Climate risk First Street
- Flood 1/10 Low FEMA zone X (unshaded) · 0% chance over 30 yrs
- Wildfire 1/10 Low
- Heat 7/10 Severe 7 d/yr ≥110°F today · 23 d/yr by 30 yrs out
- Wind 4/10 Moderate 24% chance of damaging wind over 30 yrs
- Air quality 3/10 Moderate 3 unhealthy d/yr today · 4 by 30 yrs out
Nearby sold comps map
Loading sold comps map…
Walkable amenities ~0.75 mi
Loading nearby amenities…
Taxation est. · year 1
- Rental income
- $21,016
- − Mortgage interest
- −$8,677
- − Property taxes
- −$2,408
- − Insurance
- −$774
- − Repairs & maintenance
- −$1,681
- − Management
- −$1,681
- − Depreciation
- −$4,506
- Taxable income
- $1,288
- Est. tax owed @ 24.0%
- −$309
- After-tax cash flow
- $3,363/yr
For passive investors: Depreciation is non-cash, so a rental often shows a tax loss while cash-flowing — sheltering income. Rental losses are passive: they offset passive income freely, and up to $25,000/yr can offset ordinary (W-2) income if you actively participate and your MAGI is under $100k (phasing out to $0 by $150k); unused losses carry forward. On sale, claimed depreciation is recaptured at up to 25%, and gains may owe capital-gains tax (a 1031 exchange can defer both). Figures are a year-1 estimate at your 24.0% rate — not tax advice; consult a CPA.
Schools (NCES district)
- District
- Fort Worth ISD
- NCES district ID
- 4819700
- Math proficiency
- 18% ▼ -16.00%
- Reading proficiency
- 28% ▼ -6.00%
- Median HH income
- $42,109
- Composite
- 19.61/100
- National rank
- #8753
- State rank
- #742 of 826 in TX
Livability — Fort Worth
- Score
- 80/100
- State rank
- #49
- US rank
- #1954
Category grades
Schools grade is shown separately in the Schools card above.
Census & demographics
- Census place
- Fort Worth, TX
- County
- Tarrant County · 2,033,669 people
- City population
- 911,619
- Metro
- Dallas-Fort Worth-Arlington, TX
- Population (ZIP)
- 52,974
- Household income
- $51,267
- Rent vs Own
- Severe rent burden
- 2221.0
Population outlook (Tarrant County) Hauer SSP2
- Today (2025)
- 2,380,417 people
- By 2030
- 2,578,900 · +8.3%
- By 2040
- 2,974,995 · +25.0%
- By 2050
- 3,350,489 · +40.8%
- By 2075
- 4,216,909 · +77.2%
- By 2100
- 4,741,527 · +99.2%
Race, ethnicity, and origin ACS 2023
- Neighborhood character
- Diverse neighborhood (Simpson 0.60)
- Race & ethnicity
- Hispanic / Latino 51% Black 36% Two or more races 26% White 8% Asian 3%
- Hispanic origin (detail)
- Mexican 44%
- Foreign-born
- 25% · Canada, Philippines
- Languages at home
- 54% English-only · Spanish 42% Other Indo-European 2% Other Asian/Pacific 1%
Political lean MEDSL · Tarrant
- 2024 margin
- Lean R (+5.1) · D 46.7% · R 51.9% · Other 1.4%
- 2008→2024 swing
- +6.6pp toward D · 2008: -11.7pp · 2024: -5.1pp
- All cycles
- 2024: R+5.1 2020: D+0.2 2016: R+8.7 2012: R+15.7 2008: R+11.7
Not yet ingested
- Civics
- —
Market trends
- HPI YoY
- ▼ -23.04%
- Current HPI
- 336.7941
- Rent YoY
- ▼ -1.61%
- Metro
- Dallas-Fort Worth-Arlington, TX
- State GDP YoY
- ▲ 3.95%
- F500 in state
- 110
Industry mix (Fortune 500 HQ in TX)
| Industry | F500 HQs | Revenue |
|---|---|---|
| Energy | 16 | $1,198B |
|
||
| Technology | 5 | $198B |
|
||
| Engineering / Construction | 4 | $72B |
|
||
| Energy Services | 3 | $60B |
|
||
| Utilities | 3 | $41B |
|
||
| Healthcare | 2 | $330B |
|
||
Price history
-11.5% since first listed10 events — show timeline
- 2026-04-28 Pending — NTREIS
- 2026-03-30 Price Changed $154,900 NTREIS
- 2026-02-26 Price Changed $159,900 NTREIS
- 2026-01-22 Listed $164,900 NTREIS
- 2026-01-19 Listing Removed — NTREIS
- 2026-01-08 Listed $175,000 NTREIS
- 2025-12-30 Listing Removed — NTREIS
- 2025-09-10 Listed $175,000 NTREIS
- 2020-04-13 Sold (Public Records) — Public Records
- 1967-11-02 Sold (Public Records) — Public Records
Property tax history
+5.9%/yrLatest (2025): $2,408 · -15.9% YoY. Source: county tax records.
Cash-flow waterfall
monthlySold comps — $/sqft
last 12 mo · ≤1 miLoading sold comps…