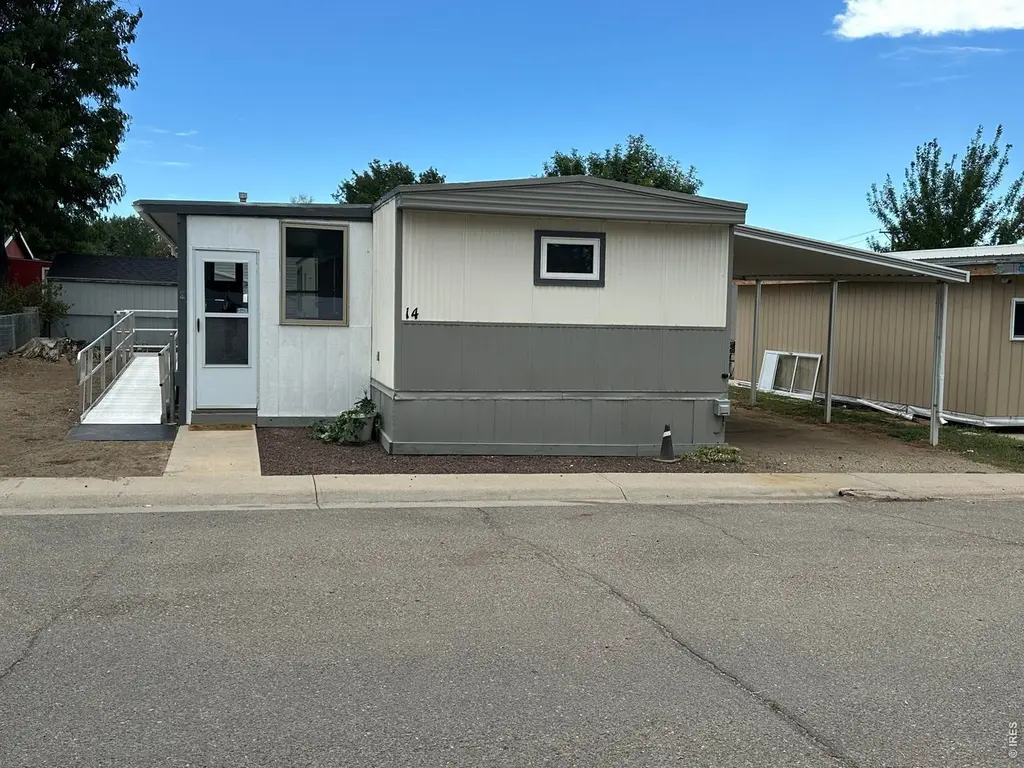
1400 S Collyer St #14 · Longmont, CO
Flood risk 1/10 · Minimal
- FEMA flood zone
- X (unshaded)
- Chance of flooding over 30 yrs
- 0.0%
- Est. flood insurance / yr
- $507 – $1,088
Fire risk 1/10 · Minimal
- Est. fire insurance / yr
- $939 – $1,743
Heat risk 3/10 · Minor
- Hot days now (above 93°F)
- 7 days/yr
- Hot days in 30 yrs
- 19 days/yr
Wind risk 1/10 · Minimal
- Chance of severe wind over 30 yrs
- —
Air-quality risk 6/10 · Moderate
- Unhealthy air days now
- 10 days/yr
- Unhealthy air days in 30 yrs
- 10 days/yr
Risk factors via First Street. Map © Google.
Why this score? — see what drove the B+ grade
The composite is a weighted blend of 9 inputs, each scored 0–100. Each bar is that input's sub-score; the figure is the points it added to the 100-point composite (weight × sub-score).
- Cash flow +30.0/30.0
- ARV discount +14.4/15.0
- 1% rule +10.0/10.0
- DSCR +10.0/10.0
- Livability +3.9/5.0
- Schools +3.8/10.0
- Rent growth +2.7/5.0
- Condition / age +2.5/5.0
- Appreciation +0.0/10.0
$50,000
🖨 Deal sheet (PDF) 📄 Offer letter ✓ Due diligence
Listing remarks
Affordable, ADA friendly living in established community in South Longmont! Wide metal ramp leading to the front door makes this a home for all ages. You'll love the enclosed, heated front porch - making extra room for office or gathering area. The kitchen is full of newer appliances, and the peek-through wall keeps the cook of the house connected with those enjoying the spacious living area. Did you see the lighted bump-out sitting area? It's the perfect place for your plants to enjoy natural light!Spacious primary bedroom has an extended closet, so bring EVERYTHING with you! The shared bathroom offers safety features of grab bars and a step-in shower. Outside you will find a private front
Key facts
- Ada friendly living
- Newer appliances
- Private front porch
Tags
Property features AI
Finance
- Other: Minimal flood or C rating in flood plain
- HOA & community: No association fees or transfer fees reported
Exterior
- Parking: Carport
- Utilities: City water with meter installed; Natural gas available (Excel); Electricity available; City trash service (City of Longmont)
- Home design: Manufactured in park (mobile home); Flat roof
- Construction: Under carriage: UBC construction
- Exterior features: Patio; Deck; Partial fencing; Storage structure; Ramp access and no stairs (accessible entry)
Interior
- Kitchen: Electric range; Dishwasher; Refrigerator; Disposal
- Bedrooms: 2 bedrooms
- Bathrooms: 1 full bathroom
- Heating & cooling: Forced air heating; Central air conditioning
- Interior features: Separate dining room; Window coverings; Disposal
- Laundry & utility: Washer; Dryer
Neighborhood map
What this means for you Summary
Snapshot
- This is a 2-bed/1.0-bath manufactured listed at $50k.
Deal economics
- At list price, monthly cash flow is $1k ($12k/yr) — positive.
- The deal already cash-flows at list — no discount required.
- Meets the 1% rule at list price ($2k rent vs $50k).
- Recommended offer: $49k (1.5% below list) — sets the bar for market timing.
- Cap rate 30.3% vs local median 2.6% in Longmont — top-decile yield for the area; either an underpriced asset or a hidden risk that comps aren't pricing in. Stress-test before assuming the spread holds.
Location & tenants
- Location reads 77/100 on livability (#24 in CO, #2,736 nationally) — a middle-class / working-renter tenant base. Strengths: amenities A+, employment A+, housing A+; Watch: crime F, cost of living F.
- St. Vrain Valley School District No. Re1J (suburban): math 32% / reading 51% proficiency, ranked #23 of 86 in CO (top 27%) — families likely to look elsewhere, expect single-tenant / working-renter base with shorter leases.
- Zoned schools: Indian Peaks Elementary School (math 15% / reading 32%, grade F, #634 of 966 statewide, top 67%, 251 students, 82% FRL); Sunset Middle School (math 16% / reading 32%, grade F, #178 of 270 statewide, top 67%, 377 students, 57% FRL); Niwot High School (math 51% / reading 71%, grade C+, #51 of 381 statewide, top 13%, 1,355 students, 26% FRL) — zoned schools average 55% FRL vs 27% district-wide (28 pts higher); higher-poverty schools than district average — tighter screening recommended.
- Market conditions: Rents flat; 179 active listings in the ZIP; 8 comparable units currently listed for rent nearby; rentals at typical pace (median 23d on market — plan ~3-4 weeks tenant-placement turnaround); solid renter incomes; 1,688 units permitted in Boulder County in 2024 (1,136 in 5+ unit buildings).
Forward outlook
- Local home prices are declining (-3.0%/yr); year-one equity from $346 of loan paydown is wiped out by about $2k of value loss. Plan a longer hold.
- Boulder County population projected at +40% by 2050 — long-run rental-demand tailwind backs the buy-and-hold thesis.
- At projected returns (-3.0% appreciation + 0.6% rent growth), your $14k cash investment doubles in ~2 years — after that, you're playing with house money.
Negotiation context
- It's been on market 17 days — a 2% lower offer ($49k) is reasonable based on typical stale-listing flexibility.
- 2 sale attempts with the ask held roughly flat each time — persistent listings suggest the price (not the market) is what's stuck; bring a comps-based counter.
Questions for the listing agent
- Built in 1973 — when were the roof, HVAC, electrical panel, plumbing, and water heater last replaced?
- Is there a deadline driving the sale (1031 exchange, divorce, estate, relocation)? That informs how much negotiation room exists.
- Crime grade is F in this area — have there been break-ins, vandalism, or insurance claims at this property in the last 3 years? What carrier currently insures it and at what premium?
- What's the average days-on-market for RENTAL listings here right now (not sales)? A rising rental-DOM trend means longer vacancies and softer asking-rent achievability than the comps imply.
- What's the recent tenant-quality profile in this submarket — average credit score on applications, eviction rate, late-payment / NSF rate, and stable-employment percentage? A property-management company in the area should have these aggregated.
- How much new for-sale + rental construction is in the pipeline within 1–3 miles? Heavy new supply typically softens prices + rents 12–24 months out; constrained supply supports both.
Investment metrics
- 1% rule
- 3.41% ✓
- Cap rate
- 30.33%
- Cash-on-cash
- 85.86%
- DSCR
- 4.82
- GRM
- 2.4
CMA / ARV
- ARV (on-the-fly)
- $59,048
- Comps found
- 3
Show comp detail 3 sales within ~0.75 mi
| Address | Dist | Beds/Ba | Sqft | Sold | Price | $/sf | Match |
|---|---|---|---|---|---|---|---|
| 1400 S Collyer St #172 | 0.00mi | 2/1.0 | 924 (-4%) | 2mo | $56,000 | $61 | 91 |
| 1400 S Collyer St #205 | 0.00mi | 3/1.5 (+1) | 980 (+1%) | 4mo | $47,000 | $48 | 88 |
| 1400 S Collyer St #204 | 0.00mi | 2/2.0 | 924 (-4%) | 9mo | $105,000 | $114 | 81 |
Match score weights: distance 35% · size 25% · config 20% · recency 20%. Top-matched comps best support the ARV.
Projected returns pro-forma
-3.0% appreciation · 0.64% rent growth · sell at horizon
- IRR
- 83.7%
- Equity multiple
- 4.70×
- Total profit
- $51,769
- Equity at exit
- $7,455
- IRR
- 86.4%
- Equity multiple
- 8.99×
- Total profit
- $111,854
- Equity at exit
- $4,323
Cash invested: $14,000 (down + closing). Projections, not guarantees.
Landlord ↔ Tenant lean methodology
- Overall (STATE)
- 38 Tenant-Leaning
- State Colorado
- 38 Tenant-Leaning · D+4
- County
- — inherits STATE
- City
- — inherits STATE
ZIP-level market 80501
- Rents YoY
- 0.6%
- Active inventory
- 179
- Price-to-rent
- 2.4×
Monthly cashflow live
- Estimated rent
- $1,705 high interval (Pro) →
- Mortgage (P&I)
- −$262
- Tax est. 1.5%
- −$62 /mo · $750/yr
- Insurance
- −$21
- HOA
- −$0
- Vacancy / Maint / Mgmt
- −$358
- Net cashflow
- $1,002
Break-even live
Sensitivity live
| Price | -10% $1,036 | -5% $1,019 | +0% $1,002 | +5% $984 | +10% $967 |
|---|---|---|---|---|---|
| Rent | -10% $867 | -5% $934 | +0% $1,002 | +5% $1,069 | +10% $1,136 |
| Rate | -1.0pp $1,027 | -0.5pp $1,014 | base $1,002 | +0.5pp $989 | +1.0pp $976 |
UW: 25.0% down · 7.5% · 30yr · 1.5% tax · 5.0% vac · 8.0% maint · 8.0% mgmt
Financing live
Cash to close
- Down payment
- $12,500
- Closing costs
- $1,500
- Reserves months
- —
- Total cash needed
- —
Loan-product check · same deal, 3 products live
Conventional
25% down · 7.5% · 30yr
- Down + closing
- —
- Monthly P&I
- —
- Monthly cashflow
- —
- DSCR
- —
- Eligible?
- —
Personal DTI + credit; lowest rate.
DSCR
20% down · 8.5% · 30yr
- Down + closing
- —
- Monthly P&I
- —
- Monthly cashflow
- —
- DSCR
- —
- Eligible?
- —
No personal income docs; deal must DSCR.
Hard money
10% down · 12.0% · 12mo
- Down + closing
- —
- Monthly P&I
- —
- Monthly cashflow
- —
- DSCR
- —
- Eligible?
- —
Short-term bridge; refi at stabilization.
Rent comps 8 comps
| Address | Beds | Baths | Sqft | Rent | $/sqft | DOM | Units | Dist |
|---|---|---|---|---|---|---|---|---|
| 1328 S Coffman St Unit 1 Longmont, CO | 3.0 | 1.0 | 966 | $1,745 | $1.81 | 22d | 1 | 0.41mi |
| 1328 S Coffman St Longmont, CO | 3.0 | 1.0 | 966 | $1,795 | $1.86 | 15d | 2 | 0.41mi |
| 1344 S Coffman St Longmont, CO | 2.0 | 1.0 | 750 | $1,295 | $1.73 | 15d | 1 | 0.43mi |
| 1353 S Coffman St Longmont, CO | 2.0 | 1.0 | 804 | $1,925 | $2.39 | 15d | 1 | 0.46mi |
| 1403 Lefthand Dr Longmont, CO | 2.0 | 1.0 | 810 | $1,645 | $2.03 | 15d | 1 | 0.98mi |
| 732 Delaware Ave Unit A Longmont, CO | 2.0 | 1.0 | 875 | $1,600 | $1.83 | 22d | 1 | 1.16mi |
| 808 Delaware Ave Unit D Longmont, CO | 2.0 | 1.0 | 700 | $1,300 | $1.86 | 22d | 1 | 1.17mi |
| 720 Fairlane Ave Longmont, CO | 2.0 | 1.0 | 828 | $1,775 | $2.14 | 22d | 3 | 1.17mi |
Listing history 12 events
-
2026-06-22days on market $50,000 Active 17 DOM
-
2026-06-18days on market $50,000 Active 14 DOM
-
2026-06-17days on market $50,000 Active 13 DOM
-
2026-06-16days on market $50,000 Active 12 DOM
-
2026-06-15status $50,000 Active 11 DOM
-
2026-06-13statusdays on market $50,000 Pending 11 DOM
-
2026-06-09days on market $50,000 Active 9 DOM
-
2026-06-09days on market $50,000 Active 8 DOM
-
2026-06-07days on market $50,000 Active 7 DOM
-
2026-06-02days on market $50,000 Active 2 DOM
-
2026-05-31remarks 699-char remark
-
2026-05-31$50,000 Active 1 DOM
ⓘ Source: listings_history table (triggers on properties + properties_extension) + one-shot
backfill from property_details.listing_events for pre-trigger history.
Climate risk First Street
- Flood 1/10 Low FEMA zone X (unshaded) · 0% chance over 30 yrs
- Wildfire 1/10 Low
- Heat 3/10 Moderate 7 d/yr ≥93°F today · 19 d/yr by 30 yrs out
- Wind 1/10 Low
- Air quality 6/10 Major 10 unhealthy d/yr today · 10 by 30 yrs out
Nearby sold comps map
Loading sold comps map…
Walkable amenities ~0.75 mi
Loading nearby amenities…
Taxation est. · year 1
- Rental income
- $20,465
- − Mortgage interest
- −$2,801
- − Property taxes
- −$750
- − Insurance
- −$250
- − Repairs & maintenance
- −$1,637
- − Management
- −$1,637
- − Depreciation
- −$1,455
- Taxable income
- $11,935
- Est. tax owed @ 24.0%
- −$2,864
- After-tax cash flow
- $9,157/yr
For passive investors: Depreciation is non-cash, so a rental often shows a tax loss while cash-flowing — sheltering income. Rental losses are passive: they offset passive income freely, and up to $25,000/yr can offset ordinary (W-2) income if you actively participate and your MAGI is under $100k (phasing out to $0 by $150k); unused losses carry forward. On sale, claimed depreciation is recaptured at up to 25%, and gains may owe capital-gains tax (a 1031 exchange can defer both). Figures are a year-1 estimate at your 24.0% rate — not tax advice; consult a CPA.
Schools (NCES district)
- District
- St. Vrain Valley School District No. Re1J
- NCES district ID
- 0805370
- Math proficiency
- 32% ▼ -8.00%
- Reading proficiency
- 51% ▬ 0.00%
- Median HH income
- $71,571
- Composite
- 37.73/100
- National rank
- #4353
- State rank
- #23 of 86 in CO
Livability — Longmont
- Score
- 77/100
- State rank
- #24
- US rank
- #2736
Category grades
Schools grade is shown separately in the Schools card above.
Census & demographics
- Census place
- Longmont, CO
- County
- Boulder County · 271,666 people
- City population
- 143,444
- Metro
- Boulder, CO
- Population (ZIP)
- 44,147
- Household income
- $80,911
- Rent vs Own
- Severe rent burden
- 1958.0
Population outlook (Boulder County) Hauer SSP2
- Today (2025)
- 380,833 people
- By 2030
- 412,028 · +8.2%
- By 2040
- 472,764 · +24.1%
- By 2050
- 532,029 · +39.7%
- By 2075
- 679,723 · +78.5%
- By 2100
- 766,278 · +101.2%
Race, ethnicity, and origin ACS 2023
- Neighborhood character
- Majority White (62%)
- Race & ethnicity
- White 62% Hispanic / Latino 31% Two or more races 16% Asian 1% Black 1%
- Hispanic origin (detail)
- Mexican 25%
- Common ancestry
- Romanian 3% Lithuanian 2% Slovak 2%
- Foreign-born
- 12% · Canada, Jamaica
- Languages at home
- 77% English-only · Spanish 19% Other Indo-European 1% Russian/Polish/Slavic 1%
Political lean MEDSL · Boulder
- 2024 margin
- Solid D (+55.8) · D 76.5% · R 20.8% · Other 2.7%
- 2008→2024 swing
- +9.6pp toward D · 2008: 46.1pp · 2024: 55.8pp
- All cycles
- 2024: D+55.8 2020: D+56.6 2016: D+48.6 2012: D+41.5 2008: D+46.1
Not yet ingested
- Civics
- —
Market trends
- HPI YoY
- ▼ -567.24%
- Current HPI
- 268.454
- Rent YoY
- ▲ 0.64%
- Metro
- Boulder, CO
- State GDP YoY
- ▲ 1.95%
- F500 in state
- 14
Industry mix (Fortune 500 HQ in CO)
| Industry | F500 HQs | Revenue |
|---|---|---|
| Technology Distribution | 1 | $31B |
|
||
| Food / Agriculture | 1 | $18B |
|
||
| Packaging | 1 | $14B |
|
||
| Healthcare | 1 | $13B |
|
||
| Energy | 1 | $10B |
|
||
| Technology | 1 | $4B |
|
||
Price history
-28.6% since first listed5 events — show timeline
- 2026-05-31 Listed $50,000 IRES
- 2026-03-31 Listing Removed — IRES
- 2025-11-18 Price Changed $54,000 IRES
- 2025-10-28 Price Changed $64,000 IRES
- 2025-09-11 Listed $70,000 IRES
Property tax history
-1.2%/yrLatest (2021): $51 · +7.6% YoY. Source: county tax records.
Cash-flow waterfall
monthlySold comps — $/sqft
last 12 mo · ≤1 miLoading sold comps…