 Duplex
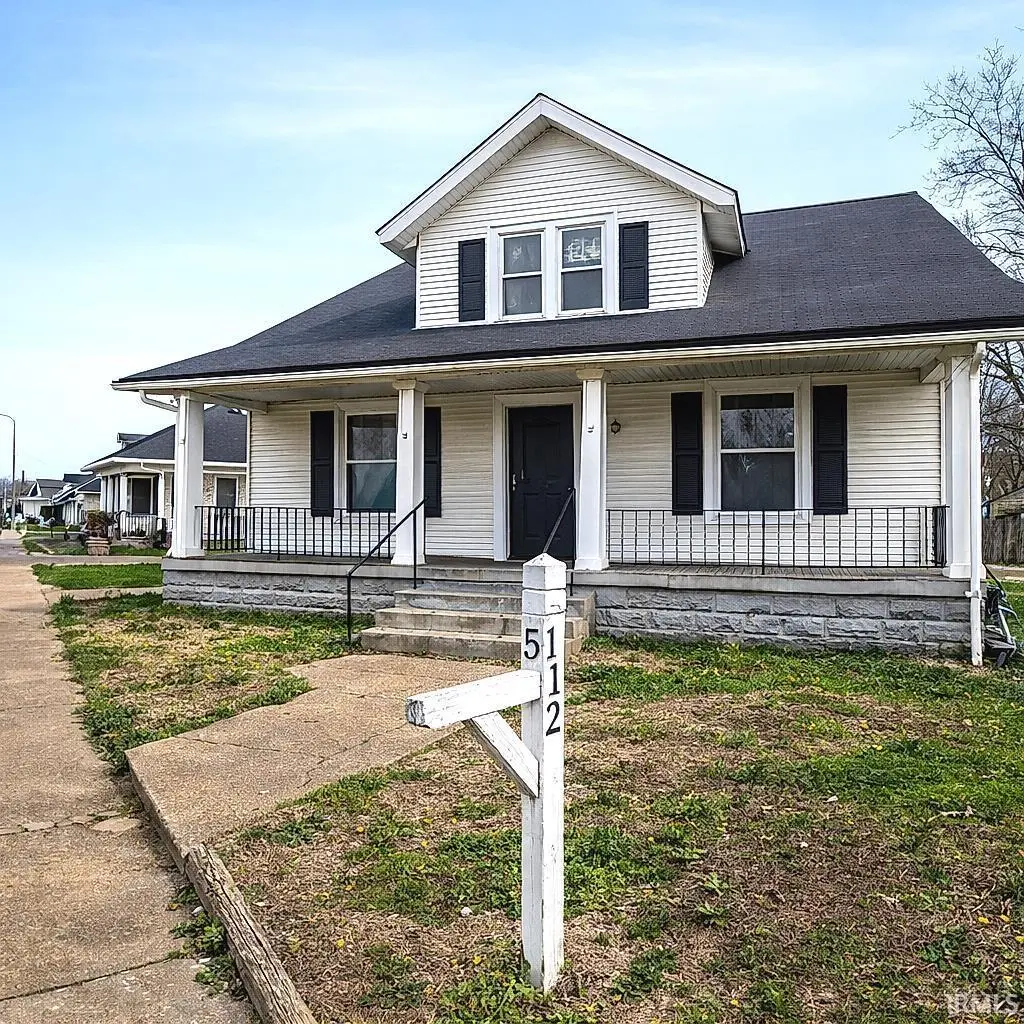
512 E Riverside Dr · Evansville, IN
Flood risk 1/10 · Minimal
- FEMA flood zone
- X
- Chance of flooding over 30 yrs
- 0.0%
- Est. flood insurance / yr
- $473 – $860
Fire risk 1/10 · Minimal
- Est. fire insurance / yr
- $717 – $1,331
Heat risk 5/10 · Moderate
- Hot days now (above 107°F)
- 7 days/yr
- Hot days in 30 yrs
- 19 days/yr
Wind risk 2/10 · Minimal
- Chance of severe wind over 30 yrs
- 3.0%
Air-quality risk 4/10 · Minor
- Unhealthy air days now
- 3 days/yr
- Unhealthy air days in 30 yrs
- 5 days/yr
Risk factors via First Street. Map © Google.
Why this score? — see what drove the B- grade
The composite is a weighted blend of 9 inputs, each scored 0–100. Each bar is that input's sub-score; the figure is the points it added to the 100-point composite (weight × sub-score).
- Cash flow +28.8/30.0
- DSCR +10.0/10.0
- 1% rule +7.6/10.0
- ARV discount +7.5/15.0
- Rent growth +5.0/5.0
- Schools +3.3/10.0
- Livability +3.2/5.0
- Condition / age +2.5/5.0
- Appreciation +0.0/10.0
$199,000
🖨 Deal sheet (PDF) 📄 Offer letter ✓ Due diligence
Multi-family units
County records classify this as Multi-Family (2-4 Unit). Listing-text estimate: 2 units. confirmed
Listing remarks
Outstanding investment opportunity featuring a 5-unit portfolio across three properties on E. Riverside Dr. The front property, 512 E. Riverside Dr. , offers mixed-use potential with a main-level commercial space previously utilized as an insurance office, recently rented for $800/month. The upper level includes a 2-bedroom residential unit that was previously leased for $500/month. This property also includes a detached garage, adding additional value and utility. Situated just down the driveway, 514–516 E. Riverside Dr. consists of a duplex with two 1-bedroom units, providing steady rental potential. This parcel also features a detached garage. Rounding out the portfolio is 663 E. R
Key facts
- Mixed-use potential
- Detached garage
- 0.24 acre lot
Tags
Property features AI
Exterior
- Parking: 2 open parking spaces
- Utilities: Public water; Public sewer
- Home design: Duplex (residential income); 2 stories total; Zoned R-2 (Two-Family Residence)
- Construction: Vinyl siding
- Exterior features: Level lot; Pets allowed
Interior
- Flooring: Carpet
- Bathrooms: 2 full bathrooms; 4 main-level bathrooms
- Heating & cooling: Forced air heating; Central air conditioning; Window unit(s)
- Interior features: Carpet flooring; Partial basement
Neighborhood map
What this means for you Summary
Snapshot
- This is a 2 × 2-bed/1.0-bath units multifamily listed at $199k.
Deal economics
- At list price, monthly cash flow is $666 ($8k/yr) — positive. Per door: $333/mo.
- The deal already cash-flows at list — no discount required.
- Meets the 1% rule at list price ($3k rent vs $199k).
- Recommended offer: $181k (9.0% below list) — sets the bar for market timing.
- Cap rate 10.3% vs local median 4.6% in Evansville — top-decile yield for the area; either an underpriced asset or a hidden risk that comps aren't pricing in. Stress-test before assuming the spread holds.
Location & tenants
- Location reads 63/100 on livability (#416 in IN) — a middle-class / working-renter tenant base. Strengths: cost of living A+, housing A+, health & safety A+; Watch: crime F, commute F, employment D-.
- Evansville Vanderburgh School Corporation (urban): math 36% / reading 43% proficiency, ranked #153 of 301 in IN (top 51%) — families likely to look elsewhere, expect single-tenant / working-renter base with shorter leases.
- Zoned schools: Glenwood Leadership Academy (math 10% / reading 12%, grade F, #909 of 994 statewide, top 92%, 416 students, 88% FRL); New Tech Institute (math 34% / reading 74%, grade C-, #79 of 369 statewide, top 26%, 275 students, 40% FRL).
- Market conditions: Rents rising fast (+9.9%/yr); 119 active listings in the ZIP; 1 comparable units currently listed for rent nearby; lower-income renter base — watch delinquency; 508 units permitted in Vanderburgh County in 2024 (32 in 5+ unit buildings).
- At $2,515/mo this rent would consume 74% of the median local household income ($41k/yr) (locally 735% of renters already pay >50% of income on rent) — very limited rent-growth headroom before tenants either downsize or default.
Forward outlook
- Local home prices are declining (-3.0%/yr); year-one equity from $1k of loan paydown is wiped out by about $6k of value loss. Plan a longer hold.
- At projected returns (-3.0% appreciation + 8.0% rent growth), your $56k cash investment doubles in ~7 years — after that, you're playing with house money.
Negotiation context
- It's been on market 94 days — a 9% lower offer ($181k) is reasonable based on typical stale-listing flexibility.
Risks & watch-outs
- Watch-outs: built in 1894 — expect roof / HVAC / electrical / plumbing capex.
- Climate carrying-cost: extreme-heat days projected 7→19/yr by 2055 (HVAC capex compounding) — expect insurance premiums to compound above CPI over the hold.
Questions for the listing agent
- It's been on market 94 days. Have you received any prior offers? Is the seller open to a 9% concession, seller financing, or rate buy-down credit?
- Can we see the unit-by-unit rent roll, current vacancy, and any below-market leases? What's the average tenancy length?
- What capital expenditures (roof, boiler, parking lot, exteriors) have been made in the last 5 years, and what's planned in the next 2?
- Built in 1894 — when were the roof, HVAC, electrical panel, plumbing, and water heater last replaced?
- Why hasn't it sold? Are there any deal-killer items the seller is aware of (foundation, flood, title, zoning, code violations)?
- Is there a deadline driving the sale (1031 exchange, divorce, estate, relocation)? That informs how much negotiation room exists.
- Schools are D-rated, which usually means shorter tenancies and higher turnover. Who's the typical renter profile here, and what's been the actual vacancy rate?
- Crime grade is F in this area — have there been break-ins, vandalism, or insurance claims at this property in the last 3 years? What carrier currently insures it and at what premium?
- What's the average days-on-market for RENTAL listings here right now (not sales)? A rising rental-DOM trend means longer vacancies and softer asking-rent achievability than the comps imply.
- What's the recent tenant-quality profile in this submarket — average credit score on applications, eviction rate, late-payment / NSF rate, and stable-employment percentage? A property-management company in the area should have these aggregated.
- How much new apartment / multifamily construction is in the pipeline within 1–3 miles? Heavy new supply (>2% of stock underway) typically softens rents 12–24 months out; light construction supports rent growth.
Investment metrics
- 1% rule
- 1.26% ✓
- Cap rate
- 10.31%
- Cash-on-cash
- 14.34%
- DSCR
- 1.64
- GRM
- 6.6
CMA / ARV
- ARV (on-the-fly)
- $79,632
- Comps found
- 7
Show comp detail 7 sales within ~0.75 mi
| Address | Dist | Beds/Ba | Sqft | Sold | Price | $/sf | Match |
|---|---|---|---|---|---|---|---|
| 1105 S Linwood Ave | 0.51mi | 5/2.0 (+1) | 2,755 (-3%) | 8mo | $75,000 | $27 | 52 |
| 1116 SE First St | 0.66mi | 3/4.0 (-1) | 2,940 (+3%) | 11mo | $180,000 | $61 | 49 |
| 205-207 Blackford Ave | 0.75mi | 4/2.0 | 2,717 (-4%) | 3mo | $322,000 | $119 | 47 |
| 1015 S Linwood Ave | 0.54mi | 4/1.5 | 2,639 (-7%) | 13mo | $51,666 | $20 | 42 |
| 913 Washington St | 0.70mi | 4/2.0 | 2,630 (-8%) | 7mo | $60,000 | $23 | 41 |
| 423 Jefferson Ave | 0.43mi | 5/2.0 (+1) | 2,437 (-14%) | 6mo | $160,000 | $66 | 38 |
| 524 Madison Ave | 0.40mi | 3/1.0 (-1) | 2,520 (-11%) | 22mo | $70,000 | $28 | 27 |
Match score weights: distance 35% · size 25% · config 20% · recency 20%. Top-matched comps best support the ARV.
Projected returns pro-forma
-3.0% appreciation · 8.0% rent growth · sell at horizon
- IRR
- 10.1%
- Equity multiple
- 1.42×
- Total profit
- $23,465
- Equity at exit
- $29,672
- IRR
- 22.9%
- Equity multiple
- 3.43×
- Total profit
- $135,562
- Equity at exit
- $17,206
Cash invested: $55,720 (down + closing). Projections, not guarantees.
Landlord ↔ Tenant lean methodology
- Overall (STATE)
- 90 Strongly Landlord-Friendly
- State Indiana
- 90 Strongly Landlord-Friendly · R+11
- County
- — inherits STATE
- City
- — inherits STATE
ZIP-level market 47713
- Home prices YoY
- -34.1%
- Rents YoY
- 9.9%
- Active inventory
- 119
- Price-to-rent
- 13.2×
Monthly cashflow live
- Estimated rent
- $2,515 high interval (Pro) →
- Mortgage (P&I)
- −$1,044
- Tax from tax record
- −$194 /mo · $2,333/yr
- Insurance
- −$83
- HOA
- −$0
- Vacancy / Maint / Mgmt
- −$528
- Net cashflow
- $666
Break-even live
Sensitivity live
| Price | -10% $779 | -5% $722 | +0% $666 | +5% $610 | +10% $553 |
|---|---|---|---|---|---|
| Rent | -10% $467 | -5% $567 | +0% $666 | +5% $765 | +10% $865 |
| Rate | -1.0pp $766 | -0.5pp $717 | base $666 | +0.5pp $614 | +1.0pp $562 |
2-unit breakdown (identical units grouped — click to expand)
| Units | Beds | Baths | Est. rent |
|---|---|---|---|
| 2× units | 2 | 1 | $2,516 |
| #1 | 2 | 1 | $1,258 |
| #2 | 2 | 1 | $1,258 |
| Total (2 units) | $2,515 | ||
UW: 25.0% down · 7.5% · 30yr · 1.5% tax · 5.0% vac · 8.0% maint · 8.0% mgmt
Financing live
Cash to close
- Down payment
- $49,750
- Closing costs
- $5,970
- Reserves months
- —
- Total cash needed
- —
Loan-product check · same deal, 3 products live
Conventional
25% down · 7.5% · 30yr
- Down + closing
- —
- Monthly P&I
- —
- Monthly cashflow
- —
- DSCR
- —
- Eligible?
- —
Personal DTI + credit; lowest rate.
DSCR
20% down · 8.5% · 30yr
- Down + closing
- —
- Monthly P&I
- —
- Monthly cashflow
- —
- DSCR
- —
- Eligible?
- —
No personal income docs; deal must DSCR.
Hard money
10% down · 12.0% · 12mo
- Down + closing
- —
- Monthly P&I
- —
- Monthly cashflow
- —
- DSCR
- —
- Eligible?
- —
Short-term bridge; refi at stabilization.
Rent comps 1 comps
| Address | Beds | Baths | Sqft | Rent | $/sqft | DOM | Units | Dist |
|---|---|---|---|---|---|---|---|---|
| 1213 Washington Ave Evansville, IN | 4.0 | 1.0 | 1984 | $1,595 | $0.80 | 22d | 1 | 1.01mi |
Listing history 16 events
-
2026-06-22days on market $199,000 Active 94 DOM
-
2026-06-18days on market $199,000 Active 91 DOM
-
2026-06-17days on market $199,000 Active 90 DOM
-
2026-06-16days on market $199,000 Active 89 DOM
-
2026-06-15days on market $199,000 Active 88 DOM
-
2026-06-14days on market $199,000 Active 86 DOM
-
2026-06-13days on market $199,000 Active 85 DOM
-
2026-06-10days on market $199,000 Active 83 DOM
-
2026-06-09days on market $199,000 Active 82 DOM
-
2026-06-08days on market $199,000 Active 81 DOM
-
2026-06-07days on market $199,000 Active 80 DOM
-
2026-06-02days on market $199,000 Active 75 DOM
-
2026-06-01days on market $199,000 Active 74 DOM
-
2026-05-31days on market $199,000 Active 73 DOM
-
2026-05-30days on market $199,000 Active 72 DOM
-
2026-03-19$199,000 Active
ⓘ Source: listings_history table (triggers on properties + properties_extension) + one-shot
backfill from property_details.listing_events for pre-trigger history.
Tax reassessment forecast IN · Partial reset (capped growth)
- Current annual tax
- $2,333 · $194/mo
- Projected year-2 tax
- $2,333 · $194/mo
- Expected delta
- $0/yr ($0/mo · 0.0%)
ⓘ Screening estimate from a state-policy table — verify with the county assessor before closing.
Climate risk First Street
- Flood 1/10 Low FEMA zone X · 0% chance over 30 yrs
- Wildfire 1/10 Low
- Heat 5/10 Major 7 d/yr ≥107°F today · 19 d/yr by 30 yrs out
- Wind 2/10 Low 3% chance of damaging wind over 30 yrs
- Air quality 4/10 Moderate 3 unhealthy d/yr today · 5 by 30 yrs out
Nearby sold comps map
Loading sold comps map…
Walkable amenities ~0.75 mi
Loading nearby amenities…
Taxation est. · year 1
- Rental income
- $30,180
- − Mortgage interest
- −$11,147
- − Property taxes
- −$2,333
- − Insurance
- −$995
- − Repairs & maintenance
- −$2,414
- − Management
- −$2,414
- − Depreciation
- −$5,789
- Taxable income
- $5,087
- Est. tax owed @ 24.0%
- −$1,221
- After-tax cash flow
- $6,771/yr
For passive investors: Depreciation is non-cash, so a rental often shows a tax loss while cash-flowing — sheltering income. Rental losses are passive: they offset passive income freely, and up to $25,000/yr can offset ordinary (W-2) income if you actively participate and your MAGI is under $100k (phasing out to $0 by $150k); unused losses carry forward. On sale, claimed depreciation is recaptured at up to 25%, and gains may owe capital-gains tax (a 1031 exchange can defer both). Figures are a year-1 estimate at your 24.0% rate — not tax advice; consult a CPA.
Schools (NCES district)
- District
- Evansville Vanderburgh School Corporation
- NCES district ID
- 1803450
- Math proficiency
- 36% ▼ -7.00%
- Reading proficiency
- 43% ▼ -3.00%
- Median HH income
- $43,270
- Composite
- 33.41/100
- National rank
- #5471
- State rank
- #153 of 301 in IN
Livability — Evansville
- Score
- 63/100
- State rank
- #416
- US rank
- #15047
Category grades
Schools grade is shown separately in the Schools card above.
Census & demographics
- Census place
- Evansville, IN
- County
- Vanderburgh County · 146,793 people
- City population
- 146,793
- Metro
- Evansville, IN-KY
- Population (ZIP)
- 9,988
- Household income
- $40,873
- Rent vs Own
- Severe rent burden
- 735.0
Population outlook (Vanderburgh County) Hauer SSP2
- Today (2025)
- 187,038 people
- By 2030
- 188,907 · +1.0%
- By 2040
- 190,272 · +1.7%
- By 2050
- 188,871 · +1.0%
- By 2075
- 180,751 · -3.4%
- By 2100
- 163,015 · -12.8%
Race, ethnicity, and origin ACS 2023
- Neighborhood character
- Diverse neighborhood (Simpson 0.60)
- Race & ethnicity
- White 50% Black 39% Two or more races 7% Hispanic / Latino 3% Pacific Islander 1% Asian 1%
- Common ancestry
- Romanian 2% Lithuanian 1% Italian 1%
- Foreign-born
- 5% · Canada
- Languages at home
- 96% English-only · Spanish 2% Tagalog/Filipino 1% French/Haitian/Cajun 1%
Political lean MEDSL · Vanderburgh
- 2024 margin
- R (+12.7) · D 43.0% · R 55.6% · Other 1.4%
- 2008→2024 swing
- -15.1pp toward R · 2008: 2.5pp · 2024: -12.7pp
- All cycles
- 2024: R+12.7 2020: R+9.6 2016: R+16.9 2012: R+10.8 2008: D+2.5
Not yet ingested
- Civics
- —
Market trends
- HPI YoY
- ▼ -119.22%
- Current HPI
- 229.9312
- Rent YoY
- ▲ 9.87%
- Metro
- Evansville, IN-KY
- State GDP YoY
- ▲ 2.90%
- F500 in state
- 18
Industry mix (Fortune 500 HQ in IN)
| Industry | F500 HQs | Revenue |
|---|---|---|
| Industrial Machinery | 2 | $37B |
|
||
| Healthcare | 1 | $177B |
|
||
| Pharmaceuticals | 1 | $45B |
|
||
| Metals / Steel | 1 | $18B |
|
||
| Agriculture | 1 | $17B |
|
||
| Packaging | 1 | $12B |
|
||
Price history
1 event — show timeline
- 2026-03-19 Listed $199,000 IRMLS
Property tax history
+2.7%/yrLatest (2024): $2,333 · +2.3% YoY. Source: county tax records.
Cash-flow waterfall
monthlySold comps — $/sqft
last 12 mo · ≤1 miLoading sold comps…