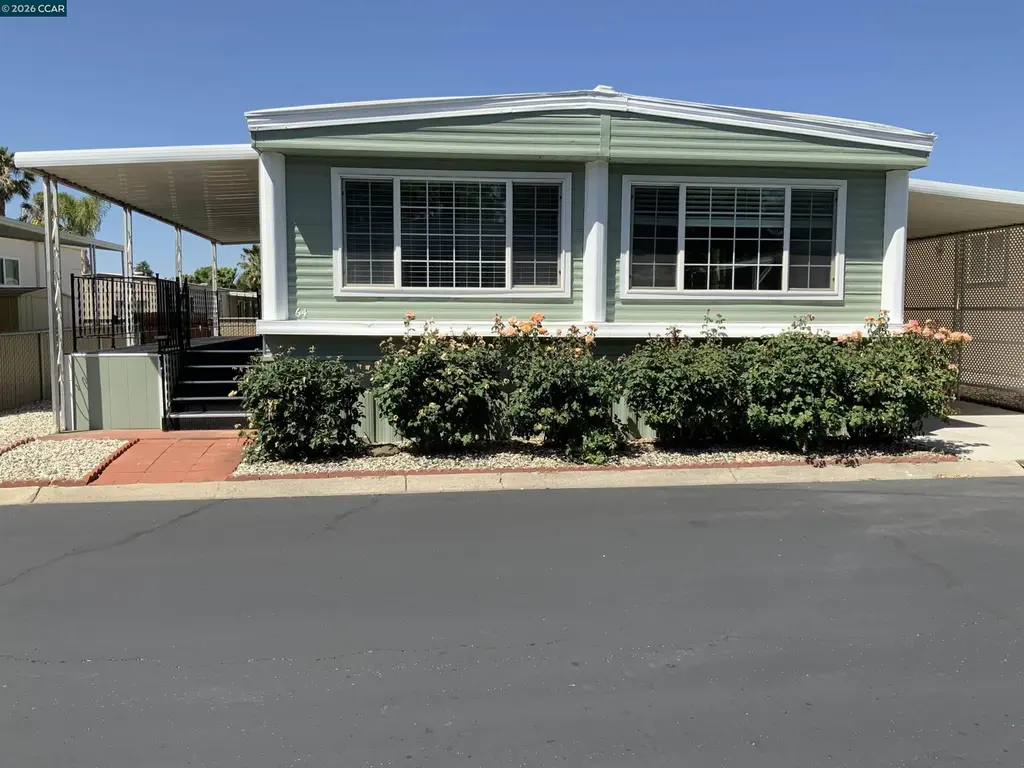
4603 Balfour Rd #64 · Brentwood, CA
Flood risk 5/10 · Moderate
- FEMA flood zone
- X (unshaded)
- Chance of flooding over 30 yrs
- 0.59%
- Est. flood insurance / yr
- $507 – $1,088
Fire risk 1/10 · Minimal
- Est. fire insurance / yr
- $659 – $1,223
Heat risk 6/10 · Moderate
- Hot days now (above 102°F)
- 7 days/yr
- Hot days in 30 yrs
- 13 days/yr
Wind risk 1/10 · Minimal
- Chance of severe wind over 30 yrs
- —
Air-quality risk 9/10 · Severe
- Unhealthy air days now
- 17 days/yr
- Unhealthy air days in 30 yrs
- 19 days/yr
Risk factors via First Street. Map © Google.
Why this score? — see what drove the A- grade
The composite is a weighted blend of 9 inputs, each scored 0–100. Each bar is that input's sub-score; the figure is the points it added to the 100-point composite (weight × sub-score).
- Cash flow +30.0/30.0
- ARV discount +14.1/15.0
- 1% rule +10.0/10.0
- DSCR +10.0/10.0
- Schools +5.3/10.0
- Condition / age +4.0/5.0
- Rent growth +3.8/5.0
- Livability +3.1/5.0
- Appreciation +0.0/10.0
$194,900
🖨 Deal sheet 📄 Offer letter ✓ Due diligence
Listing remarks
Woodgate’s 55+ community features a beautifully updated home that’s been nearly completely renovated. The spacious living room is filled with natural light from large windows, and there’s an additional family room with access to the covered driveway. The kitchen shines with brand-new stainless steel appliances, quartz countertops, and a pantry for added storage. Luxury vinyl plank flooring runs throughout, while all three bedrooms have fresh new carpeting. The primary bathroom offers a generous stall shower and a new vanity topped with quartz. Outside, a large side yard provides a blank canvas ready for your personal touch. Space rent is $1300 mo.
Key facts
- Pantry
- Quartz countertops
- Natural light
Tags
Property features AI
Finance
- HOA & community: Pets allowed upon approval; Clubhouse; Greenbelt; Activities available; Senior community; Park name: WOODGATE PARK
Exterior
- Parking: 2-car garage; Carport for 2 or more vehicles; 2 covered parking spaces
- Utilities: Public water; Public sewer; Natural gas available
- Home design: Manufactured home in park; Double wide model (Champion)
- Construction: Aluminum siding; Crawl space foundation
- Exterior features: Covered patio/porch; Side yard; Landscaped, level lot; Community pool
Interior
- Kitchen: Dishwasher; Gas range / cooktop; Free-standing range / oven; Microwave; Garbage disposal; Refrigerator; Pantry; Solid surface countertops
- Bedrooms: 2 bedrooms (street level)
- Flooring: Vinyl; Carpet
- Bathrooms: 2 full bathrooms; Primary bathroom with stall shower; Other bathroom(s) with shower over tub
- Heating & cooling: Forced air heating; Central air conditioning; Ceiling fans
- Interior features: Solid surface countertops; Pantry; No additional rooms listed; Double pane windows; Window coverings
- Laundry & utility: Washer/dryer hookups only; Gas water heater
Neighborhood map
What this means for you Summary
Snapshot
- This is a 3-bed/2.0-bath manufactured listed at $195k. Condition is rated good.
Deal economics
- At list price, monthly cash flow is $1k ($17k/yr) — positive.
- The deal already cash-flows at list — no discount required.
- Meets the 1% rule at list price ($3k rent vs $195k).
- Recommended offer: $192k (1.5% below list) — sets the bar for market timing.
- Cap rate 15.0% vs local median 2.7% in Brentwood — top-decile yield for the area; either an underpriced asset or a hidden risk that comps aren't pricing in. Stress-test before assuming the spread holds.
Location & tenants
- Location reads 61/100 on livability (#525 in CA) — a middle-class / working-renter tenant base. Strengths: employment A+, housing A+; Watch: amenities F, commute F, cost of living F.
- Brentwood Union Elementary (suburban): math 51% / reading 59% proficiency, ranked #268 of 1,400 in CA (top 19%) — acceptable for families but not a draw, mixed tenant base, ~2y average lease.
- Market conditions: Rents rising fast (+5.2%/yr); 353 active listings in the ZIP; 9 comparable units currently listed for rent nearby; rentals leasing fast (median 11d on market — plan ~1-2 weeks tenant-placement turnaround); high-income renter base; 2,169 units permitted in Contra Costa County in 2024 (896 in 5+ unit buildings).
Forward outlook
- Local home prices are declining (-3.0%/yr); year-one equity from $1k of loan paydown is wiped out by about $6k of value loss. Plan a longer hold.
- Contra Costa County population projected at +26% by 2050 — long-run rental-demand tailwind backs the buy-and-hold thesis.
- At projected returns (-3.0% appreciation + 5.2% rent growth), your $55k cash investment doubles in ~4 years — after that, you're playing with house money.
Negotiation context
- It's been on market 22 days — a 2% lower offer ($192k) is reasonable based on typical stale-listing flexibility.
Risks & watch-outs
- Climate carrying-cost: moderate flood risk; extreme-heat days projected 7→13/yr by 2055 (HVAC capex compounding) — expect insurance premiums to compound above CPI over the hold.
Questions for the listing agent
- Built in 1975 — when were the roof, HVAC, electrical panel, plumbing, and water heater last replaced?
- Is there a deadline driving the sale (1031 exchange, divorce, estate, relocation)? That informs how much negotiation room exists.
- What's the average days-on-market for RENTAL listings here right now (not sales)? A rising rental-DOM trend means longer vacancies and softer asking-rent achievability than the comps imply.
- What's the recent tenant-quality profile in this submarket — average credit score on applications, eviction rate, late-payment / NSF rate, and stable-employment percentage? A property-management company in the area should have these aggregated.
- How much new for-sale + rental construction is in the pipeline within 1–3 miles? Heavy new supply typically softens prices + rents 12–24 months out; constrained supply supports both.
Investment metrics
- 1% rule
- 1.79% ✓
- Cap rate
- 15.00%
- Cash-on-cash
- 31.11%
- DSCR
- 2.38
- GRM
- 4.6
CMA / ARV
- ARV (on-the-fly)
- $228,480
- Comps found
- 12
Show comp detail 12 sales within ~0.75 mi
| Address | Dist | Beds/Ba | Sqft | Sold | Price | $/sf | Match |
|---|---|---|---|---|---|---|---|
| 4603 Balfour Rd #11 | 0.06mi | 2/2.0 (-1) | 1,345 (+0%) | 4mo | $235,000 | $175 | 89 |
| 3660 Walnut Blvd #46 | 0.17mi | 2/2.0 (-1) | 1,346 (+0%) | 7mo | $172,500 | $128 | 81 |
| 4603 Balfour Rd #83 | 0.06mi | 2/2.0 (-1) | 1,392 (+4%) | 6mo | $151,499 | $109 | 81 |
| 4603 Balfour Rd Trlr 4 | 0.06mi | 2/2.0 (-1) | 1,248 (-7%) | 2mo | $160,000 | $128 | 78 |
| 3660 Walnut Blvd #34 | 0.17mi | 2/2.0 (-1) | 1,346 (+0%) | 13mo | $255,000 | $189 | 76 |
| 3660 Walnut Blvd #40 | 0.17mi | 3/2.0 | 1,440 (+7%) | 7mo | $245,000 | $170 | 74 |
| 3660 Walnut Blvd #18 | 0.16mi | 3/2.0 | 1,192 (-11%) | 1mo | $260,000 | $218 | 73 |
| 4603 Balfour #29 | 0.06mi | 2/2.0 (-1) | 1,440 (+7%) | 12mo | $200,000 | $139 | 70 |
| 4603 Balfour Rd #68 | 0.06mi | 3/2.0 | 1,493 (+11%) | 13mo | $226,500 | $152 | 68 |
| 3660 Walnut Blvd #57 | 0.17mi | 2/2.0 (-1) | 1,251 (-7%) | 10mo | $235,000 | $188 | 67 |
| 3660 Walnut Blvd #14 | 0.17mi | 2/2.0 (-1) | 1,174 (-13%) | 4mo | $215,000 | $183 | 63 |
| 3660 Walnut Blvd #53 | 0.17mi | 3/2.0 | 1,540 (+15%) | 10mo | $260,000 | $169 | 60 |
Match score weights: distance 35% · size 25% · config 20% · recency 20%. Top-matched comps best support the ARV.
Projected returns pro-forma
-3.0% appreciation · 5.22% rent growth · sell at horizon
- IRR
- 28.4%
- Equity multiple
- 2.22×
- Total profit
- $66,564
- Equity at exit
- $29,060
- IRR
- 37.1%
- Equity multiple
- 4.82×
- Total profit
- $208,486
- Equity at exit
- $16,851
Cash invested: $54,572 (down + closing). Projections, not guarantees.
Landlord ↔ Tenant lean methodology
- Overall (STATE)
- 18 Strongly Tenant-Friendly
- State California
- 18 Strongly Tenant-Friendly · D+13
- County
- — inherits STATE
- City
- — inherits STATE
ZIP-level market 94513
- Rents YoY
- 5.2%
- Active inventory
- 353
- Price-to-rent
- 4.6×
Monthly cashflow live
- Estimated rent
- $3,496 high interval (Pro) →
- Mortgage (P&I)
- −$1,022
- Tax est. 1.5%
- −$244 /mo · $2,924/yr
- Insurance
- −$81
- HOA
- −$0
- Vacancy / Maint / Mgmt
- −$734
- Net cashflow
- $1,415
Break-even live
UW: 25.0% down · 7.5% · 30yr · 1.5% tax · 5.0% vac · 8.0% maint · 8.0% mgmt
Financing live
Cash to close
- Down payment
- $48,725
- Closing costs
- $5,847
- Reserves months
- —
- Total cash needed
- —
Loan-product check · same deal, 3 products live
Conventional
25% down · 7.5% · 30yr
- Down + closing
- —
- Monthly P&I
- —
- Monthly cashflow
- —
- DSCR
- —
- Eligible?
- —
Personal DTI + credit; lowest rate.
DSCR
20% down · 8.5% · 30yr
- Down + closing
- —
- Monthly P&I
- —
- Monthly cashflow
- —
- DSCR
- —
- Eligible?
- —
No personal income docs; deal must DSCR.
Hard money
10% down · 12.0% · 12mo
- Down + closing
- —
- Monthly P&I
- —
- Monthly cashflow
- —
- DSCR
- —
- Eligible?
- —
Short-term bridge; refi at stabilization.
Rent comps 9 comps
| Address | Beds | Baths | Sqft | Rent | $/sqft | DOM | Units | Dist |
|---|---|---|---|---|---|---|---|---|
| 18 Canterbury Ct Brentwood, CA | 3.0 | 2.0 | 1480 | $3,200 | $2.16 | 2d | 1 | 0.57mi |
| 128 Kingfisher St Brentwood, CA | 3.0 | 2.5 | 1667 | $2,990 | $1.79 | 10d | 1 | 0.93mi |
| 1275 Central Blvd Brentwood, CA | 3.0 | 2.0 | 1050 | $3,650 | $3.48 | 10d | 1 | 0.97mi |
| 720 Winding Creek Ter Brentwood, CA | 3.0 | 2.5 | 1531 | $2,900 | $1.89 | 10d | 1 | 1.16mi |
| 955 Bighorn Ter Brentwood, CA | 3.0 | 2.5 | 1531 | $3,400 | $2.22 | 19d | 1 | 1.28mi |
| 1015 Dellwood Ct Brentwood, CA | 3.0 | 3.0 | 1645 | $3,200 | $1.95 | 24d | 1 | 1.28mi |
| 1290 Business Center Dr Brentwood, CA | 1.0–2.0 | 1.0–2.0 | 973 | $3,380 | $3.47 | 2d | 7 | 1.30mi |
| 1100 Twinbridge Ct Brentwood, CA | 3.0 | 2.5 | 1158 | $3,250 | $2.81 | 2d | 1 | 1.37mi |
| 1377 Reagan Way Brentwood, CA | 3.0 | 2.5 | 1573 | $3,100 | $1.97 | 2d | 1 | 1.41mi |
Listing history 7 events
-
2026-06-18days on market $194,900 Active 22 DOM
-
2026-06-17days on market $194,900 Active 21 DOM
-
2026-06-16days on market $194,900 Active 20 DOM
-
2026-06-15days on market $194,900 Active 19 DOM
-
2026-06-13days on market $194,900 Active 17 DOM
-
2026-06-13statusdays on market $194,900 Active 16 DOM
-
2026-05-15$194,900 Active
ⓘ Source: listings_history table (triggers on properties + properties_extension) + one-shot
backfill from property_details.listing_events for pre-trigger history.
Climate risk First Street
- Flood 5/10 Major FEMA zone X (unshaded) · 59% chance over 30 yrs
- Wildfire 1/10 Low
- Heat 6/10 Major 7 d/yr ≥102°F today · 13 d/yr by 30 yrs out
- Wind 1/10 Low
- Air quality 9/10 Extreme 17 unhealthy d/yr today · 19 by 30 yrs out
Nearby sold comps map
Loading sold comps map…
Walkable amenities ~0.75 mi
Loading nearby amenities…
Taxation est. · year 1
- Rental income
- $41,951
- − Mortgage interest
- −$10,917
- − Property taxes
- −$2,924
- − Insurance
- −$974
- − Repairs & maintenance
- −$3,356
- − Management
- −$3,356
- − Depreciation
- −$5,670
- Taxable income
- $14,753
- Est. tax owed @ 24.0%
- −$3,541
- After-tax cash flow
- $13,437/yr
For passive investors: Depreciation is non-cash, so a rental often shows a tax loss while cash-flowing — sheltering income. Rental losses are passive: they offset passive income freely, and up to $25,000/yr can offset ordinary (W-2) income if you actively participate and your MAGI is under $100k (phasing out to $0 by $150k); unused losses carry forward. On sale, claimed depreciation is recaptured at up to 25%, and gains may owe capital-gains tax (a 1031 exchange can defer both). Figures are a year-1 estimate at your 24.0% rate — not tax advice; consult a CPA.
Condition & rehab AI · 30 photos
This nearly completely renovated manufactured home is move-in ready with good condition and fresh updates.
Value-add opportunities
- Both Paint exterior siding — Enhances curb appeal and value
- Both Replace carpet in bedrooms — Fresh carpet improves comfort and value
- Both Install new window treatments — Enhances curb appeal and value
- Both Upgrade light fixtures — Improves ambiance and value
Renovation cost estimate screening
Value-add ROI direction
- Both Paint exterior siding — Enhances curb appeal and value ↑
- Both Replace carpet in bedrooms — Fresh carpet improves comfort and value ↑
- Both Install new window treatments — Enhances curb appeal and value ↑
- Both Upgrade light fixtures — Improves ambiance and value ↑
ⓘ Cost ranges are severity-bucket heuristics (US national rule-of-thumb). Get contractor quotes + a written scope before underwriting a rehab budget.
Schools (NCES district)
- District
- Brentwood Union Elementary
- NCES district ID
- 0605910
- Math proficiency
- 51% ▲ 1.00%
- Reading proficiency
- 59% ▬ 0.00%
- Median HH income
- $91,644
- Composite
- 52.7/100
- National rank
- #3320
- State rank
- #268 of 1400 in CA
Livability — Brentwood
- Score
- 61/100
- State rank
- #525
- US rank
- #17696
Category grades
Schools grade is shown separately in the Schools card above.
Census & demographics
- Census place
- Brentwood, CA
- County
- Contra Costa County · 1,059,880 people
- City population
- 69,755
- Metro
- San Francisco-Oakland-Berkeley, CA
- Population (ZIP)
- 69,755
- Household income
- $142,223
- Rent vs Own
- Severe rent burden
- 1056.0
Population outlook (Contra Costa County) Hauer SSP2
- Today (2025)
- 1,287,720 people
- By 2030
- 1,364,937 · +6.0%
- By 2040
- 1,506,209 · +17.0%
- By 2050
- 1,624,373 · +26.1%
- By 2075
- 1,853,193 · +43.9%
- By 2100
- 1,901,231 · +47.6%
Race, ethnicity, and origin ACS 2023
- Neighborhood character
- Highly diverse neighborhood (Simpson 0.71)
- Race & ethnicity
- White 43% Hispanic / Latino 25% Asian 16% Two or more races 14% Black 9%
- Hispanic origin (detail)
- Mexican 17%
- Common ancestry
- Italian 3% Russian 2% Romanian 2%
- Foreign-born
- 19% · Canada, China, South Korea
- Languages at home
- 71% English-only · Spanish 13% Other Indo-European 5% Tagalog/Filipino 4%
Political lean MEDSL · Contra Costa
- 2024 margin
- Solid D (+38.0) · D 67.3% · R 29.4% · Other 3.3%
- 2008→2024 swing
- +0.2pp no change · 2008: 37.8pp · 2024: 38.0pp
- All cycles
- 2024: D+38.0 2020: D+45.3 2016: D+43.5 2012: D+33.7 2008: D+37.8
Not yet ingested
- Civics
- —
Market trends
- HPI YoY
- ▼ -245.60%
- Current HPI
- 249.5513
- Rent YoY
- ▲ 5.22%
- Metro
- San Francisco-Oakland-Berkeley, CA
- State GDP YoY
- ▲ 3.21%
- F500 in state
- 116
Industry mix (Fortune 500 HQ in CA)
| Industry | F500 HQs | Revenue |
|---|---|---|
| Technology | 27 | $1,492B |
|
||
| Financial Services | 3 | $174B |
|
||
| Retail | 3 | $44B |
|
||
| Insurance | 3 | $26B |
|
||
| Media / Entertainment | 2 | $115B |
|
||
| Pharmaceuticals / Biotech | 2 | $62B |
|
||
Price history
1 event — show timeline
- 2026-05-15 Listed $194,900 bridgeMLS, Bay East AOR, or Contra Costa AOR
Cash-flow waterfall
monthlySold comps — $/sqft
last 12 mo · ≤1 miLoading sold comps…