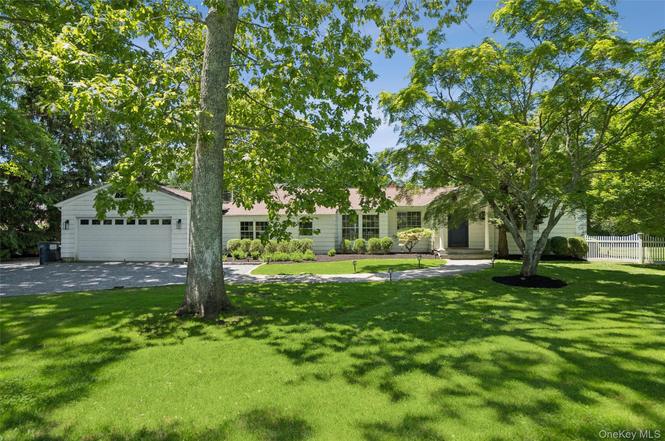
129 Oneck Ln · Westhampton Beach, NY
Flood risk 1/10 · Minimal
- FEMA flood zone
- X (unshaded)
- Chance of flooding over 30 yrs
- 0.0%
- Est. flood insurance / yr
- $507 – $1,088
Fire risk 1/10 · Minimal
- Est. fire insurance / yr
- $691 – $1,283
Heat risk 4/10 · Minor
- Hot days now (above 90°F)
- 7 days/yr
- Hot days in 30 yrs
- 19 days/yr
Wind risk 8/10 · Major
- Chance of severe wind over 30 yrs
- 80.0%
Air-quality risk 4/10 · Minor
- Unhealthy air days now
- 4 days/yr
- Unhealthy air days in 30 yrs
- 5 days/yr
Risk factors via First Street. Map © Google.
Why this score? — see what drove the D grade
The composite is a weighted blend of 9 inputs, each scored 0–100. Each bar is that input's sub-score; the figure is the points it added to the 100-point composite (weight × sub-score).
- Cash flow +12.3/30.0
- Appreciation +10.0/10.0
- Schools +6.6/10.0
- DSCR +3.6/10.0
- 1% rule +3.5/10.0
- Livability +3.2/5.0
- Rent growth +2.5/5.0
- Condition / age +2.5/5.0
- ARV discount +0.0/15.0
$2,600,000
🖨 Deal sheet 📄 Offer letter ✓ Due diligence
Listing remarks
Set on a just-shy acre in the coveted estate section of Westhampton Beach, 129 Oneck Lane presents an exceptional opportunity to own in one of the village's most desirable locations. Just minutes from Main Street and the ocean beaches, the property offers a bright and spacious four-bedroom, four-bath ranch with a 20' x 40' pool and generous deck surrounded by mature plantings and privacy. The existing home features an open and airy layout designed for easy living and entertaining, including an eat-in kitchen, dining area, wet bar, and expansive living room with multiple seating areas. A window-lined sunroom and sliding doors create a seamless connection to the outdoors, perfect for summer g
Key facts
- Wet bar
- Deck access
- 20 x 40 pool
Tags
Property features AI
Finance
- Other: Private in-ground outdoor pool with vinyl lining and pool cover
Exterior
- Parking: Driveway; Private oversized garage; 2-car garage
- Utilities: Electricity connected (PSEG); Water connected; Cesspool sewer; Private trash collection
- Home design: Single family residence; One level
- Construction: Shingle siding
- Exterior features: Awning(s); Deck; Back yard; Fenced yard (vinyl and wood)
Interior
- Kitchen: Eat-in kitchen; Gas range; Microwave; Dishwasher; Garbage disposal; Refrigerator; Exhaust fan
- Bedrooms: Includes a first-floor bedroom
- Flooring: Hardwood; Carpet; Tile
- Bathrooms: Four full bathrooms; Primary bathroom with soaking tub and double vanity
- Heating & cooling: Forced air heating (oil); Central air conditioning
- Interior features: First-floor bedroom; First-floor full bathroom; Built-in features; Central vacuum; Crown molding; Double vanity; Eat-in kitchen; Entrance foyer; High ceilings; Open floorplan; Primary bathroom; Soaking tub; Walk-in closets; Wet bar; Wall of windows; Deck (patio/porch feature)
- Laundry & utility: Washer and dryer included; Washer/dryer hookup; Laundry located in basement; Oil water heater
Neighborhood map
What this means for you Summary
Snapshot
- This is a 4-bed/3.0-bath single-family listed at $2.60M.
Deal economics
- At list price, monthly cash flow is $-498 ($-6k/yr) — negative.
- To cash-flow at today's rent, offer at most $2.53M (2.8% below list).
- To meet the 1% rule (rent ≥ 1% of price), the offer needs to be $2.21M (14.9% below list).
- Recommended offer: $2.21M (14.9% below list) — sets the bar for 1% rule.
- Cap rate 6.1% vs local median 9.3% in Westhampton Beach — below-typical yield; the buyer is paying a premium for something (appreciation thesis, condition, location) that the cap rate doesn't capture.
Location & tenants
- Location reads 64/100 on livability (#740 in NY) — a middle-class / working-renter tenant base. Strengths: crime A+, employment A+; Watch: amenities F, commute F, cost of living F.
- Westhampton Beach Union Free School District (suburban): math 72% / reading 75% proficiency, ranked #81 of 590 in NY (top 14%) — strong family-tenant draw, lease renewals of 3-5y typical.
- Zoned schools: Westhampton Beach Elementary School (math 67% / reading 67%, grade B+, #525 of 2,108 statewide, top 27%, 356 students, 43% FRL); Westhampton Middle School (math 61% / reading 63%, grade B+, #136 of 729 statewide, top 20%, 434 students, 26% FRL); Westhampton Beach Senior High School (math 90% / reading 96%, grade A+, #147 of 1,100 statewide, top 14%, 964 students, 24% FRL).
- Market conditions: 112 active listings in the ZIP; 18 comparable units currently listed for rent nearby; rentals at typical pace (median 25d on market — plan ~3-4 weeks tenant-placement turnaround); 44% of comp listings sitting > 30 days — soft ceiling on asking rent; high-income renter base; 1,366 units permitted in Suffolk County in 2024 (216 in 5+ unit buildings).
- At $22,114/mo this rent would consume 212% of the median local household income ($125k/yr) (locally 43% of renters already pay >50% of income on rent) — very limited rent-growth headroom before tenants either downsize or default.
Forward outlook
- In year one you build about $278k of equity ($18k loan paydown + $260k appreciation (10.0% local appreciation)).
- Suffolk County population projected to shrink 5% by 2050 — rents likely to lag national; underwrite the cash flow, not the appreciation.
- By year 2, paydown + projected appreciation supports a ~$447k cash-out refi (75% LTV) — recoverable capital for the next deal without selling this one.
Negotiation context
- It's been on market 187 days — a 12% lower offer ($2.29M) is reasonable based on typical stale-listing flexibility.
- 5 sale attempts since 13y ago; this cycle's ask has dropped $199k (7%) from the opening price — seller is motivated, your offer sets the floor, not the list.
- Current owner paid $1.30M; list at $2.60M implies a 100% gain — meaningful room to come down on a strong offer.
Risks & watch-outs
- Climate carrying-cost: severe wind risk, 80% chance of damaging wind over 30y — expect insurance premiums to compound above CPI over the hold.
Questions for the listing agent
- What do current leases actually rent for vs. the listed asking? Can we see a recent rent roll and the last 12 months of T-12 income?
- It's been on market 187 days. Have you received any prior offers? Is the seller open to a 15% concession, seller financing, or rate buy-down credit?
- Built in 1970 — when were the roof, HVAC, electrical panel, plumbing, and water heater last replaced?
- Why hasn't it sold? Are there any deal-killer items the seller is aware of (foundation, flood, title, zoning, code violations)?
- Is there a deadline driving the sale (1031 exchange, divorce, estate, relocation)? That informs how much negotiation room exists.
- Schools are A-rated — typically a magnet for longer-tenancy family renters. What's the average tenant stay here, and is there a school-zone premium baked into asking?
- The area grade is low — what's the realistic commute time and amenity access for the typical tenant pool here? Any planned neighborhood developments (good or bad) we should know about?
- What's the average days-on-market for RENTAL listings here right now (not sales)? A rising rental-DOM trend means longer vacancies and softer asking-rent achievability than the comps imply.
- What's the recent tenant-quality profile in this submarket — average credit score on applications, eviction rate, late-payment / NSF rate, and stable-employment percentage? A property-management company in the area should have these aggregated.
- How much new for-sale + rental construction is in the pipeline within 1–3 miles? Heavy new supply typically softens prices + rents 12–24 months out; constrained supply supports both.
Investment metrics
- 1% rule
- 0.85% ✗
- Cap rate
- 6.06%
- Cash-on-cash
- -0.82%
- DSCR
- 0.96
- GRM
- 9.8
CMA / ARV
- ARV (on-the-fly)
- $2,097,846
- Comps found
- 12
Show comp detail 12 sales within ~0.75 mi
| Address | Dist | Beds/Ba | Sqft | Sold | Price | $/sf | Match |
|---|---|---|---|---|---|---|---|
| 279 Mill Rd | 0.30mi | 4/3.5 | 2,948 (+3%) | 7mo | $3,250,000 | $1,102 | 73 |
| 69 Oneck Rd | 0.50mi | 4/3.5 | 2,922 (+2%) | 0mo | $2,250,000 | $770 | 71 |
| 8 Fiddler Crab Trl | 0.72mi | 4/3.0 | 2,826 (-1%) | 2mo | $1,575,000 | $557 | 63 |
| 8 Baycrest Ave | 0.52mi | 3/3.5 (-1) | 2,864 (+0%) | 9mo | $2,250,000 | $786 | 61 |
| 38A Baycrest Ave | 0.31mi | 5/3.0 (+1) | 2,645 (-8%) | 12mo | $2,300,000 | $870 | 58 |
| 394 Mill Rd | 0.53mi | 4/3.5 | 2,700 (-6%) | 9mo | $1,700,000 | $630 | 57 |
| 98 Beach Rd | 0.75mi | 4/3.0 | 3,000 (+5%) | 8mo | $2,200,000 | $733 | 50 |
| 19 Maple St | 0.43mi | 3/3.5 (-1) | 2,552 (-11%) | 8mo | $1,745,000 | $684 | 48 |
| 279 Sunset Ave | 0.69mi | 3/2.5 (-1) | 2,755 (-4%) | 10mo | $1,100,000 | $399 | 46 |
| 46 Oak St | 0.51mi | 4/3.5 | 3,276 (+14%) | 9mo | $1,400,000 | $427 | 43 |
| 5 Lake Way | 0.64mi | 4/3.0 | 2,500 (-13%) | 18mo | $1,595,000 | $638 | 34 |
| 40 Brook Rd | 0.65mi | 5/5.5 (+1) | 2,509 (-12%) | 12mo | $2,250,000 | $897 | 24 |
Match score weights: distance 35% · size 25% · config 20% · recency 20%. Top-matched comps best support the ARV.
Projected returns pro-forma
10.0% appreciation · 3.0% rent growth · sell at horizon
- IRR
- 23.7%
- Equity multiple
- 2.90×
- Total profit
- $1,384,650
- Equity at exit
- $2,342,286
- IRR
- 21.1%
- Equity multiple
- 6.64×
- Total profit
- $4,103,169
- Equity at exit
- $5,051,228
Cash invested: $728,000 (down + closing). Projections, not guarantees.
Landlord ↔ Tenant lean methodology
- Overall (STATE)
- 15 Strongly Tenant-Friendly
- State New York
- 15 Strongly Tenant-Friendly · D+10
- County
- — inherits STATE
- City
- — inherits STATE
ZIP-level market 11978
- Home prices YoY
- 2.9%
- Active inventory
- 112
- Price-to-rent
- 9.8×
Monthly cashflow live
- Estimated rent
- $22,114 medium interval (Pro) →
- Mortgage (P&I)
- −$13,635
- Tax est. 1.5%
- −$3,250 /mo · $39,000/yr
- Insurance
- −$1,083
- HOA
- −$0
- Vacancy / Maint / Mgmt
- −$4,644
- Net cashflow
- $-498
Break-even live
UW: 25.0% down · 7.5% · 30yr · 1.5% tax · 5.0% vac · 8.0% maint · 8.0% mgmt
Financing live
Cash to close
- Down payment
- $650,000
- Closing costs
- $78,000
- Reserves months
- —
- Total cash needed
- —
Loan-product check · same deal, 3 products live
Conventional
25% down · 7.5% · 30yr
- Down + closing
- —
- Monthly P&I
- —
- Monthly cashflow
- —
- DSCR
- —
- Eligible?
- —
Personal DTI + credit; lowest rate.
DSCR
20% down · 8.5% · 30yr
- Down + closing
- —
- Monthly P&I
- —
- Monthly cashflow
- —
- DSCR
- —
- Eligible?
- —
No personal income docs; deal must DSCR.
Hard money
10% down · 12.0% · 12mo
- Down + closing
- —
- Monthly P&I
- —
- Monthly cashflow
- —
- DSCR
- —
- Eligible?
- —
Short-term bridge; refi at stabilization.
Rent comps 18 comps
| Address | Beds | Baths | Sqft | Rent | $/sqft | DOM | Units | Dist |
|---|---|---|---|---|---|---|---|---|
| 31 Liberty St Westhampton Beach, NY | 3.0 | 1.5 | 2000 | $40,000 | $20.00 | 43d | 1 | 0.25mi |
| 37 School St Westhampton Beach, NY | 4.0 | 4.0 | 3204 | $50,000 | $15.61 | 22d | 1 | 0.29mi |
| 38 Liberty St Westhampton Beach, NY | 4.0 | 2.5 | 2565 | $35,000 | $13.65 | 43d | 1 | 0.31mi |
| 69 Oneck Rd Westhampton Beach, NY | 4.0 | 3.5 | 2922 | $10,000 | $3.42 | 7d | 1 | 0.46mi |
| 250 Oneck Ln Westhampton Beach, NY | 5.0 | 2.5 | 3113 | $20,000 | $6.42 | 19d | 1 | 0.62mi |
| 22 Meadow Ln Westhampton Beach, NY | 4.0 | 4.0 | 2500 | $70,000 | $28.00 | 24d | 1 | 0.68mi |
| 99 Beach Rd Westhampton Beach, NY | 4.0 | 2.5 | 2600 | $20,000 | $7.69 | 5d | 1 | 0.70mi |
| 15 Pin Oak Ln Westhampton Beach, NY | 3.0 | 3.0 | 2900 | $30,000 | $10.34 | 43d | 1 | 0.72mi |
| 60 Aspatuck Rd Westhampton Beach, NY | 4.0 | 3.0 | 2150 | $10,000 | $4.65 | 43d | 1 | 0.77mi |
| 64 Aspatuck Rd Westhampton Beach, NY | 4.0 | 3.0 | 2157 | $10,000 | $4.64 | 43d | 1 | 0.78mi |
| 7 Sea Breeze Ave Westhampton, NY | 5.0 | 3.5 | 2723 | $28,000 | $10.28 | 11d | 1 | 0.82mi |
| 38 Jessup Ln Westhampton Beach, NY | 4.0 | 3.5 | 4000 | $33,000 | $8.25 | 43d | 1 | 0.87mi |
| 18 Lakeside Ln Westhampton, NY | 4.0 | 2.5 | 2422 | $25,000 | $10.32 | 43d | 1 | 1.10mi |
| 70 Tanners Neck Ln Westhampton, NY | 4.0 | 3.5 | 2100 | $20,000 | $9.52 | 43d | 1 | 1.11mi |
| 26 Lakeside Ln Westhampton, NY | 5.0 | 4.5 | 2727 | $30,000 | $11.00 | 24d | 1 | 1.12mi |
| 8 Sweetgrass Rd Westhampton, NY | 5.0 | 4.5 | 4050 | $13,000 | $3.21 | 1d | 1 | 1.32mi |
| 13 Buttercup Ln Westhampton, NY | 3.0 | 4.5 | 3278 | $25,000 | $7.63 | 5d | 1 | 1.40mi |
| 25 N Quarter Rd Westhampton, NY | 4.0 | 3.0 | 2000 | $30,000 | $15.00 | 16d | 1 | 1.45mi |
Listing history 25 events
-
2026-06-18days on market $2,600,000 Active 187 DOM
-
2026-06-17days on market $2,600,000 Active 186 DOM
-
2026-06-16days on market $2,600,000 Active 185 DOM
-
2026-06-15days on market $2,600,000 Active 184 DOM
-
2026-06-13days on market $2,600,000 Active 182 DOM
-
2026-06-09days on market $2,600,000 Active 178 DOM
-
2026-06-08days on market $2,600,000 Active 177 DOM
-
2026-06-07days on market $2,600,000 Active 176 DOM
-
2026-06-04days on market $2,600,000 Active 173 DOM
-
2026-06-03days on market $2,600,000 Active 172 DOM
-
2026-06-02days on market $2,600,000 Active 171 DOM
-
2026-06-01days on market $2,600,000 Active 170 DOM
-
2026-05-31days on market $2,600,000 Active 169 DOM
-
2026-05-24status Active
-
2026-03-06price $2,600,000
-
2025-11-10$2,799,000 Active
-
2025-09-03historical $35,000
-
2025-06-06price $35,000
-
2025-06-05$30,000
-
2014-05-08historical
-
2013-06-14$1,399,000
-
2013-04-29historical
-
2013-01-30$1,550,000
-
2008-01-04soldstatus $1,300,000
-
1997-12-30soldstatus $475,000
ⓘ Source: listings_history table (triggers on properties + properties_extension) + one-shot
backfill from property_details.listing_events for pre-trigger history.
Climate risk First Street
- Flood 1/10 Low FEMA zone X (unshaded) · 0% chance over 30 yrs
- Wildfire 1/10 Low
- Heat 4/10 Moderate 7 d/yr ≥90°F today · 19 d/yr by 30 yrs out
- Wind 8/10 Severe 80% chance of damaging wind over 30 yrs
- Air quality 4/10 Moderate 4 unhealthy d/yr today · 5 by 30 yrs out
Nearby sold comps map
Loading sold comps map…
Walkable amenities ~0.75 mi
Loading nearby amenities…
Taxation est. · year 1
- Rental income
- $265,369
- − Mortgage interest
- −$145,640
- − Property taxes
- −$39,000
- − Insurance
- −$13,000
- − Repairs & maintenance
- −$21,229
- − Management
- −$21,229
- − Depreciation
- −$75,636
- Taxable loss
- −$50,367
- Est. tax savings @ 24.0%
- +$12,088
- After-tax cash flow
- $6,113/yr
For passive investors: Depreciation is non-cash, so a rental often shows a tax loss while cash-flowing — sheltering income. Rental losses are passive: they offset passive income freely, and up to $25,000/yr can offset ordinary (W-2) income if you actively participate and your MAGI is under $100k (phasing out to $0 by $150k); unused losses carry forward. On sale, claimed depreciation is recaptured at up to 25%, and gains may owe capital-gains tax (a 1031 exchange can defer both). Figures are a year-1 estimate at your 24.0% rate — not tax advice; consult a CPA.
Schools (NCES district)
- District
- Westhampton Beach Union Free School District
- NCES district ID
- 3631020
- Math proficiency
- 72% ▼ -5.00%
- Reading proficiency
- 75% ▲ 3.00%
- Median HH income
- $88,137
- Composite
- 65.91/100
- National rank
- #444
- State rank
- #81 of 590 in NY
Livability — Westhampton Beach
- Score
- 64/100
- State rank
- #740
- US rank
- #14093
Category grades
Schools grade is shown separately in the Schools card above.
Census & demographics
- Census place
- Westhampton Beach, NY
- County
- Suffolk County · 679,920 people
- City population
- 4,376
- Metro
- New York-Newark-Jersey City, NY-NJ-PA
- Population (ZIP)
- 4,705
- Household income
- $125,179
- Rent vs Own
- Severe rent burden
- 43.0
Population outlook (Suffolk County) Hauer SSP2
- Today (2025)
- 1,505,262 people
- By 2030
- 1,498,318 · -0.5%
- By 2040
- 1,471,101 · -2.3%
- By 2050
- 1,424,848 · -5.3%
- By 2075
- 1,337,157 · -11.2%
- By 2100
- 1,217,720 · -19.1%
Race, ethnicity, and origin ACS 2023
- Neighborhood character
- Predominantly White (72%)
- Race & ethnicity
- White 72% Two or more races 14% Hispanic / Latino 11% Black 6% Asian 2%
- Hispanic origin (detail)
- Puerto Rican 1%
- Common ancestry
- Romanian 7% Scotch-Irish 2% Italian 2%
- Foreign-born
- 14% · Canada, Jamaica, China
- Languages at home
- 84% English-only · Spanish 10% Other Indo-European 2% Russian/Polish/Slavic 1%
Political lean MEDSL · Suffolk
- 2024 margin
- Lean R (+10.0) · D 45.0% · R 55.0%
- 2008→2024 swing
- -16.0pp toward R · 2008: 6.0pp · 2024: -10.0pp
- All cycles
- 2024: R+10.0 2020: R+0.0 2016: R+8.2 2012: D+2.9 2008: D+6.0
Not yet ingested
- Civics
- —
Market trends
- HPI YoY
- ▲ 13.02%
- Current HPI
- 460.3964
- Rent YoY
- —
- Metro
- New York-Newark-Jersey City, NY-NJ-PA
- State GDP YoY
- ▲ 2.60%
- F500 in state
- 92
Industry mix (Fortune 500 HQ in NY)
| Industry | F500 HQs | Revenue |
|---|---|---|
| Financial Services | 10 | $950B |
|
||
| Consumer Goods | 9 | $162B |
|
||
| Insurance | 4 | $225B |
|
||
| Telecommunications | 2 | $144B |
|
||
| Pharmaceuticals | 2 | $112B |
|
||
| Media / Entertainment | 2 | $69B |
|
||
Price history
+447.4% since first listed12 events — show timeline
- 2026-05-24 Relisted — OneKey® MLS as Distributed by MLS Grid
- 2026-03-06 Price Changed $2,600,000 OneKey® MLS as Distributed by MLS Grid
- 2025-11-10 Listed $2,799,000 OneKey® MLS as Distributed by MLS Grid
- 2025-09-03 Rental Removed $35,000 ONEKEY
- 2025-06-06 Price Changed $35,000 ONEKEY
- 2025-06-05 Listed for Rent $30,000 ONEKEY
- 2014-05-08 Listing Removed — OneKey® MLS as Distributed by MLS Grid
- 2013-06-14 Listed $1,399,000 OneKey® MLS as Distributed by MLS Grid
- 2013-04-29 Listing Removed — OneKey® MLS as Distributed by MLS Grid
- 2013-01-30 Listed $1,550,000 OneKey® MLS as Distributed by MLS Grid
- 2008-01-04 Sold (Public Records) $1,300,000 Public Records
- 1997-12-30 Sold (Public Records) $475,000 Public Records
Property tax history
-3.7%/yrLatest (2025): $3,836 · +11.9% YoY. Source: county tax records.
Cash-flow waterfall
monthlySold comps — $/sqft
last 12 mo · ≤1 miLoading sold comps…