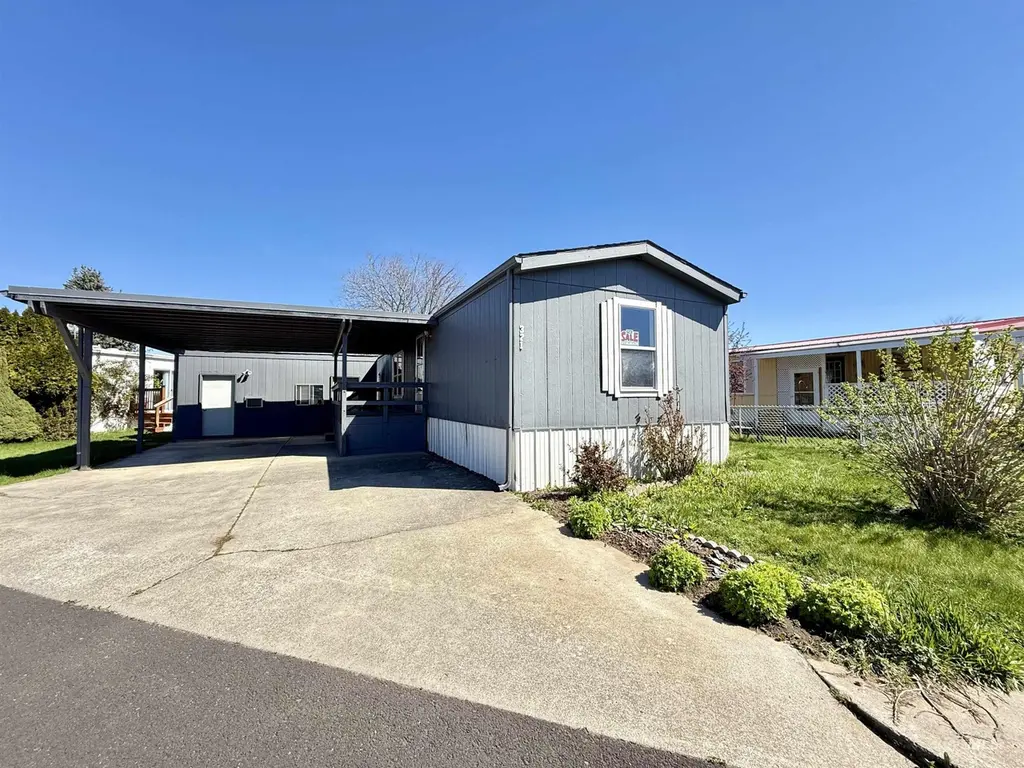
2015 6th Ave #321 · Clarkston Heights-Vineland, WA
Flood risk 1/10 · Minimal
- FEMA flood zone
- X
- Chance of flooding over 30 yrs
- 0.0%
- Est. flood insurance / yr
- $507 – $1,088
Fire risk 3/10 · Minor
- Est. fire insurance / yr
- $604 – $1,122
Heat risk 4/10 · Minor
- Hot days now (above 100°F)
- 6 days/yr
- Hot days in 30 yrs
- 12 days/yr
Wind risk 1/10 · Minimal
- Chance of severe wind over 30 yrs
- —
Air-quality risk 8/10 · Major
- Unhealthy air days now
- 12 days/yr
- Unhealthy air days in 30 yrs
- 17 days/yr
Risk factors via First Street. Map © Google.
Why this score? — see what drove the B- grade
The composite is a weighted blend of 9 inputs, each scored 0–100. Each bar is that input's sub-score; the figure is the points it added to the 100-point composite (weight × sub-score).
- Cash flow +30.0/30.0
- 1% rule +10.0/10.0
- DSCR +10.0/10.0
- Schools +4.2/10.0
- Condition / age +3.8/5.0
- ARV discount +2.7/15.0
- Rent growth +2.5/5.0
- Livability +2.5/5.0
- Appreciation +0.0/10.0
$80,000
🖨 Deal sheet 📄 Offer letter ✓ Due diligence
Listing remarks MLS
Fully remodeled and move-in ready two bedroom, two bath liberty mobile home in the Sonary Crest Park! This 1990 home features updated windows, fresh interior paint, new flooring and a bright functional layout. Enjoy the convenience of a covered carport and additional storage shed for all your extras. Located on a rental lot this is an excellent low maintenance option with modern updates already done for you. Affordable living in a well maintained community. Don’t miss this one!
Key facts
- 2 parking spots
- Built 1990
- Listed 50 days
Neighborhood map
What this means for you Summary
Snapshot
- This is a 2-bed/2.0-bath manufactured listed at $80k. Condition is rated good.
Deal economics
- At list price, monthly cash flow is $425 ($5k/yr) — positive.
- The deal already cash-flows at list — no discount required.
- Meets the 1% rule at list price ($1k rent vs $80k).
- Recommended offer: $78k (3.0% below list) — sets the bar for market timing.
- Cap rate 12.7% vs local median 1.4% in Clarkston Heights-Vineland — top-decile yield for the area; either an underpriced asset or a hidden risk that comps aren't pricing in. Stress-test before assuming the spread holds.
Location & tenants
- Location reads: area grade B — affects rentability + tenant quality, not the cash-flow math above.
- Clarkston School District (suburban): math 38% / reading 57% proficiency, ranked #172 of 291 in WA (top 59%) — families likely to look elsewhere, expect single-tenant / working-renter base with shorter leases.
- Market conditions: 249 active listings in the ZIP; 101 units permitted in Asotin County in 2024 (72 in 5+ unit buildings).
Forward outlook
- Local home prices are declining (-3.0%/yr); year-one equity from $553 of loan paydown is wiped out by about $2k of value loss. Plan a longer hold.
- Asotin County population projected to shrink 3% by 2050 — rents likely to lag national; underwrite the cash flow, not the appreciation.
- At projected returns (-3.0% appreciation + 3.0% rent growth), your $22k cash investment doubles in ~6 years — after that, you're playing with house money.
Negotiation context
- It's been on market 50 days — a 3% lower offer ($78k) is reasonable based on typical stale-listing flexibility.
Questions for the listing agent
- It's been on market 50 days. Have you received any prior offers? Is the seller open to a 3% concession, seller financing, or rate buy-down credit?
- Is there a deadline driving the sale (1031 exchange, divorce, estate, relocation)? That informs how much negotiation room exists.
- What's the average days-on-market for RENTAL listings here right now (not sales)? A rising rental-DOM trend means longer vacancies and softer asking-rent achievability than the comps imply.
- What's the recent tenant-quality profile in this submarket — average credit score on applications, eviction rate, late-payment / NSF rate, and stable-employment percentage? A property-management company in the area should have these aggregated.
- How much new for-sale + rental construction is in the pipeline within 1–3 miles? Heavy new supply typically softens prices + rents 12–24 months out; constrained supply supports both.
Investment metrics
- 1% rule
- 1.55% ✓
- Cap rate
- 12.66%
- Cash-on-cash
- 22.74%
- DSCR
- 2.01
- GRM
- 5.4
CMA / ARV
- ARV (median comp)
- $72,250
- List price
- $80,000
- Delta
- 10.73%
- Verdict
- OVERPRICED
- Comps
- 6 within 1.0 mi
Show comp detail 7 sales within ~0.75 mi
| Address | Dist | Beds/Ba | Sqft | Sold | Price | $/sf | Match |
|---|---|---|---|---|---|---|---|
| 2015 6th Ave #319 | 0.00mi | 3/2.0 (+1) | 980 (0%) | 4mo | $69,500 | $71 | 92 |
| 2015 6th Ave Unit 310C | 0.00mi | 2/2.0 | 924 (-6%) | 9mo | $59,000 | $64 | 83 |
| 2015 6th Ave #141 | 0.00mi | 3/1.5 (+1) | 1,094 (+12%) | 5mo | $49,900 | $46 | 70 |
| 2115 6th Ave #54 | 0.11mi | 2/2.0 | 900 (-8%) | 20mo | $149,900 | $167 | 64 |
| 2015 6th Ave 126a Unit 126A | 0.00mi | 3/2.0 (+1) | 910 (-7%) | 24mo | $39,900 | $44 | 63 |
| 2515 Appleside Blvd #2 | 0.44mi | 3/2.0 (+1) | 960 (-2%) | 12mo | $55,000 | $57 | 61 |
| 2015 6th Ave Unit 141A | 0.00mi | 3/2.0 (+1) | 1,094 (+12%) | 22mo | $47,900 | $44 | 57 |
Match score weights: distance 35% · size 25% · config 20% · recency 20%. Top-matched comps best support the ARV.
Projected returns pro-forma
-3.0% appreciation · 3.0% rent growth · sell at horizon
- IRR
- 15.7%
- Equity multiple
- 1.63×
- Total profit
- $14,096
- Equity at exit
- $11,928
- IRR
- 24.3%
- Equity multiple
- 3.11×
- Total profit
- $47,169
- Equity at exit
- $6,917
Cash invested: $22,400 (down + closing). Projections, not guarantees.
Landlord ↔ Tenant lean methodology
- Overall (STATE)
- 28 Tenant-Leaning
- State Washington
- 28 Tenant-Leaning · D+8
- County
- — inherits STATE
- City
- — inherits STATE
ZIP-level market 99403
- Active inventory
- 249
- Price-to-rent
- 5.4×
Monthly cashflow live
- Estimated rent
- $1,237 medium interval (Pro) →
- Mortgage (P&I)
- −$420
- Tax est. 1.5%
- −$100 /mo · $1,200/yr
- Insurance
- −$33
- HOA
- −$0
- Vacancy / Maint / Mgmt
- −$260
- Net cashflow
- $425
Break-even live
UW: 25.0% down · 7.5% · 30yr · 1.5% tax · 5.0% vac · 8.0% maint · 8.0% mgmt
Financing live
Cash to close
- Down payment
- $20,000
- Closing costs
- $2,400
- Reserves months
- —
- Total cash needed
- —
Loan-product check · same deal, 3 products live
Conventional
25% down · 7.5% · 30yr
- Down + closing
- —
- Monthly P&I
- —
- Monthly cashflow
- —
- DSCR
- —
- Eligible?
- —
Personal DTI + credit; lowest rate.
DSCR
20% down · 8.5% · 30yr
- Down + closing
- —
- Monthly P&I
- —
- Monthly cashflow
- —
- DSCR
- —
- Eligible?
- —
No personal income docs; deal must DSCR.
Hard money
10% down · 12.0% · 12mo
- Down + closing
- —
- Monthly P&I
- —
- Monthly cashflow
- —
- DSCR
- —
- Eligible?
- —
Short-term bridge; refi at stabilization.
Listing history 1 events
-
2026-04-06$80,000 Active 488-char remark
Show marketing remark (488 chars)
Fully remodeled and move-in ready two bedroom, two bath liberty mobile home in the Sonary Crest Park! This 1990 home features updated windows, fresh interior paint, new flooring and a bright functional layout. Enjoy the convenience of a covered carport and additional storage shed for all your extras. Located on a rental lot this is an excellent low maintenance option with modern updates already done for you. Affordable living in a well maintained community. Don’t miss this one!
ⓘ Source: listings_history table (triggers on properties + properties_extension) + one-shot
backfill from property_details.listing_events for pre-trigger history.
Climate risk First Street
- Flood 1/10 Low FEMA zone X · 0% chance over 30 yrs
- Wildfire 3/10 Moderate
- Heat 4/10 Moderate 6 d/yr ≥100°F today · 12 d/yr by 30 yrs out
- Wind 1/10 Low
- Air quality 8/10 Severe 12 unhealthy d/yr today · 17 by 30 yrs out
Nearby sold comps map
Loading sold comps map…
Walkable amenities ~0.75 mi
Loading nearby amenities…
Taxation est. · year 1
- Rental income
- $14,847
- − Mortgage interest
- −$4,481
- − Property taxes
- −$1,200
- − Insurance
- −$400
- − Repairs & maintenance
- −$1,188
- − Management
- −$1,188
- − Depreciation
- −$2,327
- Taxable income
- $4,063
- Est. tax owed @ 24.0%
- −$975
- After-tax cash flow
- $4,120/yr
For passive investors: Depreciation is non-cash, so a rental often shows a tax loss while cash-flowing — sheltering income. Rental losses are passive: they offset passive income freely, and up to $25,000/yr can offset ordinary (W-2) income if you actively participate and your MAGI is under $100k (phasing out to $0 by $150k); unused losses carry forward. On sale, claimed depreciation is recaptured at up to 25%, and gains may owe capital-gains tax (a 1031 exchange can defer both). Figures are a year-1 estimate at your 24.0% rate — not tax advice; consult a CPA.
Condition & rehab AI · 2 photos
This fully remodeled and move-in ready manufactured home in Clarkston Heights-Vineland WA is in good condition with no visible repairs needed. It offers a good investment opportunity with potential for minor updates to enhance its resale and rental value.
Value-add opportunities
- Both Painting the exterior — Fresh paint can enhance curb appeal and property value
- Both Landscaping improvements — Enhanced landscaping can increase curb appeal and property value
- Both Interior touch-ups — Fresh paint and minor touch-ups can improve the home's appearance and value
Renovation cost estimate screening
Value-add ROI direction
- Both Painting the exterior — Fresh paint can enhance curb appeal and property value ↑
- Both Landscaping improvements — Enhanced landscaping can increase curb appeal and property value ↑
- Both Interior touch-ups — Fresh paint and minor touch-ups can improve the home's appearance and value ↑
ⓘ Cost ranges are severity-bucket heuristics (US national rule-of-thumb). Get contractor quotes + a written scope before underwriting a rehab budget.
Schools (NCES district)
- District
- Clarkston School District
- NCES district ID
- 5301320
- Math proficiency
- 38% ▼ -4.00%
- Reading proficiency
- 57% ▲ 1.00%
- Median HH income
- $42,030
- Composite
- 42.03/100
- National rank
- #7065
- State rank
- #172 of 291 in WA
Livability — Clarkston Heights-Vineland
No livability data for this city. (Only ~50 U.S. cities are tracked.)
Census & demographics
- Census place
- Clarkston Heights-Vineland, WA
- Population (ZIP)
- 20,483
Population outlook (Asotin County) Hauer SSP2
- Today (2025)
- 22,623 people
- By 2030
- 22,746 · +0.5%
- By 2040
- 22,597 · -0.1%
- By 2050
- 21,947 · -3.0%
- By 2075
- 19,478 · -13.9%
- By 2100
- 16,206 · -28.4%
Race, ethnicity, and origin ACS 2023
- Neighborhood character
- Predominantly White (87%)
- Race & ethnicity
- White 87% Two or more races 6% Hispanic / Latino 5% Native American 1% Asian 1%
- Common ancestry
- Portuguese 3% Lithuanian 2% Slovak 2%
- Foreign-born
- 2% · Canada
- Languages at home
- 97% English-only · Spanish 2% Tagalog/Filipino 1%
Political lean MEDSL · Asotin
- 2024 margin
- Strong R (+25.6) · D 35.8% · R 61.5% · Other 2.7%
- 2008→2024 swing
- -12.2pp toward R · 2008: -13.4pp · 2024: -25.6pp
- All cycles
- 2024: R+25.6 2020: R+25.7 2016: R+26.8 2012: R+16.7 2008: R+13.4
Not yet ingested
- Civics
- —
Market trends
- HPI YoY
- ▼ -346.91%
- Current HPI
- 173.3027
- Rent YoY
- —
- Metro
- —
- State GDP YoY
- ▲ 4.65%
- F500 in state
- 22
Industry mix (Fortune 500 HQ in WA)
| Industry | F500 HQs | Revenue |
|---|---|---|
| Retail | 2 | $269B |
|
||
| Technology / Retail | 1 | $638B |
|
||
| Technology | 1 | $245B |
|
||
| Telecommunications | 1 | $38B |
|
||
| Food / Beverage | 1 | $36B |
|
||
| Automotive / Trucks | 1 | $34B |
|
||
Price history
1 event — show timeline
- 2026-04-06 Listed $80,000 IMLS
Cash-flow waterfall
monthlySold comps — $/sqft
last 12 mo · ≤1 miLoading sold comps…