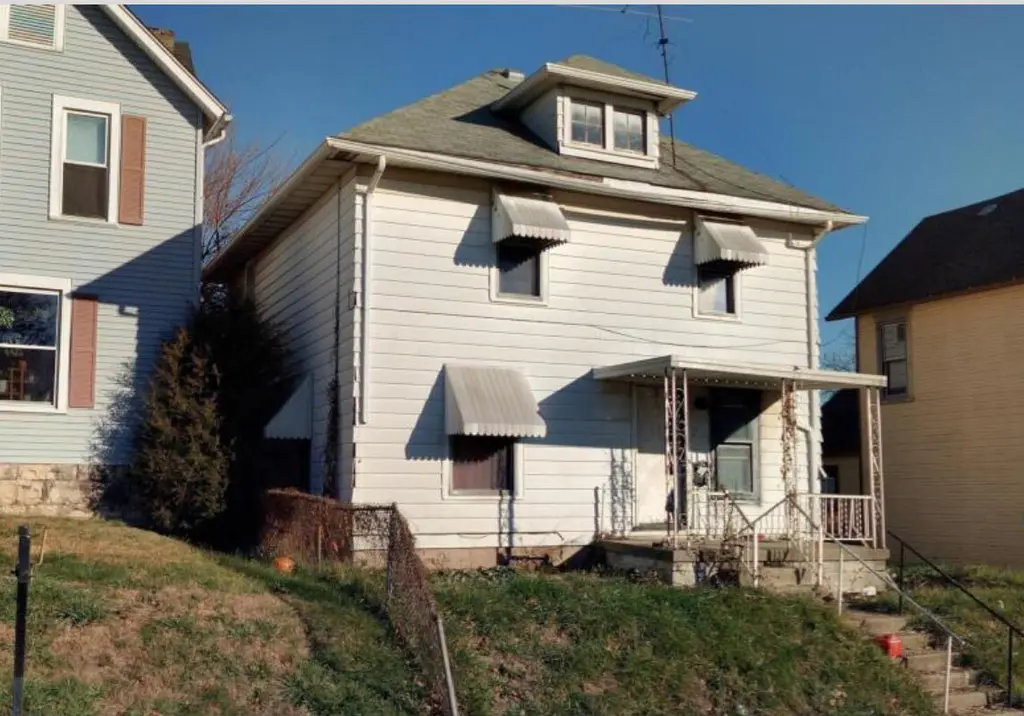
1606 Highland Ave · Springfield, OH
Flood risk 1/10 · Minimal
- FEMA flood zone
- X (unshaded)
- Chance of flooding over 30 yrs
- 0.0%
- Est. flood insurance / yr
- $473 – $860
Fire risk 1/10 · Minimal
- Est. fire insurance / yr
- $713 – $1,323
Heat risk 3/10 · Minor
- Hot days now (above 100°F)
- 7 days/yr
- Hot days in 30 yrs
- 18 days/yr
Wind risk 2/10 · Minimal
- Chance of severe wind over 30 yrs
- —
Air-quality risk 3/10 · Minor
- Unhealthy air days now
- 2 days/yr
- Unhealthy air days in 30 yrs
- 3 days/yr
Risk factors via First Street. Map © Google.
Why this score? — see what drove the B- grade
The composite is a weighted blend of 9 inputs, each scored 0–100. Each bar is that input's sub-score; the figure is the points it added to the 100-point composite (weight × sub-score).
- Cash flow +30.0/30.0
- 1% rule +10.0/10.0
- DSCR +10.0/10.0
- ARV discount +7.5/15.0
- Livability +2.8/5.0
- Rent growth +2.5/5.0
- Condition / age +2.5/5.0
- Schools +1.9/10.0
- Appreciation +0.0/10.0
$49,900
🖨 Deal sheet 📄 Offer letter ✓ Due diligence
Listing remarks MLS
Asset #739504. Must have approval letter or proof of funds with offer. Addendum will be signed after acceptance. Seller's title company to hold earnest money. Property being sold in as-is condition. Agent, see Broker Remarks.
Key facts
- 5,227 sq ft lot
- Built 1909
- Listed 7 days
Property features AI
Exterior
- Utilities: Supplied water; Public sewer; Sewer connected
- Home design: Single-family residence; Residential property
- Construction: Built in 1909; Aluminum and vinyl siding
- Exterior features: Porch; Fenced yard; Residential lot
Interior
- Kitchen: Gas water heater
- Bedrooms: Four bedrooms
- Bathrooms: Two full bathrooms
- Heating & cooling: Natural gas heating; Has heating
- Interior features: Seven total rooms; Partial basement
Neighborhood map
What this means for you Summary
Snapshot
- This is a 2-bed/2.0-bath single-family listed at $50k.
Deal economics
- At list price, monthly cash flow is $485 ($6k/yr) — positive.
- The deal already cash-flows at list — no discount required.
- Meets the 1% rule at list price ($1k rent vs $50k).
- Cap rate 17.9% vs local median 4.8% in Springfield — top-decile yield for the area; either an underpriced asset or a hidden risk that comps aren't pricing in. Stress-test before assuming the spread holds.
Location & tenants
- Location reads 56/100 on livability (#1,108 in OH) — a working-class tenant base; expect higher turnover. Strengths: cost of living A+, housing A+; Watch: crime F, amenities F, commute F.
- Springfield City School District (urban): math 20% / reading 27% proficiency, ranked #616 of 656 in OH (top 94%) — low school quality limits family demand, transient renter base, plan for 1-2y turnover; 75% free/reduced lunch — lower-income household profile, screen leases tightly.
- Market conditions: 142 active listings in the ZIP; 1 comparable units currently listed for rent nearby; 232 units permitted in Clark County in 2024 (116 in 5+ unit buildings).
Forward outlook
- Local home prices are declining (-3.0%/yr); year-one equity from $345 of loan paydown is wiped out by about $1k of value loss. Plan a longer hold.
- Clark County population projected at -16% by 2050 — secular population decline; favor cash flow + early exit over multi-decade hold.
- At projected returns (-3.0% appreciation + 3.0% rent growth), your $14k cash investment doubles in ~3 years — after that, you're playing with house money.
Negotiation context
- Only 7 days on market — expect competitive offers; lowballing is unlikely to land.
- 2 sale attempts since 16y ago with the ask held roughly flat each time — persistent listings suggest the price (not the market) is what's stuck; bring a comps-based counter.
- Current owner paid $32k; list at $50k implies a 58% gain — meaningful room to come down on a strong offer.
Risks & watch-outs
- Watch-outs: built in 1909 — expect roof / HVAC / electrical / plumbing capex.
Questions for the listing agent
- Built in 1909 — when were the roof, HVAC, electrical panel, plumbing, and water heater last replaced?
- Is there a deadline driving the sale (1031 exchange, divorce, estate, relocation)? That informs how much negotiation room exists.
- Crime grade is F in this area — have there been break-ins, vandalism, or insurance claims at this property in the last 3 years? What carrier currently insures it and at what premium?
- What's the average days-on-market for RENTAL listings here right now (not sales)? A rising rental-DOM trend means longer vacancies and softer asking-rent achievability than the comps imply.
- What's the recent tenant-quality profile in this submarket — average credit score on applications, eviction rate, late-payment / NSF rate, and stable-employment percentage? A property-management company in the area should have these aggregated.
- How much new for-sale + rental construction is in the pipeline within 1–3 miles? Heavy new supply typically softens prices + rents 12–24 months out; constrained supply supports both.
Investment metrics
- 1% rule
- 2.10% ✓
- Cap rate
- 17.95%
- Cash-on-cash
- 41.62%
- DSCR
- 2.85
- GRM
- 4.0
CMA / ARV
- ARV (median comp)
- $150,720
- List price
- $49,900
- Delta
- -66.89%
- Verdict
- UNDERPRICED
- Comps
- 20 within 1.0 mi
Show comp detail 12 sales within ~0.75 mi
| Address | Dist | Beds/Ba | Sqft | Sold | Price | $/sf | Match |
|---|---|---|---|---|---|---|---|
| 1624 Highland Ave | 0.03mi | 3/2.0 (+1) | 1,536 (-4%) | 7mo | $122,000 | $79 | 80 |
| 1661 Prospect St | 0.19mi | 3/2.0 (+1) | 1,548 (-4%) | 3mo | $185,000 | $120 | 78 |
| 28 S Florence St | 0.17mi | 2/2.0 | 1,796 (+12%) | 8mo | $49,900 | $28 | 66 |
| 248 S Hubert Ave | 0.36mi | 3/1.0 (+1) | 1,504 (-6%) | 1mo | $65,000 | $43 | 62 |
| 2256 Hillside Ave | 0.61mi | 3/2.0 (+1) | 1,573 (-2%) | 7mo | $50,000 | $32 | 57 |
| 1823 Edwards Ave | 0.72mi | 3/2.0 (+1) | 1,648 (+2%) | 1mo | $153,000 | $93 | 57 |
| 372 S Douglas Ave | 0.57mi | 2/1.0 | 1,529 (-5%) | 8mo | $90,000 | $59 | 54 |
| 718 N Florence St | 0.40mi | 2/1.5 | 1,368 (-15%) | 6mo | $119,900 | $88 | 50 |
| 351 S Clairmont Ave | 0.62mi | 3/1.5 (+1) | 1,522 (-5%) | 8mo | $100,000 | $66 | 49 |
| 1568 Lagonda Ave | 0.59mi | 2/1.0 | 1,440 (-10%) | 7mo | $100,000 | $69 | 46 |
| 273 S Clairmont Ave | 0.56mi | 3/1.0 (+1) | 1,440 (-10%) | 3mo | $198,000 | $138 | 44 |
| 937 Avondale Ave | 0.51mi | 3/2.0 (+1) | 1,793 (+11%) | 10mo | $169,900 | $95 | 44 |
Match score weights: distance 35% · size 25% · config 20% · recency 20%. Top-matched comps best support the ARV.
Projected returns pro-forma
-3.0% appreciation · 3.0% rent growth · sell at horizon
- IRR
- 38.2%
- Equity multiple
- 2.63×
- Total profit
- $22,798
- Equity at exit
- $7,440
- IRR
- 44.7%
- Equity multiple
- 5.27×
- Total profit
- $59,663
- Equity at exit
- $4,314
Cash invested: $13,972 (down + closing). Projections, not guarantees.
Landlord ↔ Tenant lean methodology
- Overall (STATE)
- 73 Landlord-Friendly
- State Ohio
- 73 Landlord-Friendly · R+6
- County
- — inherits STATE
- City
- — inherits STATE
ZIP-level market 45503
- Active inventory
- 142
- Price-to-rent
- 4.0×
Monthly cashflow live
- Estimated rent
- $1,050 medium interval (Pro) →
- Mortgage (P&I)
- −$262
- Tax est. 1.5%
- −$62 /mo · $748/yr
- Insurance
- −$21
- HOA
- −$0
- Vacancy / Maint / Mgmt
- −$220
- Net cashflow
- $485
Break-even live
UW: 25.0% down · 7.5% · 30yr · 1.5% tax · 5.0% vac · 8.0% maint · 8.0% mgmt
Financing live
Cash to close
- Down payment
- $12,475
- Closing costs
- $1,497
- Reserves months
- —
- Total cash needed
- —
Loan-product check · same deal, 3 products live
Conventional
25% down · 7.5% · 30yr
- Down + closing
- —
- Monthly P&I
- —
- Monthly cashflow
- —
- DSCR
- —
- Eligible?
- —
Personal DTI + credit; lowest rate.
DSCR
20% down · 8.5% · 30yr
- Down + closing
- —
- Monthly P&I
- —
- Monthly cashflow
- —
- DSCR
- —
- Eligible?
- —
No personal income docs; deal must DSCR.
Hard money
10% down · 12.0% · 12mo
- Down + closing
- —
- Monthly P&I
- —
- Monthly cashflow
- —
- DSCR
- —
- Eligible?
- —
Short-term bridge; refi at stabilization.
Rent comps 1 comps
| Address | Beds | Baths | Sqft | Rent | $/sqft | DOM | Units | Dist |
|---|---|---|---|---|---|---|---|---|
| 127 N Belmont Ave Unit 1 Springfield, OH | 2.0 | 1.0 | 1052 | $1,050 | $1.00 | 1d | 1 | 0.29mi |
Listing history 5 events
-
2026-05-14status Pending 346-char remark
-
2026-05-07$49,900 Active 346-char remark
-
2010-08-20soldstatus $21,000 225-char remark
Show marketing remark (225 chars)
Asset #739504. Must have approval letter or proof of funds with offer. Addendum will be signed after acceptance. Seller's title company to hold earnest money. Property being sold in as-is condition. Agent, see Broker Remarks.
-
2010-07-08$23,500 225-char remark
Show marketing remark (225 chars)
Asset #739504. Must have approval letter or proof of funds with offer. Addendum will be signed after acceptance. Seller's title company to hold earnest money. Property being sold in as-is condition. Agent, see Broker Remarks.
-
2004-09-14soldstatus $51,000
ⓘ Source: listings_history table (triggers on properties + properties_extension) + one-shot
backfill from property_details.listing_events for pre-trigger history.
Climate risk First Street
- Flood 1/10 Low FEMA zone X (unshaded) · 0% chance over 30 yrs
- Wildfire 1/10 Low
- Heat 3/10 Moderate 7 d/yr ≥100°F today · 18 d/yr by 30 yrs out
- Wind 2/10 Low
- Air quality 3/10 Moderate 2 unhealthy d/yr today · 3 by 30 yrs out
Nearby sold comps map
Loading sold comps map…
Walkable amenities ~0.75 mi
Loading nearby amenities…
Taxation est. · year 1
- Rental income
- $12,600
- − Mortgage interest
- −$2,795
- − Property taxes
- −$748
- − Insurance
- −$250
- − Repairs & maintenance
- −$1,008
- − Management
- −$1,008
- − Depreciation
- −$1,452
- Taxable income
- $5,339
- Est. tax owed @ 24.0%
- −$1,281
- After-tax cash flow
- $4,534/yr
For passive investors: Depreciation is non-cash, so a rental often shows a tax loss while cash-flowing — sheltering income. Rental losses are passive: they offset passive income freely, and up to $25,000/yr can offset ordinary (W-2) income if you actively participate and your MAGI is under $100k (phasing out to $0 by $150k); unused losses carry forward. On sale, claimed depreciation is recaptured at up to 25%, and gains may owe capital-gains tax (a 1031 exchange can defer both). Figures are a year-1 estimate at your 24.0% rate — not tax advice; consult a CPA.
Schools (NCES district)
- District
- Springfield City School District
- NCES district ID
- 3904481
- Math proficiency
- 20% ▼ -16.00%
- Reading proficiency
- 27% ▼ -12.00%
- Median HH income
- $32,541
- Composite
- 19.12/100
- National rank
- #8834
- State rank
- #616 of 656 in OH
Livability — Springfield
- Score
- 56/100
- State rank
- #1108
- US rank
- #22551
Category grades
Schools grade is shown separately in the Schools card above.
Census & demographics
- Census place
- Springfield, OH
- County
- Clark · 134,280 people
- City population
- 33,261
- Metro
- Springfield, OH
- Population (ZIP)
- 32,673
- Household income
- $54,561
- Rent vs Own
- Severe rent burden
- 4.7
Population outlook (Clark County) Hauer SSP2
- Today (2025)
- 130,703 people
- By 2030
- 126,952 · -2.9%
- By 2040
- 118,344 · -9.5%
- By 2050
- 109,590 · -16.2%
- By 2075
- 89,464 · -31.6%
- By 2100
- 68,810 · -47.4%
Race, ethnicity, and origin ACS 2023
- Neighborhood character
- Predominantly White (84%)
- Race & ethnicity
- White 84% Black 9% Two or more races 5% Hispanic / Latino 2%
- Common ancestry
- Italian 2% Lithuanian 1% Slovak 1%
- Foreign-born
- 2% · Canada
- Languages at home
- 98% English-only · French/Haitian/Cajun 1% Spanish 1%
Political lean MEDSL · Clark
- 2024 margin
- Strong R (+29.5) · D 34.8% · R 64.3%
- 2008→2024 swing
- -27.0pp toward R · 2008: -2.5pp · 2024: -29.5pp
- All cycles
- 2024: R+29.5 2020: R+23.3 2016: R+19.5 2012: R+1.8 2008: R+2.5
Not yet ingested
- Civics
- —
Market trends
- HPI YoY
- ▼ -211.92%
- Current HPI
- 257.5694
- Rent YoY
- —
- Metro
- —
- State GDP YoY
- ▲ 1.98%
- F500 in state
- 48
Industry mix (Fortune 500 HQ in OH)
| Industry | F500 HQs | Revenue |
|---|---|---|
| Insurance | 3 | $145B |
|
||
| Industrial Machinery | 3 | $49B |
|
||
| Financial Services | 3 | $24B |
|
||
| Consumer Goods | 2 | $93B |
|
||
| Aerospace / Defense | 2 | $47B |
|
||
| Utilities | 2 | $33B |
|
||
Price history
-38.2% since first listed6 events — show timeline
- 2026-06-04 Sold (MLS) $31,500 WRIST
- 2026-05-14 Pending — WRIST
- 2026-05-07 Listed $49,900 WRIST
- 2010-08-20 Sold (MLS) $21,000 WRIST
- 2010-07-08 Listed $23,500 WRIST
- 2004-09-14 Sold (Public Records) $51,000 Public Records
Property tax history
+16.9%/yrLatest (2025): $5,614 · -53.8% YoY. Source: county tax records.
Cash-flow waterfall
monthlySold comps — $/sqft
last 12 mo · ≤1 miLoading sold comps…