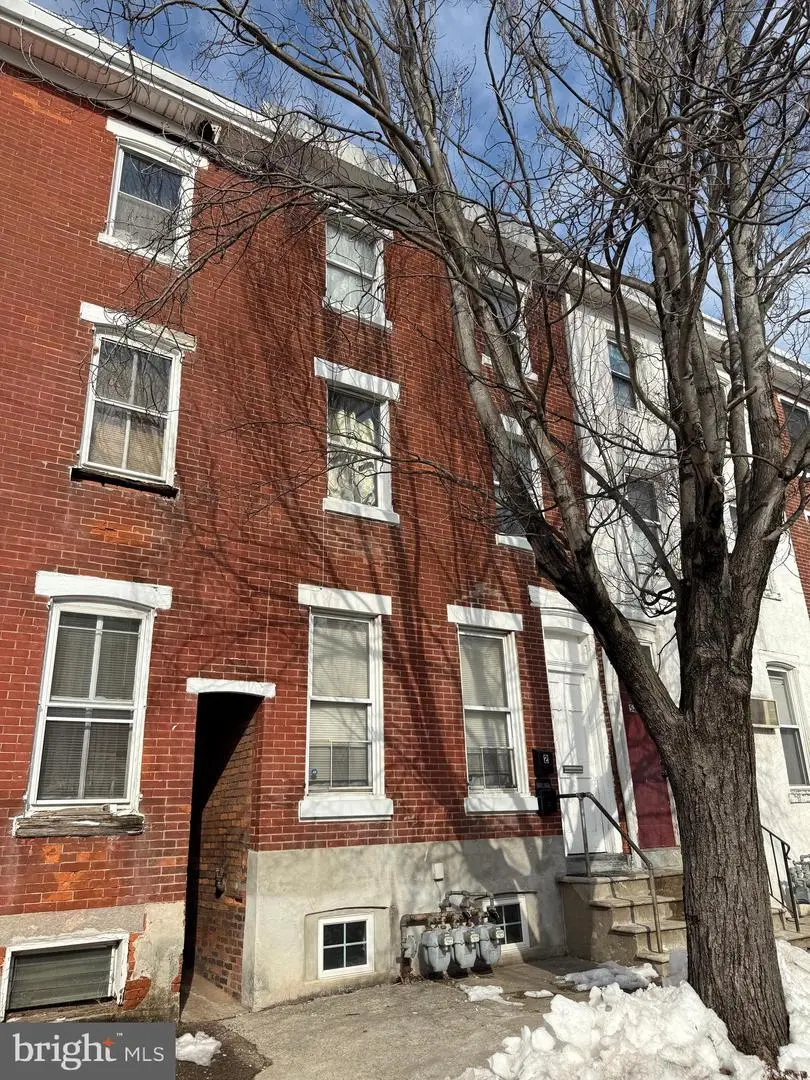
525 Kohn St · Norristown, PA
Flood risk 1/10 · Minimal
- FEMA flood zone
- X (unshaded)
- Chance of flooding over 30 yrs
- 0.0%
- Est. flood insurance / yr
- $473 – $860
Fire risk 1/10 · Minimal
- Est. fire insurance / yr
- $511 – $949
Heat risk 6/10 · Moderate
- Hot days now (above 102°F)
- 7 days/yr
- Hot days in 30 yrs
- 15 days/yr
Wind risk 6/10 · Moderate
- Chance of severe wind over 30 yrs
- 27.0%
Air-quality risk 4/10 · Minor
- Unhealthy air days now
- 3 days/yr
- Unhealthy air days in 30 yrs
- 5 days/yr
Risk factors via First Street. Map © Google.
Why this score? — see what drove the D grade
The composite is a weighted blend of 9 inputs, each scored 0–100. Each bar is that input's sub-score; the figure is the points it added to the 100-point composite (weight × sub-score).
- Cash flow +15.1/30.0
- ARV discount +9.6/15.0
- DSCR +4.6/10.0
- Livability +4.2/5.0
- 1% rule +3.4/10.0
- Rent growth +2.8/5.0
- Condition / age +2.5/5.0
- Schools +2.2/10.0
- Appreciation +0.0/10.0
$265,000
🖨 Deal sheet (PDF) 📄 Offer letter ✓ Due diligence
Listing remarks MLS
Great investment opportunity in the heart of Norristown, Pennsylvania! This well-maintained interior row duplex is ideally located just steps from public transportation, shopping, dining, and major commuter routes, making it highly attractive to both tenants and owner-occupants. The first-floor unit features a spacious one-bedroom layout with comfortable living space and functional flow. The second-floor unit offers two bedrooms with ample natural light and a practical layout ideal for long-term rental stability. Both units are in good condition, providing immediate income potential with minimal upfront improvements needed. Situated in a strong rental corridor with consistent demand, this property presents an excellent opportunity to build equity while generating reliable cash flow. Whether you're expanding your portfolio or looking to live in one unit and rent the other, this duplex delivers location, condition, and income potential all in one. Don’t miss your chance to own in one of Norristown’s most convenient and accessible neighborhoods!
Key facts
- Reliable cash flow
- 1,500 sq ft lot
- 2 parking spots
Tags
Neighborhood map
What this means for you Summary
Snapshot
- This is a 3-bed/2.0-bath townhouse listed at $265k.
Deal economics
- At list price, monthly cash flow is $88 ($1k/yr) — positive.
- The deal already cash-flows at list — no discount required.
- To meet the 1% rule (rent ≥ 1% of price), the offer needs to be $222k (16.4% below list).
- Recommended offer: $222k (16.4% below list) — sets the bar for 1% rule.
- Cap rate 6.7% vs local median 4.2% in Norristown — top-decile yield for the area; either an underpriced asset or a hidden risk that comps aren't pricing in. Stress-test before assuming the spread holds.
Location & tenants
- Location reads 84/100 on livability (#100 in PA, #720 nationally) — a professional / high-income tenant draw. Strengths: amenities A+, commute A+, cost of living A+; Watch: schools C-, crime D-.
- Norristown Area SD (suburban): math 18% / reading 31% proficiency, ranked #466 of 539 in PA (top 86%) — low school quality limits family demand, transient renter base, plan for 1-2y turnover; 70% free/reduced lunch — lower-income household profile, screen leases tightly.
- Market conditions: Rents rising (+1.3%/yr); 166 active listings in the ZIP; 28 comparable units currently listed for rent nearby; rentals at typical pace (median 26d on market — plan ~3-4 weeks tenant-placement turnaround); 1,936 units permitted in Montgomery County in 2024 (530 in 5+ unit buildings).
- This rent runs 38% of the median local income ($70k/yr) — at the standard rent-burdened threshold; future hikes will face affordability resistance.
Forward outlook
- Local home prices are declining (-3.0%/yr); year-one equity from $2k of loan paydown is wiped out by about $8k of value loss. Plan a longer hold.
- Montgomery County population projected at +5% by 2050 — modest demand growth; plan on rents tracking national, not racing it.
Negotiation context
- It's been on market 111 days — a 9% lower offer ($241k) is reasonable based on typical stale-listing flexibility.
- 5 sale attempts since 23y ago with the ask held roughly flat each time — persistent listings suggest the price (not the market) is what's stuck; bring a comps-based counter.
- Current owner paid $180k; 47% above their basis — modest negotiation headroom, anchor on the comps not their cost.
Risks & watch-outs
- Watch-outs: built in 1895 — expect roof / HVAC / electrical / plumbing capex.
- Climate carrying-cost: major wind risk, 27% chance of damaging wind over 30y; extreme-heat days projected 7→15/yr by 2055 (HVAC capex compounding) — expect insurance premiums to compound above CPI over the hold.
Questions for the listing agent
- It's been on market 111 days. Have you received any prior offers? Is the seller open to a 16% concession, seller financing, or rate buy-down credit?
- Built in 1895 — when were the roof, HVAC, electrical panel, plumbing, and water heater last replaced?
- Why hasn't it sold? Are there any deal-killer items the seller is aware of (foundation, flood, title, zoning, code violations)?
- Is there a deadline driving the sale (1031 exchange, divorce, estate, relocation)? That informs how much negotiation room exists.
- Crime grade is D in this area — have there been break-ins, vandalism, or insurance claims at this property in the last 3 years? What carrier currently insures it and at what premium?
- The area grade is low — what's the realistic commute time and amenity access for the typical tenant pool here? Any planned neighborhood developments (good or bad) we should know about?
- What's the average days-on-market for RENTAL listings here right now (not sales)? A rising rental-DOM trend means longer vacancies and softer asking-rent achievability than the comps imply.
- What's the recent tenant-quality profile in this submarket — average credit score on applications, eviction rate, late-payment / NSF rate, and stable-employment percentage? A property-management company in the area should have these aggregated.
- How much new for-sale + rental construction is in the pipeline within 1–3 miles? Heavy new supply typically softens prices + rents 12–24 months out; constrained supply supports both.
Investment metrics
- 1% rule
- 0.84% ✗
- Cap rate
- 6.69%
- Cash-on-cash
- 1.43%
- DSCR
- 1.06
- GRM
- 10.0
CMA / ARV
- ARV (median comp)
- $277,908
- List price
- $265,000
- Delta
- -4.64%
- Verdict
- FAIR
- Comps
- 20 within 1.0 mi
Show comp detail 12 sales within ~0.75 mi
| Address | Dist | Beds/Ba | Sqft | Sold | Price | $/sf | Match |
|---|---|---|---|---|---|---|---|
| 725 W Lafayette St | 0.23mi | 4/2.0 (+1) | 1,770 (-1%) | 5mo | $245,500 | $139 | 78 |
| 544 Stanbridge St | 0.14mi | 4/1.0 (+1) | 1,968 (+10%) | 7mo | $160,000 | $81 | 62 |
| 809 Stanbridge St | 0.41mi | 3/1.0 | 1,693 (-6%) | 6mo | $250,000 | $148 | 62 |
| 1117 W Main St Unit A | 0.39mi | 3/3.0 | 1,680 (-6%) | 8mo | $210,308 | $125 | 61 |
| 1120 Swede St | 0.68mi | 4/1.5 (+1) | 1,758 (-2%) | 2mo | $289,900 | $165 | 57 |
| 543 Corson St | 0.22mi | 4/1.0 (+1) | 1,554 (-13%) | 3mo | $175,000 | $113 | 56 |
| 218 Forrest Ave | 0.62mi | 4/1.0 (+1) | 1,700 (-5%) | 1mo | $234,900 | $138 | 53 |
| 208 E Chestnut St | 0.73mi | 4/2.0 (+1) | 1,824 (+2%) | 8mo | $152,000 | $83 | 52 |
| 1035 Willow St | 0.70mi | 4/1.0 (+1) | 1,832 (+2%) | 4mo | $180,000 | $98 | 52 |
| 725 Noble St | 0.39mi | 4/2.0 (+1) | 2,044 (+14%) | 5mo | $260,000 | $127 | 50 |
| 1025 Cherry St | 0.56mi | 4/1.5 (+1) | 1,614 (-10%) | 6mo | $166,000 | $103 | 46 |
| 1010 Buttonwood St | 0.64mi | 3/2.0 | 1,584 (-12%) | 6mo | $302,000 | $191 | 45 |
Match score weights: distance 35% · size 25% · config 20% · recency 20%. Top-matched comps best support the ARV.
Projected returns pro-forma
-3.0% appreciation · 1.29% rent growth · sell at horizon
- IRR
- -15.8%
- Equity multiple
- 0.45×
- Total profit
- $-41,131
- Equity at exit
- $39,512
- IRR
- -10.4%
- Equity multiple
- 0.41×
- Total profit
- $-43,713
- Equity at exit
- $22,912
Cash invested: $74,200 (down + closing). Projections, not guarantees.
Landlord ↔ Tenant lean methodology
- Overall (STATE)
- 62 Landlord-Friendly
- State Pennsylvania
- 62 Landlord-Friendly · EVEN
- County
- — inherits STATE
- City
- — inherits STATE
ZIP-level market 19401
- Rents YoY
- 1.3%
- Active inventory
- 166
- Price-to-rent
- 10.0×
Monthly cashflow live
- Estimated rent
- $2,215 high interval (Pro) →
- Mortgage (P&I)
- −$1,390
- Tax from tax record
- −$161 /mo · $1,936/yr
- Insurance
- −$110
- HOA
- −$0
- Vacancy / Maint / Mgmt
- −$465
- Net cashflow
- $88
Break-even live
Sensitivity live
| Price | -10% $238 | -5% $163 | +0% $88 | +5% $13 | +10% $-62 |
|---|---|---|---|---|---|
| Rent | -10% $-87 | -5% $1 | +0% $88 | +5% $176 | +10% $263 |
| Rate | -1.0pp $222 | -0.5pp $156 | base $88 | +0.5pp $20 | +1.0pp $-50 |
UW: 25.0% down · 7.5% · 30yr · 1.5% tax · 5.0% vac · 8.0% maint · 8.0% mgmt
Financing live
Cash to close
- Down payment
- $66,250
- Closing costs
- $7,950
- Reserves months
- —
- Total cash needed
- —
Loan-product check · same deal, 3 products live
Conventional
25% down · 7.5% · 30yr
- Down + closing
- —
- Monthly P&I
- —
- Monthly cashflow
- —
- DSCR
- —
- Eligible?
- —
Personal DTI + credit; lowest rate.
DSCR
20% down · 8.5% · 30yr
- Down + closing
- —
- Monthly P&I
- —
- Monthly cashflow
- —
- DSCR
- —
- Eligible?
- —
No personal income docs; deal must DSCR.
Hard money
10% down · 12.0% · 12mo
- Down + closing
- —
- Monthly P&I
- —
- Monthly cashflow
- —
- DSCR
- —
- Eligible?
- —
Short-term bridge; refi at stabilization.
Rent comps 28 comps
| Address | Beds | Baths | Sqft | Rent | $/sqft | DOM | Units | Dist |
|---|---|---|---|---|---|---|---|---|
| 542 Stanbridge St #1 Norristown, PA | 3.0 | 1.0 | 1400 | $2,200 | $1.57 | 26d | 1 | 0.13mi |
| 206 Chain St Norristown, PA | 3.0 | 1.0 | 1440 | $2,200 | $1.53 | 45d | 1 | 0.20mi |
| 119 Pearl St Unit 1 Norristown, PA | 3.0 | 1.5 | 1428 | $1,750 | $1.23 | 20d | 1 | 0.25mi |
| 119 Pearl St Norristown, PA | 3.0 | 2.0 | 1428 | $1,750 | $1.23 | 20d | 1 | 0.25mi |
| 712 George St Unit 2 Norristown, PA | 4.0 | 1.0 | 1485 | $2,500 | $1.68 | 45d | 1 | 0.27mi |
| 502 Buttonwood St Norristown, PA | 3.0 | 1.0 | 1330 | $2,100 | $1.58 | 26d | 1 | 0.29mi |
| 637 Hamilton St Norristown, PA | 2.0 | 1.0 | 2020 | $1,900 | $0.94 | 23d | 1 | 0.45mi |
| 126 W Elm St Norristown, PA | 4.0 | 1.5 | 1500 | $2,000 | $1.33 | 17d | 1 | 0.51mi |
| 1005 Stanbridge St #1 Norristown, PA | 2.0 | 1.0 | 1876 | $1,850 | $0.99 | 45d | 1 | 0.58mi |
| 534 Green St Norristown, PA | 4.0 | 1.0 | 1612 | $1,800 | $1.12 | 23d | 1 | 0.72mi |
| 1331 Astor St Unit 2 Norristown, PA | 2.0 | 1.0 | 1720 | $1,900 | $1.10 | 7d | 1 | 0.79mi |
| 613 Walnut St Norristown, PA | 3.0 | 1.0 | 1526 | $1,925 | $1.26 | 7d | 1 | 0.96mi |
| 221 E Wood St Norristown, PA | 4.0 | 1.0 | 1527 | $2,277 | $1.49 | 45d | 1 | 0.96mi |
| 211 E Poplar St Norristown, PA | 3.0 | 1.5 | 1414 | $2,350 | $1.66 | 45d | 1 | 1.00mi |
| 106 W 5th St Bridgeport, PA | 4.0 | 1.5 | 1662 | $2,850 | $1.71 | 26d | 1 | 1.13mi |
| 535 Sandy St Norristown, PA | 2.0 | 2.0 | 1476 | $1,699 | $1.15 | 22d | 1 | 1.14mi |
| 417 E Fornance St Norristown, PA | 2.0 | 1.0 | 1408 | $1,650 | $1.17 | 7d | 1 | 1.16mi |
| 3 Ford St Unit B Bridgeport, PA | 2.0 | 2.5 | 1292 | $2,550 | $1.97 | 23d | 1 | 1.24mi |
| 512 Dartmouth Dr King of Prussia, PA | 3.0 | 2.5 | 2091 | $3,000 | $1.43 | 6d | 1 | 1.28mi |
| 716 E Marshall St Apt 2 Norristown, PA | 3.0 | 1.0 | 1920 | $1,875 | $0.98 | 45d | 1 | 1.30mi |
| 172 Anderson Rd King of Prussia, PA | 3.0 | 3.0 | 2107 | $3,200 | $1.52 | 45d | 1 | 1.35mi |
| 224 Lilac St King of Prussia, PA | 3.0 | 2.5 | 1806 | $3,950 | $2.19 | 6d | 1 | 1.35mi |
| 1809 Chain St Norristown, PA | 4.0 | 2.0 | 1344 | $2,800 | $2.08 | 45d | 1 | 1.35mi |
| 344 Grove St Bridgeport, PA | 4.0 | 2.0 | 1484 | $2,895 | $1.95 | 45d | 1 | 1.38mi |
| 357 Aspen Way King of Prussia, PA | 3.0 | 2.5 | 2176 | $4,500 | $2.07 | 45d | 1 | 1.39mi |
| 669 N Henderson Rd King of Prussia, PA | 4.0 | 2.5 | 2228 | $3,500 | $1.57 | 0d | 1 | 1.42mi |
| 310 Prospect Ave Bridgeport, PA | 4.0 | 2.5 | 1920 | $3,100 | $1.61 | 45d | 1 | 1.44mi |
| 117 Hamlet Dr King of Prussia, PA | 3.0 | 2.5 | 1440 | $3,000 | $2.08 | 0d | 1 | 1.49mi |
Listing history 32 events
-
2026-06-21days on market $265,000 Active 111 DOM
-
2026-06-18days on market $265,000 Active 108 DOM
-
2026-06-17days on market $265,000 Active 107 DOM
-
2026-06-16days on market $265,000 Active 106 DOM
-
2026-06-15days on market $265,000 Active 105 DOM
-
2026-06-13days on market $265,000 Active 103 DOM
-
2026-06-13days on market $265,000 Active 102 DOM
-
2026-06-09days on market $265,000 Active 99 DOM
-
2026-06-08days on market $265,000 Active 98 DOM
-
2026-06-07days on market $265,000 Active 97 DOM
-
2026-06-04days on market $265,000 Active 94 DOM
-
2026-06-03days on market $265,000 Active 93 DOM
-
2026-06-02days on market $265,000 Active 92 DOM
-
2026-06-01days on market $265,000 Active 91 DOM
-
2026-05-31days on market $265,000 Active 90 DOM
-
2026-03-02$265,000 Active 1070-char remark
Show marketing remark (1070 chars)
Great investment opportunity in the heart of Norristown, Pennsylvania! This well-maintained interior row duplex is ideally located just steps from public transportation, shopping, dining, and major commuter routes, making it highly attractive to both tenants and owner-occupants. The first-floor unit features a spacious one-bedroom layout with comfortable living space and functional flow. The second-floor unit offers two bedrooms with ample natural light and a practical layout ideal for long-term rental stability. Both units are in good condition, providing immediate income potential with minimal upfront improvements needed. Situated in a strong rental corridor with consistent demand, this property presents an excellent opportunity to build equity while generating reliable cash flow. Whether you're expanding your portfolio or looking to live in one unit and rent the other, this duplex delivers location, condition, and income potential all in one. Don’t miss your chance to own in one of Norristown’s most convenient and accessible neighborhoods!
-
2025-07-17historical
-
2025-06-07$275,000 Active
-
2025-02-21soldstatus $180,000
-
2013-02-27historical
-
2012-07-10$85,000
-
2004-01-12soldstatus $83,000
-
2003-12-19soldstatus $83,000
-
2003-11-19historical
-
2003-09-24$83,000
-
2003-05-22soldstatus $74,400
-
2003-05-05soldstatus $74,400
-
2003-04-12historical
-
2003-04-10$74,400
-
2000-02-18soldstatus $25,000
-
2000-02-18soldstatus $53,300
-
1983-10-14soldstatus $28,000
ⓘ Source: listings_history table (triggers on properties + properties_extension) + one-shot
backfill from property_details.listing_events for pre-trigger history.
Tax reassessment forecast PA · Partial reset (capped growth)
- Current annual tax
- $1,936 · $161/mo
- Projected year-2 tax
- $3,062 · $255/mo
- Expected delta
- +$1,125/yr (+$94/mo · 58.1%)
ⓘ Screening estimate from a state-policy table — verify with the county assessor before closing.
Climate risk First Street
- Flood 1/10 Low FEMA zone X (unshaded) · 0% chance over 30 yrs
- Wildfire 1/10 Low
- Heat 6/10 Major 7 d/yr ≥102°F today · 15 d/yr by 30 yrs out
- Wind 6/10 Major 27% chance of damaging wind over 30 yrs
- Air quality 4/10 Moderate 3 unhealthy d/yr today · 5 by 30 yrs out
Nearby sold comps map
Loading sold comps map…
Walkable amenities ~0.75 mi
Loading nearby amenities…
Taxation est. · year 1
- Rental income
- $26,580
- − Mortgage interest
- −$14,844
- − Property taxes
- −$1,936
- − Insurance
- −$1,325
- − Repairs & maintenance
- −$2,126
- − Management
- −$2,126
- − Depreciation
- −$7,709
- Taxable loss
- −$3,487
- Est. tax savings @ 24.0%
- +$837
- After-tax cash flow
- $1,898/yr
For passive investors: Depreciation is non-cash, so a rental often shows a tax loss while cash-flowing — sheltering income. Rental losses are passive: they offset passive income freely, and up to $25,000/yr can offset ordinary (W-2) income if you actively participate and your MAGI is under $100k (phasing out to $0 by $150k); unused losses carry forward. On sale, claimed depreciation is recaptured at up to 25%, and gains may owe capital-gains tax (a 1031 exchange can defer both). Figures are a year-1 estimate at your 24.0% rate — not tax advice; consult a CPA.
Schools (NCES district)
- District
- Norristown Area SD
- NCES district ID
- 4216980
- Math proficiency
- 18% ▼ -11.00%
- Reading proficiency
- 31% ▼ -14.00%
- Median HH income
- $56,024
- Composite
- 22.17/100
- National rank
- #8166
- State rank
- #466 of 539 in PA
Livability — Norristown
- Score
- 84/100
- State rank
- #100
- US rank
- #720
Category grades
Schools grade is shown separately in the Schools card above.
Census & demographics
- Census place
- Norristown, PA
- County
- Montgomery County · 712,331 people
- City population
- 87,376
- Metro
- Philadelphia-Camden-Wilmington, PA-NJ-DE-MD
- Population (ZIP)
- 43,359
- Household income
- $69,908
- Rent vs Own
- Severe rent burden
- 2725.0
Population outlook (Montgomery County) Hauer SSP2
- Today (2025)
- 856,074 people
- By 2030
- 870,887 · +1.7%
- By 2040
- 891,195 · +4.1%
- By 2050
- 896,417 · +4.7%
- By 2075
- 903,212 · +5.5%
- By 2100
- 843,240 · -1.5%
Race, ethnicity, and origin ACS 2023
- Neighborhood character
- Highly diverse neighborhood (Simpson 0.72)
- Race & ethnicity
- White 33% Black 29% Hispanic / Latino 29% Two or more races 16% Asian 3% Native American 2%
- Hispanic origin (detail)
- Mexican 16% Puerto Rican 5% Dominican 2%
- Common ancestry
- Romanian 3% Slovak 1%
- Foreign-born
- 17% · Canada, Jamaica, South Korea
- Languages at home
- 71% English-only · Spanish 22% Other Indo-European 2% Russian/Polish/Slavic 1%
Political lean MEDSL · Montgomery
- 2024 margin
- Strong D (+22.8) · D 60.9% · R 38.1% · Other 1.1%
- 2008→2024 swing
- +2.0pp toward D · 2008: 20.8pp · 2024: 22.8pp
- All cycles
- 2024: D+22.8 2020: D+26.3 2016: D+21.1 2012: D+14.3 2008: D+20.8
Not yet ingested
- Civics
- —
Market trends
- HPI YoY
- ▼ -203.75%
- Current HPI
- 301.7748
- Rent YoY
- ▲ 1.29%
- Metro
- Philadelphia-Camden-Wilmington, PA-NJ-DE-MD
- State GDP YoY
- ▲ 1.68%
- F500 in state
- 34
Industry mix (Fortune 500 HQ in PA)
| Industry | F500 HQs | Revenue |
|---|---|---|
| Healthcare | 2 | $309B |
|
||
| Insurance | 2 | $27B |
|
||
| Telecommunications / Media | 1 | $124B |
|
||
| Industrial Distribution | 1 | $22B |
|
||
| Financial Services | 1 | $20B |
|
||
| Chemicals / Materials | 1 | $18B |
|
||
Price history
+846.4% since first listed17 events — show timeline
- 2026-03-02 Listed $265,000 BRIGHT MLS
- 2025-07-17 Listing Removed — BRIGHT MLS
- 2025-06-07 Listed $275,000 BRIGHT MLS
- 2025-02-21 Sold (Public Records) $180,000 Public Records
- 2013-02-27 Listing Removed — BRIGHT MLS
- 2012-07-10 Listed $85,000 BRIGHT MLS
- 2004-01-12 Sold (Public Records) $83,000 Public Records
- 2003-12-19 Sold (MLS) $83,000 BRIGHT MLS
- 2003-11-19 Listing Removed — BRIGHT MLS
- 2003-09-24 Listed $83,000 BRIGHT MLS
- 2003-05-22 Sold (Public Records) $74,400 Public Records
- 2003-05-05 Sold (MLS) $74,400 BRIGHT MLS
- 2003-04-12 Listing Removed — BRIGHT MLS
- 2003-04-10 Listed $74,400 BRIGHT MLS
- 2000-02-18 Sold (Public Records) $53,300 Public Records
- 2000-02-18 Sold (Public Records) $25,000 Public Records
- 1983-10-14 Sold (Public Records) $28,000 Public Records
Property tax history
+2.6%/yrLatest (2026): $1,936 · +2.3% YoY. Source: county tax records.
Cash-flow waterfall
monthlySold comps — $/sqft
last 12 mo · ≤1 miLoading sold comps…