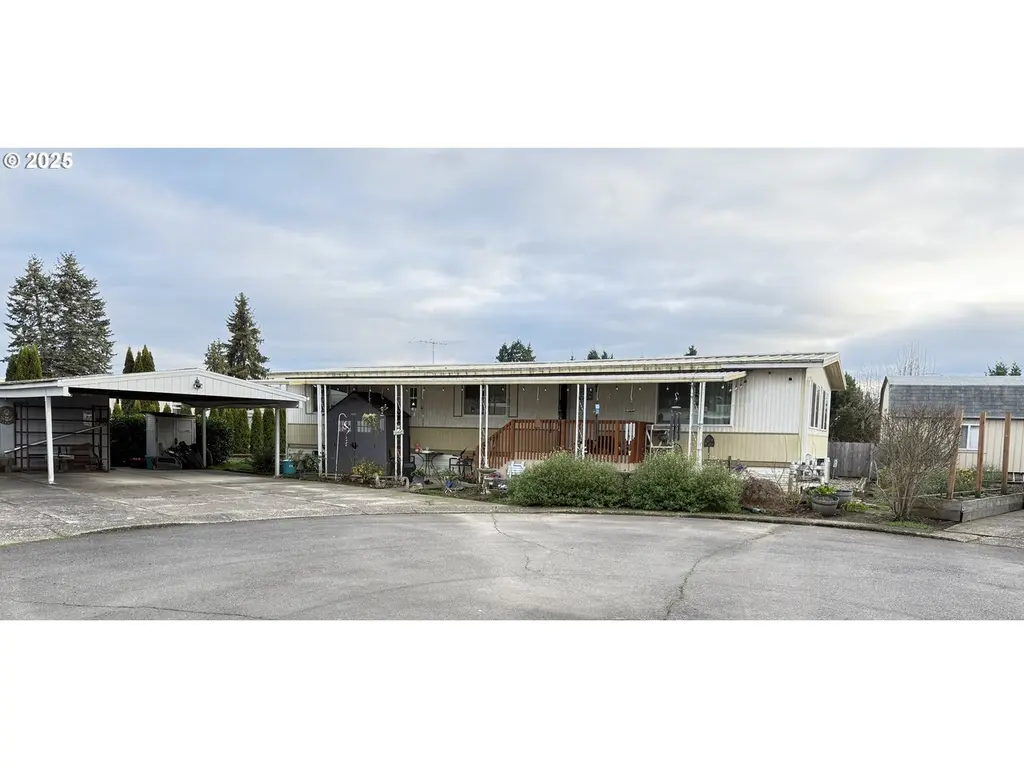
2232 42nd Ave SE #205 · Salem, OR
Flood risk 1/10 · Minimal
- FEMA flood zone
- X
- Chance of flooding over 30 yrs
- 0.0%
- Est. flood insurance / yr
- $435 – $905
Fire risk 1/10 · Minimal
- Est. fire insurance / yr
- $498 – $926
Heat risk 4/10 · Minor
- Hot days now (above threshold)
- 7 days/yr
- Hot days in 30 yrs
- 15 days/yr
Wind risk No data
- Chance of severe wind over 30 yrs
- —
Air-quality risk No data
- Unhealthy air days now
- —
- Unhealthy air days in 30 yrs
- —
Risk factors via First Street. Map © Google.
Why this score? — see what drove the C+ grade
The composite is a weighted blend of 9 inputs, each scored 0–100. Each bar is that input's sub-score; the figure is the points it added to the 100-point composite (weight × sub-score).
- Cash flow +30.0/30.0
- 1% rule +10.0/10.0
- DSCR +10.0/10.0
- Livability +4.0/5.0
- Schools +3.7/10.0
- Rent growth +3.2/5.0
- Condition / age +2.5/5.0
- ARV discount +0.0/15.0
- Appreciation +0.0/10.0
$84,500
🖨 Deal sheet 📄 Offer letter ✓ Due diligence
Listing remarks MLS
Tired of overpriced options that don’t deliver? This home stands out as one of the better values in the park—offering solid space (large fenced yard), practical layout (2 living spaces), and a comfortable setting without the inflated price tag. Ideal for buyers looking to control their monthly costs while still enjoying homeownership. Convenient location, easy living, and real value where it counts. If you’ve been waiting for the right one to make sense—this might be it. (55+ park)
Key facts
- Mini-splits
- Metal roof
- Vapor barrier
Tags
Neighborhood map
What this means for you Summary
Snapshot
- This is a 2-bed/2.0-bath manufactured listed at $84k.
Deal economics
- At list price, monthly cash flow is $823 ($10k/yr) — positive.
- The deal already cash-flows at list — no discount required.
- Meets the 1% rule at list price ($2k rent vs $84k).
- Recommended offer: $74k (12.0% below list) — sets the bar for market timing.
- Cap rate 18.0% vs local median 2.9% in Salem — top-decile yield for the area; either an underpriced asset or a hidden risk that comps aren't pricing in. Stress-test before assuming the spread holds.
Location & tenants
- Location reads 79/100 on livability (#59 in OR, #2,084 nationally) — a middle-class / working-renter tenant base. Strengths: amenities A+, commute A+, housing A+; Watch: schools D, crime F.
- Salem-Keizer SD 24J (urban): math 34% / reading 47% proficiency, ranked #103 of 183 in OR (top 56%) — families likely to look elsewhere, expect single-tenant / working-renter base with shorter leases.
- Market conditions: Rents rising (+2.6%/yr); 133 active listings in the ZIP; 19 comparable units currently listed for rent nearby; rentals leasing fast (median 14d on market — plan ~1-2 weeks tenant-placement turnaround); solid renter incomes; 1,591 units permitted in Marion County in 2024 (716 in 5+ unit buildings).
Forward outlook
- Local home prices are declining (-3.0%/yr); year-one equity from $584 of loan paydown is wiped out by about $3k of value loss. Plan a longer hold.
- Marion County population projected at +17% by 2050 — long-run rental-demand tailwind backs the buy-and-hold thesis.
- At projected returns (-3.0% appreciation + 2.6% rent growth), your $24k cash investment doubles in ~3 years — after that, you're playing with house money.
Negotiation context
- It's been on market 186 days — a 12% lower offer ($74k) is reasonable based on typical stale-listing flexibility.
- 4 sale attempts since 16y ago; this cycle's ask has dropped $4k (5%) from the opening price — seller is motivated, your offer sets the floor, not the list.
- Current owner paid $14k; list at $84k implies a 504% gain — meaningful room to come down on a strong offer.
Questions for the listing agent
- It's been on market 186 days. Have you received any prior offers? Is the seller open to a 12% concession, seller financing, or rate buy-down credit?
- Built in 1973 — when were the roof, HVAC, electrical panel, plumbing, and water heater last replaced?
- Why hasn't it sold? Are there any deal-killer items the seller is aware of (foundation, flood, title, zoning, code violations)?
- Is there a deadline driving the sale (1031 exchange, divorce, estate, relocation)? That informs how much negotiation room exists.
- Schools are D-rated, which usually means shorter tenancies and higher turnover. Who's the typical renter profile here, and what's been the actual vacancy rate?
- Crime grade is F in this area — have there been break-ins, vandalism, or insurance claims at this property in the last 3 years? What carrier currently insures it and at what premium?
- What's the average days-on-market for RENTAL listings here right now (not sales)? A rising rental-DOM trend means longer vacancies and softer asking-rent achievability than the comps imply.
- What's the recent tenant-quality profile in this submarket — average credit score on applications, eviction rate, late-payment / NSF rate, and stable-employment percentage? A property-management company in the area should have these aggregated.
- How much new for-sale + rental construction is in the pipeline within 1–3 miles? Heavy new supply typically softens prices + rents 12–24 months out; constrained supply supports both.
Investment metrics
- 1% rule
- 2.03% ✓
- Cap rate
- 17.98%
- Cash-on-cash
- 41.75%
- DSCR
- 2.86
- GRM
- 4.1
CMA / ARV
- ARV (median comp)
- $58,000
- List price
- $84,500
- Delta
- 45.69%
- Verdict
- OVERPRICED
- Comps
- 9 within 1.0 mi
Show comp detail 12 sales within ~0.75 mi
| Address | Dist | Beds/Ba | Sqft | Sold | Price | $/sf | Match |
|---|---|---|---|---|---|---|---|
| 2232 42nd Ave SE #704 | 0.00mi | 3/2.0 (+1) | 1,288 (-4%) | 1mo | $58,000 | $45 | 88 |
| 2232 42nd Ave SE #901 | 0.00mi | 2/2.0 | 1,344 (0%) | 21mo | $58,500 | $44 | 83 |
| 2232 42nd Ave SE #776 | 0.00mi | 3/2.0 (+1) | 1,296 (-4%) | 12mo | $160,000 | $123 | 79 |
| 2410 Lancaster Dr SE #962 | 0.20mi | 2/2.0 | 1,404 (+4%) | 8mo | $75,000 | $53 | 76 |
| 2410 Lancaster Dr SE #332 | 0.20mi | 2/2.0 | 1,426 (+6%) | 10mo | $98,000 | $69 | 72 |
| 2232 42nd Ave SE #792 | 0.00mi | 2/2.0 | 1,152 (-14%) | 10mo | $34,000 | $30 | 68 |
| 4497 Essex St SE | 0.20mi | 3/2.0 (+1) | 1,296 (-4%) | 14mo | $115,000 | $89 | 68 |
| 2232 42nd Ave SE #327 | 0.00mi | 3/2.0 (+1) | 1,440 (+7%) | 20mo | $55,000 | $38 | 67 |
| 2730 Oakland Lp SE | 0.30mi | 2/2.0 | 1,188 (-12%) | 6mo | $35,000 | $29 | 62 |
| 2410 Lancaster Dr #949 | 0.20mi | 3/3.0 (+1) | 1,296 (-4%) | 17mo | $81,000 | $63 | 62 |
| 2750 Oakland Loop SE | 0.28mi | 2/2.0 | 1,188 (-12%) | 9mo | $40,000 | $34 | 60 |
| 2232 42nd Ave SE #913 | 0.00mi | 2/2.0 | 1,152 (-14%) | 19mo | $50,000 | $43 | 60 |
Match score weights: distance 35% · size 25% · config 20% · recency 20%. Top-matched comps best support the ARV.
Projected returns pro-forma
-3.0% appreciation · 2.62% rent growth · sell at horizon
- IRR
- 38.0%
- Equity multiple
- 2.61×
- Total profit
- $38,077
- Equity at exit
- $12,599
- IRR
- 44.3%
- Equity multiple
- 5.14×
- Total profit
- $97,984
- Equity at exit
- $7,306
Cash invested: $23,660 (down + closing). Projections, not guarantees.
Landlord ↔ Tenant lean methodology
- Overall (STATE)
- 28 Tenant-Leaning
- State Oregon
- 28 Tenant-Leaning · D+6
- County
- — inherits STATE
- City
- — inherits STATE
ZIP-level market 97317
- Rents YoY
- 2.6%
- Active inventory
- 133
- Price-to-rent
- 4.1×
Monthly cashflow live
- Estimated rent
- $1,717 high interval (Pro) →
- Mortgage (P&I)
- −$443
- Tax from tax record
- −$55 /mo · $655/yr
- Insurance
- −$35
- HOA
- −$0
- Vacancy / Maint / Mgmt
- −$360
- Net cashflow
- $823
Break-even live
UW: 25.0% down · 7.5% · 30yr · 1.5% tax · 5.0% vac · 8.0% maint · 8.0% mgmt
Financing live
Cash to close
- Down payment
- $21,125
- Closing costs
- $2,535
- Reserves months
- —
- Total cash needed
- —
Loan-product check · same deal, 3 products live
Conventional
25% down · 7.5% · 30yr
- Down + closing
- —
- Monthly P&I
- —
- Monthly cashflow
- —
- DSCR
- —
- Eligible?
- —
Personal DTI + credit; lowest rate.
DSCR
20% down · 8.5% · 30yr
- Down + closing
- —
- Monthly P&I
- —
- Monthly cashflow
- —
- DSCR
- —
- Eligible?
- —
No personal income docs; deal must DSCR.
Hard money
10% down · 12.0% · 12mo
- Down + closing
- —
- Monthly P&I
- —
- Monthly cashflow
- —
- DSCR
- —
- Eligible?
- —
Short-term bridge; refi at stabilization.
Rent comps 19 comps
| Address | Beds | Baths | Sqft | Rent | $/sqft | DOM | Units | Dist |
|---|---|---|---|---|---|---|---|---|
| 4243 Campbell Dr SE Unit 4243 Salem, OR | 3.0 | 1.0 | 936 | $1,550 | $1.66 | 13d | 1 | 0.17mi |
| 1447 Connecticut St SE Salem, OR | 3.0 | 2.0 | 1258 | $2,675 | $2.13 | 43d | 1 | 0.31mi |
| 2728 Lancaster Dr SE Unit 2728-14 Salem, OR | 2.0 | 1.5 | 1000 | $1,195 | $1.20 | 43d | 1 | 0.32mi |
| 4665 Campbell Dr SE Salem, OR | 1.0–3.0 | 1.0–2.0 | 923 | $1,699 | $1.84 | 13d | 1 | 0.35mi |
| 1569 Whitaker Dr SE Salem, OR | 1.0–3.0 | 1.0–2.0 | 933 | $1,799 | $1.93 | 13d | 1 | 0.65mi |
| 1029 Raffon Ct SE Unit AR7171-3 Salem, OR | 2.0 | 1.5 | 927 | $1,700 | $1.83 | 23d | 1 | 0.65mi |
| 4976 Turquoise Ave SE Salem, OR | 2.0 | 2.0 | 918 | $1,495 | $1.63 | 13d | 5 | 0.71mi |
| 4776 Buffalo Dr SE Salem, OR | 3.0 | 1.0 | 1369 | $2,150 | $1.57 | 43d | 1 | 0.77mi |
| 4807 Chinook Ct SE Salem, OR | 3.0 | 1.5 | 1104 | $2,200 | $1.99 | 13d | 1 | 0.89mi |
| 5192 Caplinger Rd SE Salem, OR | 1.0–3.0 | 1.0–2.0 | 927 | $1,554 | $1.67 | 13d | 25 | 1.01mi |
| 3897 Meadowlawn Loop SE Salem, OR | 1.0–3.0 | 1.0–2.0 | 962 | $1,619 | $1.68 | 13d | 26 | 1.14mi |
| 3828 Bayonne Dr SE Salem, OR | 2.0 | 1.0 | 980 | $1,299 | $1.33 | 13d | 1 | 1.17mi |
| 3822 Bayonne Dr SE Salem, OR | 2.0 | 1.0 | 980 | $1,299 | $1.33 | 23d | 1 | 1.17mi |
| 4836 Tanglewood Ct SE Salem, OR | 3.0 | 2.0 | 1316 | $2,150 | $1.63 | 23d | 1 | 1.26mi |
| 4433 Mahrt Ave SE Unit 4435-201 Salem, OR | 2.0 | 2.0 | 888 | $1,525 | $1.72 | 23d | 1 | 1.27mi |
| 4433 Mahrt Ave SE Unit 4437-206 Salem, OR | 2.0 | 2.0 | 932 | $1,525 | $1.64 | 43d | 1 | 1.27mi |
| 143 Connecticut Ave SE Unit 145 Salem, OR | 3.0 | 1.0 | 1207 | $1,595 | $1.32 | 13d | 1 | 1.35mi |
| 178 Lancaster Dr SE Salem, OR | 2.0 | 2.0 | 952 | $1,495 | $1.57 | 13d | 1 | 1.42mi |
| 124 Stafford Ln NE Unit 124-203 Salem, OR | 3.0 | 2.0 | 1052 | $1,595 | $1.52 | 43d | 1 | 1.43mi |
Listing history 26 events
-
2026-06-18days on market $84,500 Active 186 DOM
-
2026-06-17days on market $84,500 Active 185 DOM
-
2026-06-16days on market $84,500 Active 184 DOM
-
2026-06-15days on market $84,500 Active 183 DOM
-
2026-06-14days on market $84,500 Active 181 DOM
-
2026-06-10days on market $84,500 Active 178 DOM
-
2026-06-09days on market $84,500 Active 177 DOM
-
2026-06-08days on market $84,500 Active 176 DOM
-
2026-06-07days on market $84,500 Active 175 DOM
-
2026-06-03days on market $84,500 Active 171 DOM
-
2026-06-02days on market $84,500 Active 170 DOM
-
2026-06-01days on market $84,500 Active 169 DOM
-
2026-05-31days on market $84,500 Active 168 DOM
-
2026-05-30days on market $84,500 Active 167 DOM
-
2026-02-25price $84,500 510-char remark
Show marketing remark (510 chars)
Tired of overpriced options that don’t deliver? This home stands out as one of the better values in the park—offering solid space (large fenced yard), practical layout (2 living spaces), and a comfortable setting without the inflated price tag. Ideal for buyers looking to control their monthly costs while still enjoying homeownership. Convenient location, easy living, and real value where it counts. If you’ve been waiting for the right one to make sense—this might be it. (55+ park)
-
2026-02-24price $84,500 557-char remark
Show marketing remark (557 chars)
This home has the upgrades people actually want, not the fluff. New LVP flooring, metal roof, updated windows, kitchen improvements, & mini-splits at both ends for efficient comfort. Recently leveled w/a renewed vapor barrier & newer water heater—so the big-ticket updates are already handled. The primary bedroom is surprisingly spacious, & the fully fenced yard is dog-ready. Bonus: an exterior barn for storage, raised garden beds, & a direct path to the pool. A well-cared for home w/smart updates & long term value. (55+ park)
-
2025-12-14$89,000 Active 557-char remark
Show marketing remark (557 chars)
This home has the upgrades people actually want, not the fluff. New LVP flooring, metal roof, updated windows, kitchen improvements, & mini-splits at both ends for efficient comfort. Recently leveled w/a renewed vapor barrier & newer water heater—so the big-ticket updates are already handled. The primary bedroom is surprisingly spacious, & the fully fenced yard is dog-ready. Bonus: an exterior barn for storage, raised garden beds, & a direct path to the pool. A well-cared for home w/smart updates & long term value. (55+ park)
-
2025-12-12$89,000 Active 510-char remark
Show marketing remark (510 chars)
Tired of overpriced options that don’t deliver? This home stands out as one of the better values in the park—offering solid space (large fenced yard), practical layout (2 living spaces), and a comfortable setting without the inflated price tag. Ideal for buyers looking to control their monthly costs while still enjoying homeownership. Convenient location, easy living, and real value where it counts. If you’ve been waiting for the right one to make sense—this might be it. (55+ park)
-
2011-04-26soldstatus $14,000 Sold
-
2011-04-25historical
-
2011-02-22price $15,500
-
2011-01-03status Active
-
2010-12-25historical
-
2010-11-11price $18,000
-
2010-09-28$21,500 Active
-
1984-04-01soldstatus $26,500
ⓘ Source: listings_history table (triggers on properties + properties_extension) + one-shot
backfill from property_details.listing_events for pre-trigger history.
Tax reassessment forecast OR · Resets to sale price
- Current annual tax
- $655 · $55/mo
- Projected year-2 tax
- $820 · $68/mo
- Expected delta
- +$165/yr (+$14/mo · 25.2%)
ⓘ Screening estimate from a state-policy table — verify with the county assessor before closing.
Climate risk First Street
- Flood 1/10 Low FEMA zone X · 0% chance over 30 yrs
- Wildfire 1/10 Low
- Heat 4/10 Moderate
Nearby sold comps map
Loading sold comps map…
Walkable amenities ~0.75 mi
Loading nearby amenities…
Taxation est. · year 1
- Rental income
- $20,599
- − Mortgage interest
- −$4,733
- − Property taxes
- −$655
- − Insurance
- −$422
- − Repairs & maintenance
- −$1,648
- − Management
- −$1,648
- − Depreciation
- −$2,458
- Taxable income
- $9,034
- Est. tax owed @ 24.0%
- −$2,168
- After-tax cash flow
- $7,710/yr
For passive investors: Depreciation is non-cash, so a rental often shows a tax loss while cash-flowing — sheltering income. Rental losses are passive: they offset passive income freely, and up to $25,000/yr can offset ordinary (W-2) income if you actively participate and your MAGI is under $100k (phasing out to $0 by $150k); unused losses carry forward. On sale, claimed depreciation is recaptured at up to 25%, and gains may owe capital-gains tax (a 1031 exchange can defer both). Figures are a year-1 estimate at your 24.0% rate — not tax advice; consult a CPA.
Schools (NCES district)
- District
- Salem-Keizer SD 24J
- NCES district ID
- 4110820
- Math proficiency
- 34% ▼ -1.00%
- Reading proficiency
- 47% ▼ -2.00%
- Median HH income
- $48,632
- Composite
- 37.16/100
- National rank
- #9017
- State rank
- #103 of 183 in OR
Livability — Salem
- Score
- 79/100
- State rank
- #59
- US rank
- #2084
Category grades
Schools grade is shown separately in the Schools card above.
Census & demographics
- Census place
- Salem, OR
- County
- Marion County · 258,219 people
- City population
- 193,601
- Metro
- Salem, OR
- Population (ZIP)
- 25,966
- Household income
- $84,393
- Rent vs Own
- Severe rent burden
- 395.0
Population outlook (Marion County) Hauer SSP2
- Today (2025)
- 360,940 people
- By 2030
- 375,178 · +3.9%
- By 2040
- 400,914 · +11.1%
- By 2050
- 422,187 · +17.0%
- By 2075
- 460,305 · +27.5%
- By 2100
- 464,025 · +28.6%
Race, ethnicity, and origin ACS 2023
- Neighborhood character
- Majority White (61%)
- Race & ethnicity
- White 61% Hispanic / Latino 28% Two or more races 17% Asian 2% Pacific Islander 2%
- Hispanic origin (detail)
- Mexican 26%
- Common ancestry
- Portuguese 4% Italian 2% Lithuanian 2%
- Foreign-born
- 11% · Canada, Vietnam
- Languages at home
- 74% English-only · Spanish 22% Russian/Polish/Slavic 2% German/W. Germanic 1%
Political lean MEDSL · Marion
- 2024 margin
- Toss-up / Even · D 47.5% · R 49.5% · Other 3.0%
- 2008→2024 swing
- -4.2pp toward R · 2008: 2.2pp · 2024: -2.0pp
- All cycles
- 2024: R+2.0 2020: D+1.1 2016: R+5.0 2012: R+3.5 2008: D+2.2
Not yet ingested
- Civics
- —
Market trends
- HPI YoY
- ▼ -471.73%
- Current HPI
- 307.3264
- Rent YoY
- ▲ 2.62%
- Metro
- Salem, OR
- State GDP YoY
- ▲ 2.05%
- F500 in state
- 2
Industry mix (Fortune 500 HQ in OR)
| Industry | F500 HQs | Revenue |
|---|---|---|
| Consumer Goods | 1 | $51B |
|
||
Price history
+218.9% since first listed12 events — show timeline
- 2026-02-25 Price Changed $84,500 WVMLS
- 2026-02-24 Price Changed $84,500 RMLS
- 2025-12-14 Listed $89,000 RMLS
- 2025-12-12 Listed $89,000 WVMLS
- 2011-04-26 Sold (MLS) $14,000 WVMLS
- 2011-04-25 Listing Removed — WVMLS
- 2011-02-22 Price Changed $15,500 WVMLS
- 2011-01-03 Relisted — WVMLS
- 2010-12-25 Listing Removed — WVMLS
- 2010-11-11 Price Changed $18,000 WVMLS
- 2010-09-28 Listed $21,500 WVMLS
- 1984-04-01 Sold (Public Records) $26,500 Public Records
Property tax history
+3.8%/yrLatest (2025): $655 · +7.6% YoY. Source: county tax records.
Cash-flow waterfall
monthlySold comps — $/sqft
last 12 mo · ≤1 miLoading sold comps…