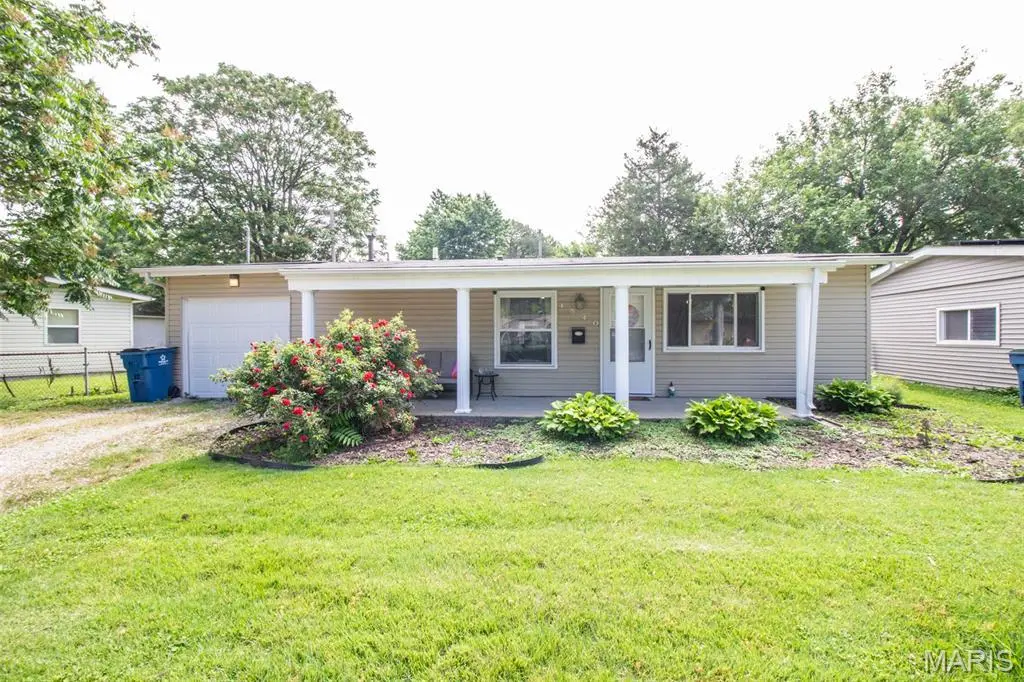
4540 Walter Ave · Granite City, IL
Flood risk 1/10 · Minimal
- FEMA flood zone
- X
- Chance of flooding over 30 yrs
- 0.0%
- Est. flood insurance / yr
- $507 – $1,088
Fire risk 1/10 · Minimal
- Est. fire insurance / yr
- $804 – $1,492
Heat risk 5/10 · Moderate
- Hot days now (above 107°F)
- 7 days/yr
- Hot days in 30 yrs
- 21 days/yr
Wind risk 2/10 · Minimal
- Chance of severe wind over 30 yrs
- 1.0%
Air-quality risk 4/10 · Minor
- Unhealthy air days now
- 4 days/yr
- Unhealthy air days in 30 yrs
- 5 days/yr
Risk factors via First Street. Map © Google.
Why this score? — see what drove the C+ grade
The composite is a weighted blend of 9 inputs, each scored 0–100. Each bar is that input's sub-score; the figure is the points it added to the 100-point composite (weight × sub-score).
- Cash flow +24.9/30.0
- ARV discount +12.0/15.0
- DSCR +8.1/10.0
- 1% rule +6.2/10.0
- Livability +3.2/5.0
- Rent growth +2.9/5.0
- Condition / age +2.5/5.0
- Schools +0.9/10.0
- Appreciation +0.0/10.0
$94,900
🖨 Deal sheet 📄 Offer letter ✓ Due diligence
Listing remarks MLS
Cheaper than renting!! Come take a look at this updated 2 bedroom one story home. Covered front porch to greet you. Completely remodeled in 2012 - including furnace, AC, roof, updated electrical and plumbing. Gutters new in (2018). Spacious living room, eat in kitchen with appliances staying and updated bathroom. Wood-like ceramic tile flooring in bathroom. Great backyard with storage shed. Perfect home for a first time home buyer or if you're looking to downsize, come see it today. Before making an offer on any property, buyer should independently verify all MLS data, which is derived from various sources and not warranted as accurate.
Key facts
- 5,806 sq ft lot
- Garage
- Built 1958
Property features AI
Finance
- Financial info: Lease not considered
Exterior
- Parking: Attached garage (1 car)
- Utilities: Public water; Public sewer; Electric service by Ameren
- Home design: Single family residence; One level
- Construction: Vinyl siding
- Exterior features: Front porch; Patio; Level lot
Interior
- Kitchen: Dishwasher; Microwave
- Bedrooms: 2 bedrooms on the main level
- Bathrooms: 1 full bathroom (main level)
- Heating & cooling: Forced air heating; Central air conditioning
- Interior features: Dishwasher; Microwave; Central air; Forced air heating
Neighborhood map
What this means for you Summary
Snapshot
- This is a 2-bed/1.0-bath single-family listed at $95k.
Deal economics
- At list price, monthly cash flow is $205 ($2k/yr) — positive.
- The deal already cash-flows at list — no discount required.
- Meets the 1% rule at list price ($1k rent vs $95k).
- Recommended offer: $93k (1.5% below list) — sets the bar for market timing.
- Cap rate 8.9% vs local median 7.0% in Granite City — meaningfully above typical; check what's discounted (condition, days-on-market, listing class) to confirm the premium yield is real.
Location & tenants
- Location reads 65/100 on livability (#623 in IL) — a middle-class / working-renter tenant base. Strengths: cost of living A+, housing A+; Watch: crime F, amenities F, commute F.
- Granite City CUSD 9 (suburban): math 9% / reading 11% proficiency, ranked #570 of 620 in IL (top 92%) — low school quality limits family demand, transient renter base, plan for 1-2y turnover.
- Zoned schools: Granite City High School (math 10% / reading 12%, grade F, #522 of 693 statewide, top 76%, 1,805 students, 0% FRL) — zoned schools average 0% FRL vs 59% district-wide (59 pts lower); this property's tenant base skews higher-income than the district average.
- Market conditions: Rents rising (+1.7%/yr); 194 active listings in the ZIP; 2 comparable units currently listed for rent nearby; 336 units permitted in Madison County in 2024 (0 in 5+ unit buildings).
Forward outlook
- Local home prices are declining (-3.0%/yr); year-one equity from $656 of loan paydown is wiped out by about $3k of value loss. Plan a longer hold.
- Madison County population projected at -18% by 2050 — secular population decline; favor cash flow + early exit over multi-decade hold.
Negotiation context
- It's been on market 18 days — a 2% lower offer ($93k) is reasonable based on typical stale-listing flexibility.
- 3 sale attempts since 14y ago; this cycle's ask is 65% above the opening price — seller raised mid-cycle; expect resistance to lowballs.
- Current owner paid $60k; list at $95k implies a 58% gain — meaningful room to come down on a strong offer.
Risks & watch-outs
- Watch-outs: built in 1958 — expect roof / HVAC / electrical / plumbing capex.
- Climate carrying-cost: extreme-heat days projected 7→21/yr by 2055 (HVAC capex compounding) — expect insurance premiums to compound above CPI over the hold.
Questions for the listing agent
- Built in 1958 — when were the roof, HVAC, electrical panel, plumbing, and water heater last replaced?
- Is there a deadline driving the sale (1031 exchange, divorce, estate, relocation)? That informs how much negotiation room exists.
- Schools are F-rated, which usually means shorter tenancies and higher turnover. Who's the typical renter profile here, and what's been the actual vacancy rate?
- Crime grade is F in this area — have there been break-ins, vandalism, or insurance claims at this property in the last 3 years? What carrier currently insures it and at what premium?
- What's the average days-on-market for RENTAL listings here right now (not sales)? A rising rental-DOM trend means longer vacancies and softer asking-rent achievability than the comps imply.
- What's the recent tenant-quality profile in this submarket — average credit score on applications, eviction rate, late-payment / NSF rate, and stable-employment percentage? A property-management company in the area should have these aggregated.
- How much new for-sale + rental construction is in the pipeline within 1–3 miles? Heavy new supply typically softens prices + rents 12–24 months out; constrained supply supports both.
Investment metrics
- 1% rule
- 1.12% ✓
- Cap rate
- 8.88%
- Cash-on-cash
- 9.24%
- DSCR
- 1.41
- GRM
- 7.4
CMA / ARV
- ARV (on-the-fly)
- $105,336
- Comps found
- 12
Show comp detail 12 sales within ~0.75 mi
| Address | Dist | Beds/Ba | Sqft | Sold | Price | $/sf | Match |
|---|---|---|---|---|---|---|---|
| 1620 Ferguson Ave | 0.26mi | 2/1.0 | 786 (-1%) | 5mo | $69,900 | $89 | 82 |
| 2117 Lynch Ave | 0.25mi | 2/1.0 | 748 (-6%) | 2mo | $49,500 | $66 | 77 |
| 4536 Walter Ave | 0.01mi | 3/1.0 (+1) | 825 (+4%) | 12mo | $119,900 | $145 | 77 |
| 1629 Moro Ave | 0.50mi | 2/1.0 | 792 (0%) | 5mo | $119,000 | $150 | 73 |
| 1624 Sycamore St | 0.19mi | 2/1.0 | 750 (-5%) | 14mo | $99,999 | $133 | 71 |
| 2152 Bern Ave | 0.07mi | 3/1.0 (+1) | 888 (+12%) | 10mo | $119,900 | $135 | 64 |
| 1628 Minerva Ave | 0.15mi | 2/1.0 | 884 (+12%) | 14mo | $100,000 | $113 | 61 |
| 1709 Moro Ave | 0.48mi | 2/1.0 | 713 (-10%) | 1mo | $129,900 | $182 | 60 |
| 1713 Moro Ave | 0.48mi | 3/1.0 (+1) | 858 (+8%) | 0mo | $30,000 | $35 | 59 |
| 2145 Miracle Ave | 0.14mi | 3/2.0 (+1) | 900 (+14%) | 10mo | $105,000 | $117 | 54 |
| 1635 Lindell Blvd | 0.71mi | 2/1.0 | 896 (+13%) | 8mo | $110,000 | $123 | 38 |
| 2004 Cottage Ave | 0.73mi | 2/2.0 | 875 (+10%) | 10mo | $138,900 | $159 | 36 |
Match score weights: distance 35% · size 25% · config 20% · recency 20%. Top-matched comps best support the ARV.
Projected returns pro-forma
-3.0% appreciation · 1.67% rent growth · sell at horizon
- IRR
- -3.8%
- Equity multiple
- 0.86×
- Total profit
- $-3,751
- Equity at exit
- $14,150
- IRR
- 4.3%
- Equity multiple
- 1.30×
- Total profit
- $7,912
- Equity at exit
- $8,205
Cash invested: $26,572 (down + closing). Projections, not guarantees.
Landlord ↔ Tenant lean methodology
- Overall (STATE)
- 43 Moderately Tenant-Leaning
- State Illinois
- 43 Moderately Tenant-Leaning · D+7
- County
- — inherits STATE
- City
- — inherits STATE
ZIP-level market 62040
- Home prices YoY
- -21.8%
- Rents YoY
- 1.7%
- Active inventory
- 194
- Price-to-rent
- 7.4×
Monthly cashflow live
- Estimated rent
- $1,064 medium interval (Pro) →
- Mortgage (P&I)
- −$498
- Tax from tax record
- −$98 /mo · $1,181/yr
- Insurance
- −$40
- HOA
- −$0
- Vacancy / Maint / Mgmt
- −$223
- Net cashflow
- $205
Break-even live
UW: 25.0% down · 7.5% · 30yr · 1.5% tax · 5.0% vac · 8.0% maint · 8.0% mgmt
Financing live
Cash to close
- Down payment
- $23,725
- Closing costs
- $2,847
- Reserves months
- —
- Total cash needed
- —
Loan-product check · same deal, 3 products live
Conventional
25% down · 7.5% · 30yr
- Down + closing
- —
- Monthly P&I
- —
- Monthly cashflow
- —
- DSCR
- —
- Eligible?
- —
Personal DTI + credit; lowest rate.
DSCR
20% down · 8.5% · 30yr
- Down + closing
- —
- Monthly P&I
- —
- Monthly cashflow
- —
- DSCR
- —
- Eligible?
- —
No personal income docs; deal must DSCR.
Hard money
10% down · 12.0% · 12mo
- Down + closing
- —
- Monthly P&I
- —
- Monthly cashflow
- —
- DSCR
- —
- Eligible?
- —
Short-term bridge; refi at stabilization.
Rent comps 2 comps
| Address | Beds | Baths | Sqft | Rent | $/sqft | DOM | Units | Dist |
|---|---|---|---|---|---|---|---|---|
| 4404 Wabash Ave Granite City, IL | 2.0 | 1.0 | 864 | $1,025 | $1.19 | 2d | 1 | 0.11mi |
| 303 Wilson Park Ln Granite City, IL | 3.0 | 1.0 | 900 | $1,200 | $1.33 | 7d | 1 | 1.46mi |
Listing history 16 events
-
2026-06-18days on market $94,900 Active 18 DOM
-
2026-06-17days on market $94,900 Active 17 DOM
-
2026-06-16days on market $94,900 Active 16 DOM
-
2026-06-15price $94,900 Active 15 DOM
-
2026-06-15days on market $99,900 Active 15 DOM
-
2026-06-13days on market $99,900 Active 13 DOM
-
2026-06-13days on market $99,900 Active 12 DOM
-
2026-06-09days on market $99,900 Active 9 DOM
-
2026-06-08days on market $99,900 Active 8 DOM
-
2026-06-07days on market $99,900 Active 7 DOM
-
2026-06-05days on market $99,900 Active 4 DOM
-
2026-06-03days on market $99,900 Active 3 DOM
-
2026-06-02days on market $99,900 Active 2 DOM
-
2026-06-01status $99,900 Active 1 DOM
-
2026-06-01remarks 583-char remark
-
2026-06-01$99,900 Coming Soon 1 DOM
ⓘ Source: listings_history table (triggers on properties + properties_extension) + one-shot
backfill from property_details.listing_events for pre-trigger history.
Tax reassessment forecast IL · Partial reset (capped growth)
- Current annual tax
- $1,181 · $98/mo
- Projected year-2 tax
- $1,668 · $139/mo
- Expected delta
- +$486/yr (+$41/mo · 41.2%)
ⓘ Screening estimate from a state-policy table — verify with the county assessor before closing.
Climate risk First Street
- Flood 1/10 Low FEMA zone X · 0% chance over 30 yrs
- Wildfire 1/10 Low
- Heat 5/10 Major 7 d/yr ≥107°F today · 21 d/yr by 30 yrs out
- Wind 2/10 Low 100% chance of damaging wind over 30 yrs
- Air quality 4/10 Moderate 4 unhealthy d/yr today · 5 by 30 yrs out
Nearby sold comps map
Loading sold comps map…
Walkable amenities ~0.75 mi
Loading nearby amenities…
Taxation est. · year 1
- Rental income
- $12,762
- − Mortgage interest
- −$5,316
- − Property taxes
- −$1,181
- − Insurance
- −$474
- − Repairs & maintenance
- −$1,021
- − Management
- −$1,021
- − Depreciation
- −$2,761
- Taxable income
- $988
- Est. tax owed @ 24.0%
- −$237
- After-tax cash flow
- $2,217/yr
For passive investors: Depreciation is non-cash, so a rental often shows a tax loss while cash-flowing — sheltering income. Rental losses are passive: they offset passive income freely, and up to $25,000/yr can offset ordinary (W-2) income if you actively participate and your MAGI is under $100k (phasing out to $0 by $150k); unused losses carry forward. On sale, claimed depreciation is recaptured at up to 25%, and gains may owe capital-gains tax (a 1031 exchange can defer both). Figures are a year-1 estimate at your 24.0% rate — not tax advice; consult a CPA.
Schools (NCES district)
- District
- Granite City CUSD 9
- NCES district ID
- 1717280
- Math proficiency
- 9% ▼ -4.00%
- Reading proficiency
- 11% ▼ -7.00%
- Median HH income
- $45,082
- Composite
- 9.15/100
- National rank
- #9864
- State rank
- #570 of 620 in IL
Livability — Granite City
- Score
- 65/100
- State rank
- #623
- US rank
- #12751
Category grades
Schools grade is shown separately in the Schools card above.
Census & demographics
- County
- Madison County · 189,064 people
- Metro
- St. Louis, MO-IL
- Population (ZIP)
- 40,404
- Household income
- $60,031
- Rent vs Own
- Severe rent burden
- 923.0
Population outlook (Madison County) Hauer SSP2
- Today (2025)
- 258,371 people
- By 2030
- 251,523 · -2.7%
- By 2040
- 233,640 · -9.6%
- By 2050
- 213,042 · -17.5%
- By 2075
- 165,255 · -36.0%
- By 2100
- 123,953 · -52.0%
Race, ethnicity, and origin ACS 2023
- Neighborhood character
- Predominantly White (76%)
- Race & ethnicity
- White 76% Hispanic / Latino 9% Black 9% Two or more races 7% Asian 1%
- Hispanic origin (detail)
- Mexican 7%
- Common ancestry
- Romanian 2% Lithuanian 2% Serbian 2%
- Foreign-born
- 3% · Canada, Vietnam
- Languages at home
- 93% English-only · Spanish 5%
Political lean MEDSL · Madison
- 2024 margin
- R (+13.3) · D 42.5% · R 55.8% · Other 1.8%
- 2008→2024 swing
- -22.5pp toward R · 2008: 9.2pp · 2024: -13.3pp
- All cycles
- 2024: R+13.3 2020: R+13.2 2016: R+15.6 2012: R+1.4 2008: D+9.2
Not yet ingested
- Civics
- —
Market trends
- HPI YoY
- ▼ -56.88%
- Current HPI
- 204.4612
- Rent YoY
- ▲ 1.67%
- Metro
- St. Louis, MO-IL
- State GDP YoY
- ▲ 1.59%
- F500 in state
- 60
Industry mix (Fortune 500 HQ in IL)
| Industry | F500 HQs | Revenue |
|---|---|---|
| Insurance | 4 | $201B |
|
||
| Consumer Goods | 4 | $87B |
|
||
| Industrial Machinery | 3 | $64B |
|
||
| Healthcare | 2 | $55B |
|
||
| Retail / Pharmacy | 1 | $148B |
|
||
| Agriculture / Food | 1 | $86B |
|
||
Price history
+99.8% since first listed13 events — show timeline
- 2026-06-01 Coming Soon $99,900 MARIS as Distributed by MLS Grid
- 2019-06-28 Sold (MLS) — MRED as Distributed by MLS Grid
- 2019-06-28 Sold (Public Records) $60,000 Public Records
- 2019-06-28 Sold (MLS) — MARIS as Distributed by MLS Grid
- 2019-06-03 Pending — MARIS as Distributed by MLS Grid
- 2019-05-29 Listed $57,500 MARIS as Distributed by MLS Grid
- 2019-05-28 Listed $57,500 MRED as Distributed by MLS Grid
- 2013-01-16 Sold (Public Records) $47,500 Public Records
- 2013-01-11 Sold (MLS) — MARIS as Distributed by MLS Grid
- 2012-05-18 Listed $49,500 MARIS as Distributed by MLS Grid
- 1998-01-29 Sold (Public Records) $42,000 Public Records
- 1990-08-29 Sold (Public Records) $35,000 Public Records
- 1988-11-01 Sold (Public Records) $50,000 Public Records
Property tax history
+2.8%/yrLatest (2024): $1,181 · +9.4% YoY. Source: county tax records.
Cash-flow waterfall
monthlySold comps — $/sqft
last 12 mo · ≤1 miLoading sold comps…