 🏗️ New Construction
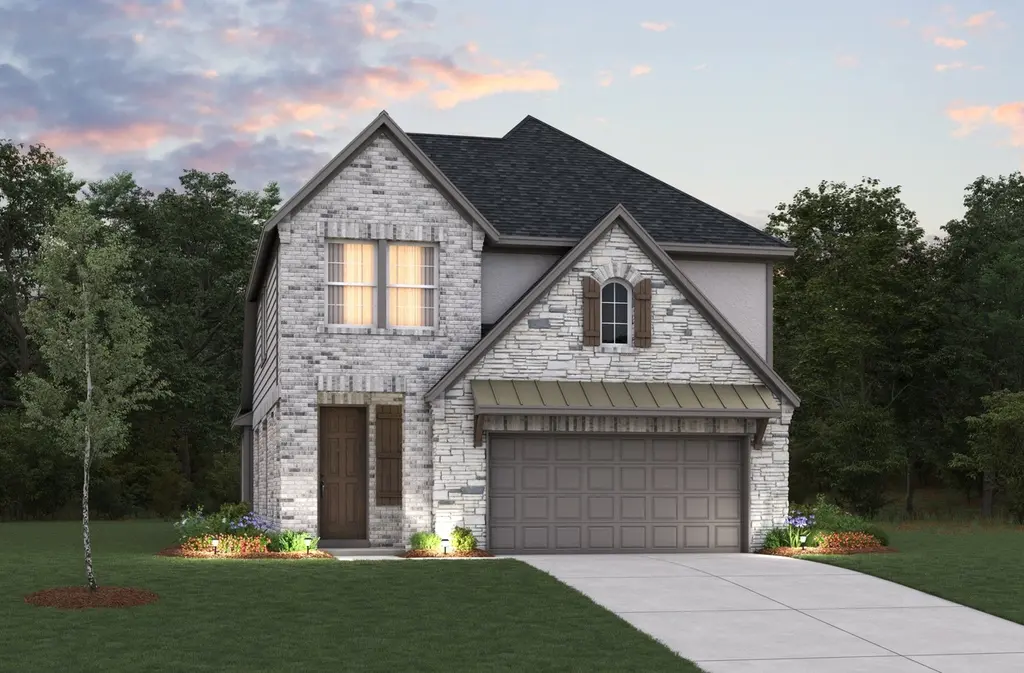
Sheffield Plan · Manvel, TX
Flood risk No data
- FEMA flood zone
- —
- Chance of flooding over 30 yrs
- —
- Est. flood insurance / yr
- —
Fire risk No data
- Est. fire insurance / yr
- —
Heat risk No data
- Hot days now (above threshold)
- —
- Hot days in 30 yrs
- —
Wind risk No data
- Chance of severe wind over 30 yrs
- —
Air-quality risk No data
- Unhealthy air days now
- —
- Unhealthy air days in 30 yrs
- —
Risk factors via First Street. Map © Google.
Why this score? — see what drove the F grade
The composite is a weighted blend of 9 inputs, each scored 0–100. Each bar is that input's sub-score; the figure is the points it added to the 100-point composite (weight × sub-score).
- ARV discount +7.5/15.0
- Cash flow +5.3/30.0
- Schools +3.9/10.0
- Livability +3.4/5.0
- Rent growth +3.2/5.0
- Condition / age +2.5/5.0
- 1% rule +0.9/10.0
- DSCR +0.0/10.0
- Appreciation +0.0/10.0
$412,990
🖨 Deal sheet 📄 Offer letter ✓ Due diligence
Listing remarks MLS
The Sheffield is a light-filled, two-story home designed with openness and privacy in mind. A dramatic two-story foyer welcomes natural light and offers an overlook from the second floor. The great room features 11-foot ceilings and tall windows, flowing seamlessly into the spacious kitchen and breakfast area. A private mud room entry connects the 2-car garage to the kitchen, while a centrally located study adds flexibility. The primary suite includes a window seat and luxury bath. Upstairs, a loft connects the secondary bedrooms for functional, flexible living.
Key facts
- Luxury bath
- Window seat
- Private mud room
Tags
Neighborhood map
What this means for you Summary
Snapshot
- This is a 4-bed/2.0-bath single-family listed at $413k.
Deal economics
- At list price, monthly cash flow is $-1k ($-13k/yr) — negative.
- To cash-flow at today's rent, offer at most $338k (18.1% below list).
- To meet the 1% rule (rent ≥ 1% of price), the offer needs to be $296k (28.3% below list).
- Recommended offer: $296k (28.3% below list) — sets the bar for 1% rule.
- Cap rate 3.6% vs local median 2.2% in Manvel — top-decile yield for the area; either an underpriced asset or a hidden risk that comps aren't pricing in. Stress-test before assuming the spread holds.
Location & tenants
- Location reads 67/100 on livability (#544 in TX) — a middle-class / working-renter tenant base. Strengths: crime A+, employment A+, housing A+; Watch: schools C-, amenities F, commute F.
- Alvin ISD (suburban): math 39% / reading 48% proficiency, ranked #255 of 826 in TX (top 31%) — families likely to look elsewhere, expect single-tenant / working-renter base with shorter leases.
- Market conditions: Rents rising (+2.8%/yr); 1243 active listings in the ZIP; 4 comparable units currently listed for rent nearby; rentals lingering (median 44d on market — plan ~5-8 weeks vacancy on turnover, expect pricing pressure); 50% of comp listings sitting > 30 days — soft ceiling on asking rent; high-income renter base; 3,960 units permitted in Brazoria County in 2024 (593 in 5+ unit buildings).
Forward outlook
- Local home prices are declining (-3.0%/yr); year-one equity from $3k of loan paydown is wiped out by about $15k of value loss. Plan a longer hold.
- Brazoria County population projected at +44% by 2050 — long-run rental-demand tailwind backs the buy-and-hold thesis.
Negotiation context
- It's been on market 83 days — a 6% lower offer ($388k) is reasonable based on typical stale-listing flexibility.
Questions for the listing agent
- What do current leases actually rent for vs. the listed asking? Can we see a recent rent roll and the last 12 months of T-12 income?
- It's been on market 83 days. Have you received any prior offers? Is the seller open to a 28% concession, seller financing, or rate buy-down credit?
- Why hasn't it sold? Are there any deal-killer items the seller is aware of (foundation, flood, title, zoning, code violations)?
- Is there a deadline driving the sale (1031 exchange, divorce, estate, relocation)? That informs how much negotiation room exists.
- The area grade is low — what's the realistic commute time and amenity access for the typical tenant pool here? Any planned neighborhood developments (good or bad) we should know about?
- What's the average days-on-market for RENTAL listings here right now (not sales)? A rising rental-DOM trend means longer vacancies and softer asking-rent achievability than the comps imply.
- What's the recent tenant-quality profile in this submarket — average credit score on applications, eviction rate, late-payment / NSF rate, and stable-employment percentage? A property-management company in the area should have these aggregated.
- How much new for-sale + rental construction is in the pipeline within 1–3 miles? Heavy new supply typically softens prices + rents 12–24 months out; constrained supply supports both.
Investment metrics
- 1% rule
- 0.59% ✗
- Cap rate
- 3.62%
- Cash-on-cash
- -9.55%
- DSCR
- 0.57
- GRM
- 14.1
CMA / ARV
- ARV (median comp)
- $499,369
- List price
- $412,990
- Delta
- -17.30%
- Verdict
- UNDERPRICED
- Comps
- 20 within 1.0 mi
Show comp detail 12 sales within ~0.75 mi
| Address | Dist | Beds/Ba | Sqft | Sold | Price | $/sf | Match |
|---|---|---|---|---|---|---|---|
| 9606 Wilder Rd | 0.10mi | 4/3.0 | 2,373 (+0%) | 1mo | $415,000 | $175 | 90 |
| 9502 Turnstone Dr | 0.38mi | 4/3.0 | 2,493 (+5%) | 1mo | $464,900 | $186 | 69 |
| 5722 Caracara St | 0.46mi | 4/3.0 | 2,504 (+6%) | 0mo | $444,900 | $178 | 65 |
| 10215 Botticelli Path | 0.18mi | 5/3.0 (+1) | 2,617 (+10%) | 1mo | $398,953 | $152 | 64 |
| 5030 Morrison Dr | 0.23mi | 4/3.0 | 2,085 (-12%) | 2mo | $389,990 | $187 | 64 |
| 5310 Murillo Dr | 0.70mi | 4/3.0 | 2,360 (-0%) | 1mo | $395,000 | $167 | 62 |
| 5306 Murillo Dr | 0.70mi | 4/3.5 | 2,455 (+4%) | 2mo | $415,000 | $169 | 54 |
| 5247 Palo Verde Dr | 0.55mi | 4/2.5 | 2,046 (-14%) | 2mo | $345,990 | $169 | 48 |
| 5219 Getty Ln | 0.74mi | 4/2.5 | 2,129 (-10%) | 1mo | $379,000 | $178 | 46 |
| 5810 Silver Perch Ln | 0.66mi | 4/4.5 | 2,593 (+9%) | 1mo | $529,976 | $204 | 43 |
| 4703 Franklin Way | 0.65mi | 4/4.0 | 2,633 (+11%) | 1mo | $424,950 | $161 | 42 |
| 5610 Mona Lisa Ct | 0.74mi | 4/3.5 | 2,619 (+10%) | 1mo | $474,999 | $181 | 41 |
Match score weights: distance 35% · size 25% · config 20% · recency 20%. Top-matched comps best support the ARV.
Projected returns pro-forma
-3.0% appreciation · 2.77% rent growth · sell at horizon
- IRR
- -33.6%
- Equity multiple
- -0.09×
- Total profit
- $-152,459
- Equity at exit
- $74,458
- IRR
- -42.9%
- Equity multiple
- -0.62×
- Total profit
- $-226,665
- Equity at exit
- $43,176
Cash invested: $139,823 (down + closing). Projections, not guarantees.
Landlord ↔ Tenant lean methodology
- Overall (STATE)
- 87 Strongly Landlord-Friendly
- State Texas
- 87 Strongly Landlord-Friendly · R+5
- County
- — inherits STATE
- City
- — inherits STATE
ZIP-level market 77578
- Rents YoY
- 2.8%
- Active inventory
- 1243
- Price-to-rent
- 11.6×
Monthly cashflow live
- Estimated rent
- $2,959 medium interval (Pro) →
- Mortgage (P&I)
- −$2,619
- Tax est. 1.5%
- −$624 /mo · $7,491/yr
- Insurance
- −$208
- HOA
- −$0
- Vacancy / Maint / Mgmt
- −$621
- Net cashflow
- $-1,113
Break-even live
UW: 25.0% down · 7.5% · 30yr · 1.5% tax · 5.0% vac · 8.0% maint · 8.0% mgmt
Financing live
Cash to close
- Down payment
- $124,842
- Closing costs
- $14,981
- Reserves months
- —
- Total cash needed
- —
Loan-product check · same deal, 3 products live
Conventional
25% down · 7.5% · 30yr
- Down + closing
- —
- Monthly P&I
- —
- Monthly cashflow
- —
- DSCR
- —
- Eligible?
- —
Personal DTI + credit; lowest rate.
DSCR
20% down · 8.5% · 30yr
- Down + closing
- —
- Monthly P&I
- —
- Monthly cashflow
- —
- DSCR
- —
- Eligible?
- —
No personal income docs; deal must DSCR.
Hard money
10% down · 12.0% · 12mo
- Down + closing
- —
- Monthly P&I
- —
- Monthly cashflow
- —
- DSCR
- —
- Eligible?
- —
Short-term bridge; refi at stabilization.
Rent comps 4 comps
| Address | Beds | Baths | Sqft | Rent | $/sqft | DOM | Units | Dist |
|---|---|---|---|---|---|---|---|---|
| 9623 Wright Dr Manvel, TX | 4.0 | 3.0 | 2548 | $3,600 | $1.41 | 24d | 1 | 0.36mi |
| 5714 Caracara St Arcola, TX | 3.0 | 2.0 | 2518 | $2,750 | $1.09 | 3d | 1 | 0.43mi |
| 10327 Armstrong Dr Rosharon, TX | 3.0 | 2.0 | 1956 | $2,291 | $1.17 | 44d | 1 | 1.41mi |
| 4143 Champlain Way Rosharon, TX | 3.0 | 3.0 | 1839 | $2,400 | $1.31 | 44d | 1 | 1.44mi |
Listing history 17 events
-
2026-06-18days on market $412,990 Active 83 DOM
-
2026-06-17days on market $412,990 Active 82 DOM
-
2026-06-16days on market $412,990 Active 81 DOM
-
2026-06-15days on market $412,990 Active 80 DOM
-
2026-06-13days on market $412,990 Active 78 DOM
-
2026-06-13days on market $412,990 Active 77 DOM
-
2026-06-09days on market $412,990 Active 74 DOM
-
2026-06-08days on market $412,990 Active 73 DOM
-
2026-06-07days on market $412,990 Active 72 DOM
-
2026-06-04days on market $412,990 Active 69 DOM
-
2026-06-03days on market $412,990 Active 68 DOM
-
2026-06-02days on market $412,990 Active 67 DOM
-
2026-06-02price $412,990 Active 66 DOM
-
2026-06-01days on market $392,990 Active 66 DOM
-
2026-05-31days on market $392,990 Active 65 DOM
-
2026-05-15price $392,990 568-char remark
Show marketing remark (568 chars)
The Sheffield is a light-filled, two-story home designed with openness and privacy in mind. A dramatic two-story foyer welcomes natural light and offers an overlook from the second floor. The great room features 11-foot ceilings and tall windows, flowing seamlessly into the spacious kitchen and breakfast area. A private mud room entry connects the 2-car garage to the kitchen, while a centrally located study adds flexibility. The primary suite includes a window seat and luxury bath. Upstairs, a loft connects the secondary bedrooms for functional, flexible living.
-
2026-03-27$382,990 Active 568-char remark
Show marketing remark (568 chars)
The Sheffield is a light-filled, two-story home designed with openness and privacy in mind. A dramatic two-story foyer welcomes natural light and offers an overlook from the second floor. The great room features 11-foot ceilings and tall windows, flowing seamlessly into the spacious kitchen and breakfast area. A private mud room entry connects the 2-car garage to the kitchen, while a centrally located study adds flexibility. The primary suite includes a window seat and luxury bath. Upstairs, a loft connects the secondary bedrooms for functional, flexible living.
ⓘ Source: listings_history table (triggers on properties + properties_extension) + one-shot
backfill from property_details.listing_events for pre-trigger history.
Nearby sold comps map
Loading sold comps map…
Walkable amenities ~0.75 mi
Loading nearby amenities…
Taxation est. · year 1
- Rental income
- $35,511
- − Mortgage interest
- −$27,972
- − Property taxes
- −$7,491
- − Insurance
- −$2,497
- − Repairs & maintenance
- −$2,841
- − Management
- −$2,841
- − Depreciation
- −$14,527
- Taxable loss
- −$22,658
- Est. tax savings @ 24.0%
- +$5,438
- After-tax cash flow
- $-7,921/yr
For passive investors: Depreciation is non-cash, so a rental often shows a tax loss while cash-flowing — sheltering income. Rental losses are passive: they offset passive income freely, and up to $25,000/yr can offset ordinary (W-2) income if you actively participate and your MAGI is under $100k (phasing out to $0 by $150k); unused losses carry forward. On sale, claimed depreciation is recaptured at up to 25%, and gains may owe capital-gains tax (a 1031 exchange can defer both). Figures are a year-1 estimate at your 24.0% rate — not tax advice; consult a CPA.
Schools (NCES district)
- District
- Alvin ISD
- NCES district ID
- 4808090
- Math proficiency
- 39% ▼ -11.00%
- Reading proficiency
- 48% ▬ 0.00%
- Median HH income
- $66,740
- Composite
- 38.96/100
- National rank
- #4080
- State rank
- #255 of 826 in TX
Livability — Manvel
- Score
- 67/100
- State rank
- #544
- US rank
- #10576
Category grades
Schools grade is shown separately in the Schools card above.
Census & demographics
- Census place
- Manvel, TX
- County
- Brazoria County · 374,982 people
- City population
- 30,210
- Metro
- Houston-The Woodlands-Sugar Land, TX
- Population (ZIP)
- 30,210
- Household income
- $134,016
- Rent vs Own
- Severe rent burden
- 93.0
Population outlook (Brazoria County) Hauer SSP2
- Today (2025)
- 420,414 people
- By 2030
- 457,585 · +8.8%
- By 2040
- 532,232 · +26.6%
- By 2050
- 605,399 · +44.0%
- By 2075
- 779,358 · +85.4%
- By 2100
- 883,759 · +110.2%
Race, ethnicity, and origin ACS 2023
- Neighborhood character
- Highly diverse neighborhood (Simpson 0.73)
- Race & ethnicity
- White 36% Black 30% Hispanic / Latino 22% Two or more races 15% Asian 9%
- Hispanic origin (detail)
- Mexican 18%
- Common ancestry
- Norwegian 2% Subsaharan African 2% Scotch-Irish 1%
- Foreign-born
- 15% · Canada, China, Vietnam
- Languages at home
- 78% English-only · Spanish 13% Tagalog/Filipino 2% Vietnamese 2%
Political lean MEDSL · Brazoria
- 2024 margin
- R (+19.7) · D 39.5% · R 59.2% · Other 1.3%
- 2008→2024 swing
- +9.9pp toward D · 2008: -29.6pp · 2024: -19.7pp
- All cycles
- 2024: R+19.7 2020: R+18.2 2016: R+24.6 2012: R+34.2 2008: R+29.6
Not yet ingested
- Civics
- —
Market trends
- HPI YoY
- ▼ -154.15%
- Current HPI
- 218.4264
- Rent YoY
- ▲ 2.77%
- Metro
- Houston-The Woodlands-Sugar Land, TX
- State GDP YoY
- ▲ 3.95%
- F500 in state
- 110
Industry mix (Fortune 500 HQ in TX)
| Industry | F500 HQs | Revenue |
|---|---|---|
| Energy | 16 | $1,198B |
|
||
| Technology | 5 | $198B |
|
||
| Engineering / Construction | 4 | $72B |
|
||
| Energy Services | 3 | $60B |
|
||
| Utilities | 3 | $41B |
|
||
| Healthcare | 2 | $330B |
|
||
Price history
+2.6% since first listed2 events — show timeline
- 2026-05-15 Price Changed $392,990 Zillow
- 2026-03-27 Listed $382,990 Zillow
Cash-flow waterfall
monthlySold comps — $/sqft
last 12 mo · ≤1 miLoading sold comps…