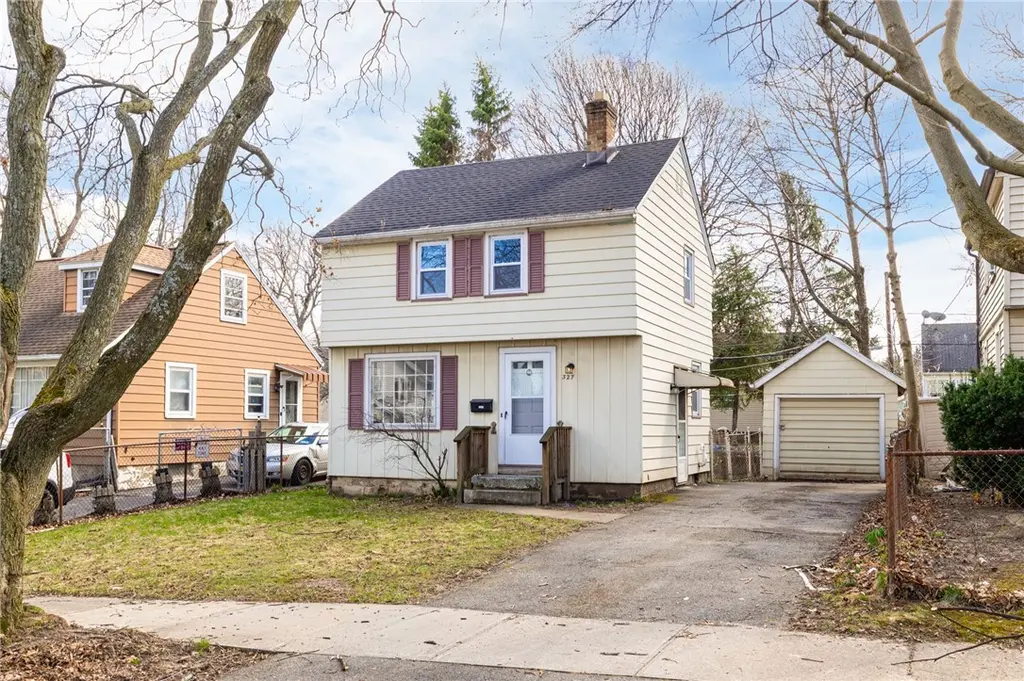
327 Rand St · Rochester, NY
Flood risk 1/10 · Minimal
- FEMA flood zone
- X (unshaded)
- Chance of flooding over 30 yrs
- 0.0%
- Est. flood insurance / yr
- $473 – $860
Fire risk 3/10 · Minor
- Est. fire insurance / yr
- $691 – $1,283
Heat risk 2/10 · Minimal
- Hot days now (above 95°F)
- 7 days/yr
- Hot days in 30 yrs
- 15 days/yr
Wind risk 1/10 · Minimal
- Chance of severe wind over 30 yrs
- —
Air-quality risk 2/10 · Minimal
- Unhealthy air days now
- 1 days/yr
- Unhealthy air days in 30 yrs
- 2 days/yr
Risk factors via First Street. Map © Google.
Why this score? — see what drove the C grade
The composite is a weighted blend of 9 inputs, each scored 0–100. Each bar is that input's sub-score; the figure is the points it added to the 100-point composite (weight × sub-score).
- Cash flow +21.8/30.0
- ARV discount +15.0/15.0
- DSCR +7.0/10.0
- 1% rule +4.8/10.0
- Livability +3.8/5.0
- Rent growth +2.5/5.0
- Condition / age +2.5/5.0
- Schools +1.9/10.0
- Appreciation +0.0/10.0
$125,000
🖨 Deal sheet 📄 Offer letter ✓ Due diligence
Listing remarks
This move-in-ready Maplewood property features a brand new kitchen complete with stylish shaker cabinets, warm butcher block countertops, and new appliances—all included for your convenience. Durable, scratch and water-resistant laminate flooring runs seamlessly throughout the home, complemented by brand new vinyl windows that enhance both efficiency and natural light. The updated full bathroom offers a clean, modern feel, while the generously sized primary bedroom boasts a walk-in closet for ample storage. Outside, enjoy a fully fenced yard—perfect for pets, entertaining, or added privacy—along with a detached garage for additional storage or parking. 2025 Hot Water Tank.
Key facts
- Brand new kitchen
- Walk-in closet
- New vinyl windows
Tags
Neighborhood map
What this means for you Summary
Snapshot
- This is a 2-bed/1.0-bath single-family listed at $125k.
Deal economics
- At list price, monthly cash flow is $196 ($2k/yr) — positive.
- The deal already cash-flows at list — no discount required.
- To meet the 1% rule (rent ≥ 1% of price), the offer needs to be $123k (1.6% below list).
- Recommended offer: $123k (1.6% below list) — sets the bar for 1% rule.
Location & tenants
- Location reads 76/100 on livability (#222 in NY, #3,482 nationally) — a middle-class / working-renter tenant base. Strengths: commute A+, cost of living A+, housing A+; Watch: schools D+, crime F, employment F.
- Rochester City School District (urban): math 21% / reading 26% proficiency, ranked #589 of 590 in NY (top 100%) — low school quality limits family demand, transient renter base, plan for 1-2y turnover; 82% free/reduced lunch — lower-income household profile, screen leases tightly.
- Market conditions: 74 active listings in the ZIP; 19 comparable units currently listed for rent nearby; rentals at typical pace (median 15d on market — plan ~3-4 weeks tenant-placement turnaround); 1,169 units permitted in Monroe County in 2024 (591 in 5+ unit buildings).
Forward outlook
- Local home prices are declining (-3.0%/yr); year-one equity from $864 of loan paydown is wiped out by about $4k of value loss. Plan a longer hold.
- Monroe County population projected to shrink 6% by 2050 — rents likely to lag national; underwrite the cash flow, not the appreciation.
Negotiation context
- Only 7 days on market — expect competitive offers; lowballing is unlikely to land.
- Current owner paid $85k; 47% above their basis — modest negotiation headroom, anchor on the comps not their cost.
Risks & watch-outs
- Watch-outs: built in 1949 — expect roof / HVAC / electrical / plumbing capex.
Questions for the listing agent
- Built in 1949 — when were the roof, HVAC, electrical panel, plumbing, and water heater last replaced?
- Is there a deadline driving the sale (1031 exchange, divorce, estate, relocation)? That informs how much negotiation room exists.
- Schools are D-rated, which usually means shorter tenancies and higher turnover. Who's the typical renter profile here, and what's been the actual vacancy rate?
- Crime grade is F in this area — have there been break-ins, vandalism, or insurance claims at this property in the last 3 years? What carrier currently insures it and at what premium?
- What's the average days-on-market for RENTAL listings here right now (not sales)? A rising rental-DOM trend means longer vacancies and softer asking-rent achievability than the comps imply.
- What's the recent tenant-quality profile in this submarket — average credit score on applications, eviction rate, late-payment / NSF rate, and stable-employment percentage? A property-management company in the area should have these aggregated.
- How much new for-sale + rental construction is in the pipeline within 1–3 miles? Heavy new supply typically softens prices + rents 12–24 months out; constrained supply supports both.
Investment metrics
- 1% rule
- 0.98% ✗
- Cap rate
- 8.17%
- Cash-on-cash
- 6.71%
- DSCR
- 1.30
- GRM
- 8.5
CMA / ARV
- ARV (on-the-fly)
- $152,418
- Comps found
- 7
Show comp detail 7 sales within ~0.75 mi
| Address | Dist | Beds/Ba | Sqft | Sold | Price | $/sf | Match |
|---|---|---|---|---|---|---|---|
| 394 Knickerbocker Ave | 0.19mi | 2/1.0 | 717 (-10%) | 2mo | $137,000 | $191 | 73 |
| 81 Fox St | 0.28mi | 3/1.0 (+1) | 836 (+5%) | 3mo | $160,000 | $191 | 72 |
| 534 Newbury St | 0.35mi | 2/1.0 | 891 (+12%) | 1mo | $165,000 | $185 | 63 |
| 63 Dorothy Ave | 0.57mi | 2/1.0 | 754 (-6%) | 2mo | $162,300 | $215 | 63 |
| 670 Ridgeway Ave | 0.25mi | 2/1.5 | 839 (+5%) | 19mo | $139,000 | $166 | 62 |
| 127 Perinton St | 0.44mi | 2/1.0 | 720 (-10%) | 11mo | $145,000 | $201 | 54 |
| 1921 Dewey Ave | 0.58mi | 2/2.0 | 889 (+11%) | 8mo | $132,000 | $148 | 44 |
Match score weights: distance 35% · size 25% · config 20% · recency 20%. Top-matched comps best support the ARV.
Projected returns pro-forma
-3.0% appreciation · 3.0% rent growth · sell at horizon
- IRR
- -6.0%
- Equity multiple
- 0.78×
- Total profit
- $-7,835
- Equity at exit
- $18,638
- IRR
- 3.6%
- Equity multiple
- 1.26×
- Total profit
- $9,073
- Equity at exit
- $10,808
Cash invested: $35,000 (down + closing). Projections, not guarantees.
Landlord ↔ Tenant lean methodology
- Overall (STATE)
- 15 Strongly Tenant-Friendly
- State New York
- 15 Strongly Tenant-Friendly · D+10
- County
- — inherits STATE
- City
- — inherits STATE
ZIP-level market 14615
- Home prices YoY
- -11.7%
- Active inventory
- 74
- Price-to-rent
- 8.5×
Monthly cashflow live
- Estimated rent
- $1,230 high interval (Pro) →
- Mortgage (P&I)
- −$656
- Tax from tax record
- −$69 /mo · $826/yr
- Insurance
- −$52
- HOA
- −$0
- Vacancy / Maint / Mgmt
- −$258
- Net cashflow
- $196
Break-even live
UW: 25.0% down · 7.5% · 30yr · 1.5% tax · 5.0% vac · 8.0% maint · 8.0% mgmt
Financing live
Cash to close
- Down payment
- $31,250
- Closing costs
- $3,750
- Reserves months
- —
- Total cash needed
- —
Loan-product check · same deal, 3 products live
Conventional
25% down · 7.5% · 30yr
- Down + closing
- —
- Monthly P&I
- —
- Monthly cashflow
- —
- DSCR
- —
- Eligible?
- —
Personal DTI + credit; lowest rate.
DSCR
20% down · 8.5% · 30yr
- Down + closing
- —
- Monthly P&I
- —
- Monthly cashflow
- —
- DSCR
- —
- Eligible?
- —
No personal income docs; deal must DSCR.
Hard money
10% down · 12.0% · 12mo
- Down + closing
- —
- Monthly P&I
- —
- Monthly cashflow
- —
- DSCR
- —
- Eligible?
- —
Short-term bridge; refi at stabilization.
Rent comps 19 comps
| Address | Beds | Baths | Sqft | Rent | $/sqft | DOM | Units | Dist |
|---|---|---|---|---|---|---|---|---|
| 14 Ramona Park Rochester, NY | 2.0 | 1.0 | 624 | $893 | $1.43 | 43d | 1 | 0.11mi |
| 1902 Dewey Ave Unit 1896 Rochester, NY | 2.0 | 1.0 | 900 | $1,150 | $1.28 | 23d | 1 | 0.58mi |
| 230 Pullman Ave Unit 1 Rochester, NY | 2.0 | 1.0 | 900 | $1,100 | $1.22 | 14d | 1 | 0.66mi |
| 100 Andover St Rochester, NY | 2.0 | 1.0 | 750 | $1,795 | $2.39 | 2d | 63 | 0.67mi |
| 391-393 Flower City Park Unit Down Rochester, NY | 1.0 | 1.0 | 800 | $950 | $1.19 | 23d | 1 | 0.74mi |
| 41 Whitehouse Dr Greece, NY | 1.0 | 1.0 | 625 | $1,622 | $2.60 | 2d | 7 | 0.77mi |
| 2 Glenora Gdns Rochester, NY | 1.0–2.0 | 1.0 | 692 | $1,755 | $2.53 | 2d | 17 | 0.80mi |
| 116 Ridgeway Ave Rochester, NY | 3.0 | 2.0 | 1032 | $1,650 | $1.60 | 2d | 1 | 0.83mi |
| 1097 Dewey Ave Unit B Rochester, NY | 2.0 | 1.0 | 1008 | $1,150 | $1.14 | 14d | 1 | 0.94mi |
| 45 Clay Ave Rochester, NY | 3.0 | 1.0 | 1000 | $1,700 | $1.70 | 14d | 1 | 0.97mi |
| 1370 Ridgeway Ave Rochester, NY | 2.0 | 1.0 | 800 | $1,250 | $1.56 | 23d | 1 | 1.04mi |
| 221 Susan Ln Rochester, NY | 1.0 | 1.0 | 615 | $1,035 | $1.68 | 43d | 1 | 1.16mi |
| 2 Archer St Unit UP Rochester, NY | 1.0 | 1.0 | 600 | $895 | $1.49 | 43d | 1 | 1.21mi |
| 266 Hoover Dr Rochester, NY | 3.0 | 1.0 | 816 | $2,295 | $2.81 | 2d | 1 | 1.24mi |
| 265 Driving Park Ave Unit 25 Rochester, NY | 1.0 | 1.0 | 605 | $1,150 | $1.90 | 43d | 1 | 1.32mi |
| 265 Driving Park Ave Unit 31 Rochester, NY | 2.0 | 1.0 | 810 | $1,250 | $1.54 | 43d | 1 | 1.32mi |
| 254 Lexington Ave Rochester, NY | 3.0 | 1.0 | 950 | $1,350 | $1.42 | 3d | 1 | 1.41mi |
| 200 Seth Green Dr Rochester, NY | 1.0 | 1.0 | 517 | $858 | $1.66 | 43d | 1 | 1.48mi |
| 19 Rainier St Rochester, NY | 1.0 | 1.0 | 786 | $850 | $1.08 | 3d | 1 | 1.49mi |
Listing history 4 events
-
2026-04-15status Pending
-
2026-04-08$125,000 Active
-
2005-05-12soldstatus $85,279
-
1996-07-23soldstatus $48,000
ⓘ Source: listings_history table (triggers on properties + properties_extension) + one-shot
backfill from property_details.listing_events for pre-trigger history.
Tax reassessment forecast NY · Partial reset (capped growth)
- Current annual tax
- $826 · $69/mo
- Projected year-2 tax
- $1,469 · $122/mo
- Expected delta
- +$643/yr (+$54/mo · 77.8%)
ⓘ Screening estimate from a state-policy table — verify with the county assessor before closing.
Climate risk First Street
- Flood 1/10 Low FEMA zone X (unshaded) · 0% chance over 30 yrs
- Wildfire 3/10 Moderate
- Heat 2/10 Low 7 d/yr ≥95°F today · 15 d/yr by 30 yrs out
- Wind 1/10 Low
- Air quality 2/10 Low 1 unhealthy d/yr today · 2 by 30 yrs out
Nearby sold comps map
Loading sold comps map…
Walkable amenities ~0.75 mi
Loading nearby amenities…
Taxation est. · year 1
- Rental income
- $14,765
- − Mortgage interest
- −$7,002
- − Property taxes
- −$826
- − Insurance
- −$625
- − Repairs & maintenance
- −$1,181
- − Management
- −$1,181
- − Depreciation
- −$3,636
- Taxable income
- $313
- Est. tax owed @ 24.0%
- −$75
- After-tax cash flow
- $2,272/yr
For passive investors: Depreciation is non-cash, so a rental often shows a tax loss while cash-flowing — sheltering income. Rental losses are passive: they offset passive income freely, and up to $25,000/yr can offset ordinary (W-2) income if you actively participate and your MAGI is under $100k (phasing out to $0 by $150k); unused losses carry forward. On sale, claimed depreciation is recaptured at up to 25%, and gains may owe capital-gains tax (a 1031 exchange can defer both). Figures are a year-1 estimate at your 24.0% rate — not tax advice; consult a CPA.
Schools (NCES district)
- District
- Rochester City School District
- NCES district ID
- 3624750
- Math proficiency
- 21% ▬ 0.00%
- Reading proficiency
- 26% ▲ 4.00%
- Median HH income
- $30,923
- Composite
- 18.98/100
- National rank
- #8850
- State rank
- #589 of 590 in NY
Livability — Rochester
- Score
- 76/100
- State rank
- #222
- US rank
- #3482
Category grades
Schools grade is shown separately in the Schools card above.
Census & demographics
- Census place
- Rochester, NY
- County
- Monroe County · 674,131 people
- City population
- 432,803
- Metro
- Rochester, NY
- Population (ZIP)
- 17,884
- Household income
- $51,262
- Rent vs Own
- Severe rent burden
- 1245.0
Population outlook (Monroe County) Hauer SSP2
- Today (2025)
- 759,460 people
- By 2030
- 757,154 · -0.3%
- By 2040
- 740,644 · -2.5%
- By 2050
- 714,443 · -5.9%
- By 2075
- 645,883 · -15.0%
- By 2100
- 547,084 · -28.0%
Race, ethnicity, and origin ACS 2023
- Neighborhood character
- Diverse neighborhood (Simpson 0.68)
- Race & ethnicity
- White 45% Black 27% Hispanic / Latino 20% Two or more races 9% Asian 3%
- Hispanic origin (detail)
- Puerto Rican 16% Cuban 2%
- Common ancestry
- Arab 3% Romanian 2% Subsaharan African 2%
- Foreign-born
- 10% · Canada, India, Vietnam
- Languages at home
- 81% English-only · Spanish 11% Arabic 2% Other Indo-European 2%
Political lean MEDSL · Monroe
- 2024 margin
- D (+19.1) · D 59.5% · R 40.5%
- 2008→2024 swing
- +1.4pp toward D · 2008: 17.7pp · 2024: 19.1pp
- All cycles
- 2024: D+19.1 2020: D+21.0 2016: D+14.1 2012: D+17.4 2008: D+17.7
Not yet ingested
- Civics
- —
Market trends
- HPI YoY
- ▼ -31.81%
- Current HPI
- 240.6896
- Rent YoY
- —
- Metro
- Rochester, NY
- State GDP YoY
- ▲ 2.60%
- F500 in state
- 92
Industry mix (Fortune 500 HQ in NY)
| Industry | F500 HQs | Revenue |
|---|---|---|
| Financial Services | 10 | $950B |
|
||
| Consumer Goods | 9 | $162B |
|
||
| Insurance | 4 | $225B |
|
||
| Telecommunications | 2 | $144B |
|
||
| Pharmaceuticals | 2 | $112B |
|
||
| Media / Entertainment | 2 | $69B |
|
||
Price history
+160.4% since first listed4 events — show timeline
- 2026-04-15 Pending — UNYREIS
- 2026-04-08 Listed $125,000 UNYREIS
- 2005-05-12 Sold (Public Records) $85,279 Public Records
- 1996-07-23 Sold (Public Records) $48,000 Public Records
Property tax history
+2.8%/yrLatest (2025): $826 · +0.0% YoY. Source: county tax records.
Cash-flow waterfall
monthlySold comps — $/sqft
last 12 mo · ≤1 miLoading sold comps…