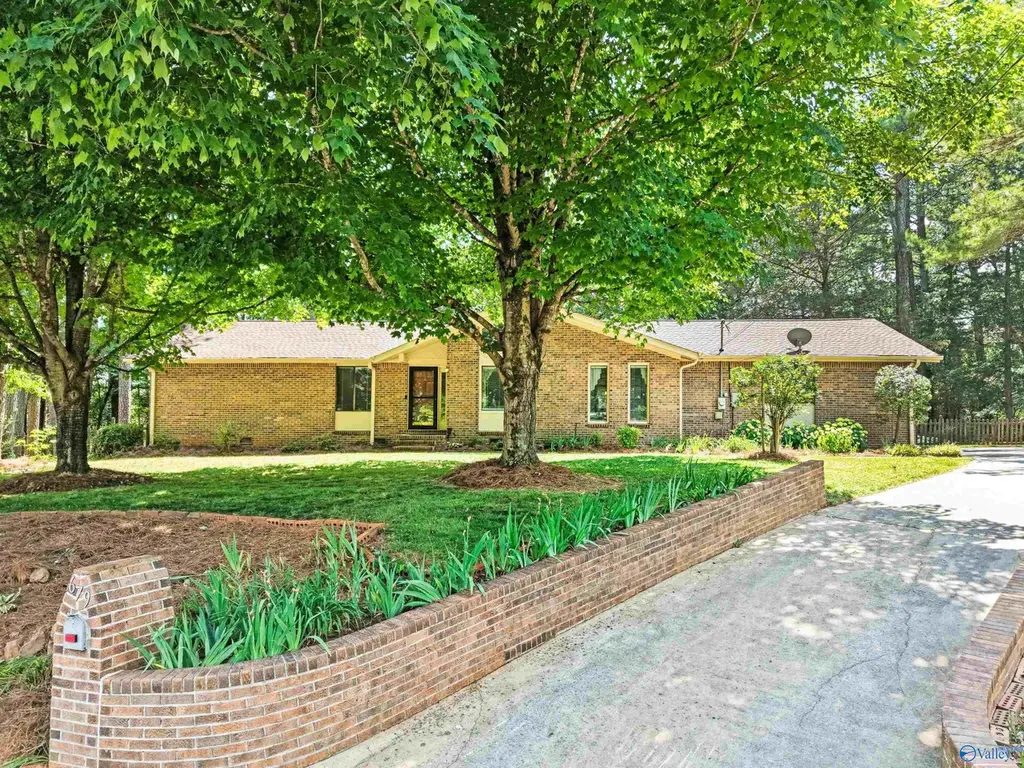
679 Cambridge Dr · Madison, AL
Flood risk 1/10 · Minimal
- FEMA flood zone
- X (unshaded)
- Chance of flooding over 30 yrs
- 0.0%
- Est. flood insurance / yr
- $507 – $1,088
Fire risk 1/10 · Minimal
- Est. fire insurance / yr
- $916 – $1,700
Heat risk 5/10 · Moderate
- Hot days now (above 106°F)
- 7 days/yr
- Hot days in 30 yrs
- 18 days/yr
Wind risk 4/10 · Minor
- Chance of severe wind over 30 yrs
- 19.0%
Air-quality risk 2/10 · Minimal
- Unhealthy air days now
- 0 days/yr
- Unhealthy air days in 30 yrs
- 2 days/yr
Risk factors via First Street. Map © Google.
Why this score? — see what drove the D- grade
The composite is a weighted blend of 9 inputs, each scored 0–100. Each bar is that input's sub-score; the figure is the points it added to the 100-point composite (weight × sub-score).
- Appreciation +10.0/10.0
- Cash flow +6.3/30.0
- Schools +5.6/10.0
- Livability +3.8/5.0
- ARV discount +3.5/15.0
- Rent growth +2.9/5.0
- Condition / age +2.5/5.0
- DSCR +0.7/10.0
- 1% rule +0.4/10.0
$349,900
🖨 Deal sheet 📄 Offer letter ✓ Due diligence
Listing remarks
Charming 3BR/2 Full BA rancher in prime Madison location just mins to Midtowne, I-565 & Hwy. 72. Cul-de-sac Lot!This home Features vaulted ceilings as you enter the Living area, Bay window in breakfast, updated kitchen with Granite countertops, tile backsplash & floor, Family Rm features FP and New French doors that lead to an oversized deck with handicap-accessible ramp. Wooden fenced yard with mature landscaping. Shed with electricity! Primary BR with huge BA includes vaulted ceiling with new sky light & shade. Jetted tub! Updates include:NEW- roof, water heater, exterior & interior paint, light fixtures, skylight & shade, water filtratiion. & french doo
Key facts
- Cul-de-sac lot
- Bay window
- Updated kitchen
Tags
Property features AI
Finance
- Other: Directions available: 565W to Madison Blvd exit, right on Slaughter Road, left on Madison Pike, left on Cambridge Drive; home on the right
- HOA & community: No homeowners association; Subdivision: Cambridge Woods
Exterior
- Parking: Two-car garage; Paved asphalt driveway
- Utilities: Public water; Public sewer; Electric service (standard)
- Home design: Single-family residence; One level; Built in 1984; Brick construction
- Construction: Brick exterior
- Exterior features: Public water; Public sewer; Lot approximately 0.44 acres
Interior
- Bedrooms: Total of 8 rooms (includes bedrooms and living areas)
- Bathrooms: 2 full bathrooms
- Heating & cooling: Central heating; Central cooling
- Interior features: Crawl space basement; Fireplace (1)
Neighborhood map
What this means for you Summary
Snapshot
- This is a 3-bed/1.0-bath single-family listed at $350k.
Deal economics
- At list price, monthly cash flow is $-614 ($-7k/yr) — negative.
- To cash-flow at today's rent, offer at most $241k (31.0% below list).
- To meet the 1% rule (rent ≥ 1% of price), the offer needs to be $188k (46.2% below list).
- Recommended offer: $188k (46.2% below list) — sets the bar for 1% rule.
- Cap rate 4.2% vs local median 2.6% in Madison — top-decile yield for the area; either an underpriced asset or a hidden risk that comps aren't pricing in. Stress-test before assuming the spread holds.
Location & tenants
- Location reads 76/100 on livability (#12 in AL, #3,280 nationally) — a middle-class / working-renter tenant base. Strengths: employment A+, housing A+, crime B+; Watch: amenities F, commute F.
- Madison City (suburban): math 51% / reading 71% proficiency, ranked #4 of 129 in AL (top 3%) — acceptable for families but not a draw, mixed tenant base, ~2y average lease; only 17% free/reduced lunch — higher-income household profile.
- Zoned schools: Midtown Elementary School (math 49% / reading 78%, grade B, #46 of 627 statewide, top 8%, 999 students, 26% FRL); Discovery Middle School (math 46% / reading 69%, grade B, #13 of 257 statewide, top 5%, 1,334 students, 25% FRL); Bob Jones High School (math 53% / reading 51%, grade D+, #11 of 305 statewide, top 4%, 1,920 students, 24% FRL).
- Market conditions: Rents rising (+1.6%/yr); 382 active listings in the ZIP; 37 comparable units currently listed for rent nearby; rentals at typical pace (median 24d on market — plan ~3-4 weeks tenant-placement turnaround); 43% of comp listings sitting > 30 days — soft ceiling on asking rent; high-income renter base; 4,709 units permitted in Madison County in 2024 (1,186 in 5+ unit buildings).
Forward outlook
- In year one you build about $37k of equity ($2k loan paydown + $35k appreciation (10.0% local appreciation)).
- Madison County population projected at +18% by 2050 — long-run rental-demand tailwind backs the buy-and-hold thesis.
- By year 2, paydown + projected appreciation supports a ~$60k cash-out refi (75% LTV) — recoverable capital for the next deal without selling this one.
Negotiation context
- Only 1 days on market — expect competitive offers; lowballing is unlikely to land.
Risks & watch-outs
- Climate carrying-cost: extreme-heat days projected 7→18/yr by 2055 (HVAC capex compounding) — expect insurance premiums to compound above CPI over the hold.
Questions for the listing agent
- What do current leases actually rent for vs. the listed asking? Can we see a recent rent roll and the last 12 months of T-12 income?
- Is there a deadline driving the sale (1031 exchange, divorce, estate, relocation)? That informs how much negotiation room exists.
- Schools are A-rated — typically a magnet for longer-tenancy family renters. What's the average tenant stay here, and is there a school-zone premium baked into asking?
- The area grade is low — what's the realistic commute time and amenity access for the typical tenant pool here? Any planned neighborhood developments (good or bad) we should know about?
- What's the average days-on-market for RENTAL listings here right now (not sales)? A rising rental-DOM trend means longer vacancies and softer asking-rent achievability than the comps imply.
- What's the recent tenant-quality profile in this submarket — average credit score on applications, eviction rate, late-payment / NSF rate, and stable-employment percentage? A property-management company in the area should have these aggregated.
- How much new for-sale + rental construction is in the pipeline within 1–3 miles? Heavy new supply typically softens prices + rents 12–24 months out; constrained supply supports both.
Investment metrics
- 1% rule
- 0.54% ✗
- Cap rate
- 4.19%
- Cash-on-cash
- -7.52%
- DSCR
- 0.67
- GRM
- 15.5
CMA / ARV
- ARV (on-the-fly)
- $321,124
- Comps found
- 12
Show comp detail 12 sales within ~0.75 mi
| Address | Dist | Beds/Ba | Sqft | Sold | Price | $/sf | Match |
|---|---|---|---|---|---|---|---|
| 675 Cambridge Dr | 0.04mi | 3/2.0 | 1,890 (+1%) | 2mo | $340,000 | $180 | 91 |
| 604 Ambrose Dr | 0.07mi | 4/2.5 (+1) | 1,808 (-3%) | 0mo | $312,000 | $173 | 80 |
| 119 Betty Williams Dr | 0.41mi | 4/2.0 (+1) | 1,841 (-1%) | 2mo | $315,900 | $172 | 68 |
| 121 Betty Williams Dr | 0.42mi | 4/2.0 (+1) | 1,841 (-1%) | 2mo | $315,000 | $171 | 68 |
| 115 Betty Williams Dr | 0.43mi | 4/2.0 (+1) | 1,841 (-1%) | 2mo | $315,000 | $171 | 67 |
| 118 Betty Williams Dr | 0.44mi | 4/2.0 (+1) | 1,841 (-1%) | 2mo | $313,900 | $171 | 67 |
| 116 Betty Williams Dr | 0.45mi | 4/2.0 (+1) | 1,841 (-1%) | 2mo | $314,900 | $171 | 66 |
| 108 Betty Williams Dr | 0.50mi | 4/2.0 (+1) | 1,841 (-1%) | 3mo | $313,900 | $171 | 63 |
| 304 Pineridge Cir | 0.59mi | 3/2.0 | 1,820 (-2%) | 2mo | $360,000 | $198 | 63 |
| 108 Stavemill Cir | 0.28mi | 3/2.0 | 1,629 (-13%) | 1mo | $379,900 | $233 | 61 |
| 1005 Wood Cir | 0.51mi | 3/2.0 | 1,618 (-13%) | 1mo | $310,000 | $192 | 49 |
| 1109 Woodbine Rd | 0.69mi | 3/2.0 | 1,609 (-14%) | 1mo | $225,000 | $140 | 40 |
Match score weights: distance 35% · size 25% · config 20% · recency 20%. Top-matched comps best support the ARV.
Projected returns pro-forma
10.0% appreciation · 1.58% rent growth · sell at horizon
- IRR
- 18.7%
- Equity multiple
- 2.52×
- Total profit
- $148,629
- Equity at exit
- $315,218
- IRR
- 17.1%
- Equity multiple
- 5.73×
- Total profit
- $463,045
- Equity at exit
- $679,779
Cash invested: $97,972 (down + closing). Projections, not guarantees.
Landlord ↔ Tenant lean methodology
- Overall (STATE)
- 90 Strongly Landlord-Friendly
- State Alabama
- 90 Strongly Landlord-Friendly · R+15
- County
- — inherits STATE
- City
- — inherits STATE
ZIP-level market 35758
- Home prices YoY
- 4.2%
- Rents YoY
- 1.6%
- Active inventory
- 382
- Price-to-rent
- 15.5×
Monthly cashflow live
- Estimated rent
- $1,881 high interval (Pro) →
- Mortgage (P&I)
- −$1,835
- Tax from tax record
- −$120 /mo · $1,438/yr
- Insurance
- −$146
- HOA
- −$0
- Vacancy / Maint / Mgmt
- −$395
- Net cashflow
- $-614
Break-even live
UW: 25.0% down · 7.5% · 30yr · 1.5% tax · 5.0% vac · 8.0% maint · 8.0% mgmt
Financing live
Cash to close
- Down payment
- $87,475
- Closing costs
- $10,497
- Reserves months
- —
- Total cash needed
- —
Loan-product check · same deal, 3 products live
Conventional
25% down · 7.5% · 30yr
- Down + closing
- —
- Monthly P&I
- —
- Monthly cashflow
- —
- DSCR
- —
- Eligible?
- —
Personal DTI + credit; lowest rate.
DSCR
20% down · 8.5% · 30yr
- Down + closing
- —
- Monthly P&I
- —
- Monthly cashflow
- —
- DSCR
- —
- Eligible?
- —
No personal income docs; deal must DSCR.
Hard money
10% down · 12.0% · 12mo
- Down + closing
- —
- Monthly P&I
- —
- Monthly cashflow
- —
- DSCR
- —
- Eligible?
- —
Short-term bridge; refi at stabilization.
Rent comps 37 comps
| Address | Beds | Baths | Sqft | Rent | $/sqft | DOM | Units | Dist |
|---|---|---|---|---|---|---|---|---|
| 104 Kathy Cir Madison, AL | 3.0 | 2.0 | 1768 | $1,995 | $1.13 | 43d | 1 | 0.16mi |
| 416 Walton Rd Madison, AL | 3.0 | 2.0 | 1306 | $1,795 | $1.37 | 14d | 1 | 0.17mi |
| 712 Marion Dr Madison, AL | 3.0 | 1.0 | 1253 | $1,450 | $1.16 | 43d | 1 | 0.25mi |
| 709 Marion Dr Madison, AL | 3.0 | 2.0 | 2050 | $1,795 | $0.88 | 21d | 1 | 0.25mi |
| 619 Larry Dr Madison, AL | 4.0 | 2.0 | 2093 | $2,031 | $0.97 | 23d | 1 | 0.26mi |
| 101 Springfield Ln Madison, AL | 3.0 | 2.0 | 1640 | $2,350 | $1.43 | 43d | 1 | 0.40mi |
| 121 Betty Garrett Dr Madison, AL | 4.0 | 2.0 | 1841 | $2,000 | $1.09 | 43d | 1 | 0.43mi |
| 115 Betty Garrett Dr Madison, AL | 4.0 | 2.0 | 1841 | $2,090 | $1.14 | 23d | 1 | 0.44mi |
| 112 Betty Garrett Dr Madison, AL | 4.0 | 2.0 | 1841 | $2,049 | $1.11 | 43d | 1 | 0.47mi |
| 200 Millstone Ln Madison, AL | 3.0 | 2.0 | 1425 | $2,000 | $1.40 | 43d | 1 | 0.48mi |
| 245 Pineridge Rd Madison, AL | 3.0 | 2.0 | 1812 | $2,000 | $1.10 | 43d | 1 | 0.51mi |
| 103 Betty Garrett Dr Madison, AL | 4.0 | 2.0 | 1537 | $2,600 | $1.69 | 43d | 1 | 0.51mi |
| 1006 Wood Cir Madison, AL | 3.0 | 2.0 | 2173 | $1,899 | $0.87 | 43d | 1 | 0.52mi |
| 180 Hughes Rd Madison, AL | 1.0–4.0 | 1.0–3.5 | 1373 | $2,250 | $1.64 | 14d | 45 | 0.55mi |
| 1105 Woodbine Rd Madison, AL | 3.0 | 1.5 | 1254 | $1,500 | $1.20 | 23d | 1 | 0.67mi |
| 102 Acacia Trail Dr Madison, AL | 3.0 | 2.0 | 2005 | $2,000 | $1.00 | 21d | 1 | 0.73mi |
| 1016 Seina Vista Dr Madison, AL | 3.0 | 2.0 | 1981 | $2,100 | $1.06 | 14d | 1 | 0.75mi |
| 425 Falls PT SW Unit 1 Madison, AL | 3.0 | 3.0 | 1375 | $1,615 | $1.17 | 43d | 1 | 0.80mi |
| 134 Michli Rd Madison, AL | 2.0 | 2.5 | 1564 | $1,595 | $1.02 | 43d | 1 | 0.95mi |
| 128 Michli Rd Madison, AL | 2.0 | 3.0 | 1564 | $1,550 | $0.99 | 43d | 1 | 0.96mi |
| 105 Whisperbrook Cir Madison, AL | 3.0 | 2.0 | 1608 | $1,800 | $1.12 | 23d | 1 | 0.97mi |
| 4286 Sullivan St Madison, AL | 3.0 | 2.0 | 1815 | $2,100 | $1.16 | 21d | 1 | 1.01mi |
| 7900 Old Madison Pike Madison, AL | 2.0–4.0 | 1.0–2.5 | 1313 | $1,445 | $1.10 | 14d | 11 | 1.01mi |
| 2002 Flagstone Dr Madison, AL | 1.0–3.0 | 1.0–2.0 | 973 | $1,544 | $1.59 | 14d | 77 | 1.03mi |
| 2300 Colonial Lake Dr Madison, AL | 1.0–3.0 | 1.0–2.0 | 1083 | $1,338 | $1.23 | 14d | 39 | 1.03mi |
| 722 Highland Dr Madison, AL | 3.0 | 2.5 | 1938 | $1,750 | $0.90 | 14d | 1 | 1.05mi |
| 114 Telluride Dr Madison, AL | 3.0 | 2.0 | 1578 | $1,795 | $1.14 | 43d | 1 | 1.12mi |
| 129 Telluride Dr Madison, AL | 3.0 | 2.0 | 1912 | $1,885 | $0.99 | 23d | 1 | 1.13mi |
| 85 Shorter St Madison, AL | 3.0 | 1.0–3.0 | 1182 | $1,799 | $1.52 | 43d | 13 | 1.26mi |
| 128 Lewis Ln Madison, AL | 3.0 | 2.0 | 1680 | $1,700 | $1.01 | 43d | 1 | 1.34mi |
| 227 Park Stone Dr Madison, AL | 4.0 | 2.5 | 2516 | $2,300 | $0.91 | 23d | 1 | 1.35mi |
| 133 Lewis Ln Madison, AL | 3.0 | 2.0 | 1547 | $1,945 | $1.26 | 43d | 1 | 1.37mi |
| 240 Stadium Way Madison, AL | 1.0–2.0 | 1.0–2.0 | 995 | $1,690 | $1.70 | 14d | 29 | 1.38mi |
| 202 High Rd Madison, AL | 3.0 | 2.5 | 1759 | $2,375 | $1.35 | 23d | 1 | 1.41mi |
| 106 Teal Park Ln Madison, AL | 3.0 | 2.0 | 1707 | $1,950 | $1.14 | 14d | 1 | 1.47mi |
| 286 Slaughter Rd NW Madison, AL | 1.0–3.0 | 1.0–3.0 | 1385 | $2,199 | $1.59 | 13d | 31 | 1.48mi |
| 1 Madison Park Dr Madison, AL | 1.0–3.0 | 1.0–2.0 | 1149 | $2,157 | $1.88 | 13d | 18 | 1.49mi |
Listing history 2 events
-
2026-05-22status Pending
-
2026-05-20$349,900 Active
ⓘ Source: listings_history table (triggers on properties + properties_extension) + one-shot
backfill from property_details.listing_events for pre-trigger history.
Tax reassessment forecast AL · Resets to sale price
- Current annual tax
- $1,438 · $120/mo
- Projected year-2 tax
- $1,438 · $120/mo
- Expected delta
- $0/yr ($0/mo · 0.0%)
ⓘ Screening estimate from a state-policy table — verify with the county assessor before closing.
Climate risk First Street
- Flood 1/10 Low FEMA zone X (unshaded) · 0% chance over 30 yrs
- Wildfire 1/10 Low
- Heat 5/10 Major 7 d/yr ≥106°F today · 18 d/yr by 30 yrs out
- Wind 4/10 Moderate 19% chance of damaging wind over 30 yrs
- Air quality 2/10 Low 0 unhealthy d/yr today · 2 by 30 yrs out
Nearby sold comps map
Loading sold comps map…
Walkable amenities ~0.75 mi
Loading nearby amenities…
Taxation est. · year 1
- Rental income
- $22,578
- − Mortgage interest
- −$19,600
- − Property taxes
- −$1,438
- − Insurance
- −$1,750
- − Repairs & maintenance
- −$1,806
- − Management
- −$1,806
- − Depreciation
- −$10,179
- Taxable loss
- −$14,001
- Est. tax savings @ 24.0%
- +$3,360
- After-tax cash flow
- $-4,010/yr
For passive investors: Depreciation is non-cash, so a rental often shows a tax loss while cash-flowing — sheltering income. Rental losses are passive: they offset passive income freely, and up to $25,000/yr can offset ordinary (W-2) income if you actively participate and your MAGI is under $100k (phasing out to $0 by $150k); unused losses carry forward. On sale, claimed depreciation is recaptured at up to 25%, and gains may owe capital-gains tax (a 1031 exchange can defer both). Figures are a year-1 estimate at your 24.0% rate — not tax advice; consult a CPA.
Schools (NCES district)
- District
- Madison City
- NCES district ID
- 0100008
- Math proficiency
- 51% ▼ -25.00%
- Reading proficiency
- 71% ▼ -2.00%
- Median HH income
- $89,091
- Composite
- 55.56/100
- National rank
- #1238
- State rank
- #4 of 129 in AL
Livability — Madison
- Score
- 76/100
- State rank
- #12
- US rank
- #3280
Category grades
Schools grade is shown separately in the Schools card above.
Census & demographics
- Census place
- Madison, AL
- County
- Madison County · 380,832 people
- City population
- 93,742
- Metro
- Huntsville, AL
- Population (ZIP)
- 50,266
- Household income
- $117,380
- Rent vs Own
- Severe rent burden
- 875.0
Population outlook (Madison County) Hauer SSP2
- Today (2025)
- 392,086 people
- By 2030
- 409,788 · +4.5%
- By 2040
- 440,557 · +12.4%
- By 2050
- 460,990 · +17.6%
- By 2075
- 502,872 · +28.3%
- By 2100
- 513,623 · +31.0%
Race, ethnicity, and origin ACS 2023
- Neighborhood character
- Predominantly White (68%)
- Race & ethnicity
- White 68% Black 14% Hispanic / Latino 8% Asian 7% Two or more races 7%
- Hispanic origin (detail)
- Mexican 3% Puerto Rican 2%
- Common ancestry
- Slovak 3% Italian 2% Lithuanian 2%
- Foreign-born
- 9% · Canada, South Korea, Vietnam
- Languages at home
- 87% English-only · Spanish 5% Other Asian/Pacific 2% Chinese 1%
Political lean MEDSL · Madison
- 2024 margin
- Lean R (+9.0) · D 44.7% · R 53.7% · Other 1.6%
- 2008→2024 swing
- +6.0pp toward D · 2008: -14.9pp · 2024: -9.0pp
- All cycles
- 2024: R+9.0 2020: R+8.0 2016: R+16.8 2012: R+18.7 2008: R+14.9
Not yet ingested
- Civics
- —
Market trends
- HPI YoY
- ▲ 14.46%
- Current HPI
- 355.2784
- Rent YoY
- ▲ 1.58%
- Metro
- Huntsville, AL
- State GDP YoY
- ▲ 2.94%
- F500 in state
- 4
Industry mix (Fortune 500 HQ in AL)
| Industry | F500 HQs | Revenue |
|---|---|---|
| Financial Services | 1 | $8B |
|
||
| Healthcare | 1 | $5B |
|
||
Price history
2 events — show timeline
- 2026-05-22 Pending — VMLS
- 2026-05-20 Listed $349,900 VMLS
Property tax history
-2.6%/yrLatest (2024): $1,438 · +2.1% YoY. Source: county tax records.
Cash-flow waterfall
monthlySold comps — $/sqft
last 12 mo · ≤1 miLoading sold comps…