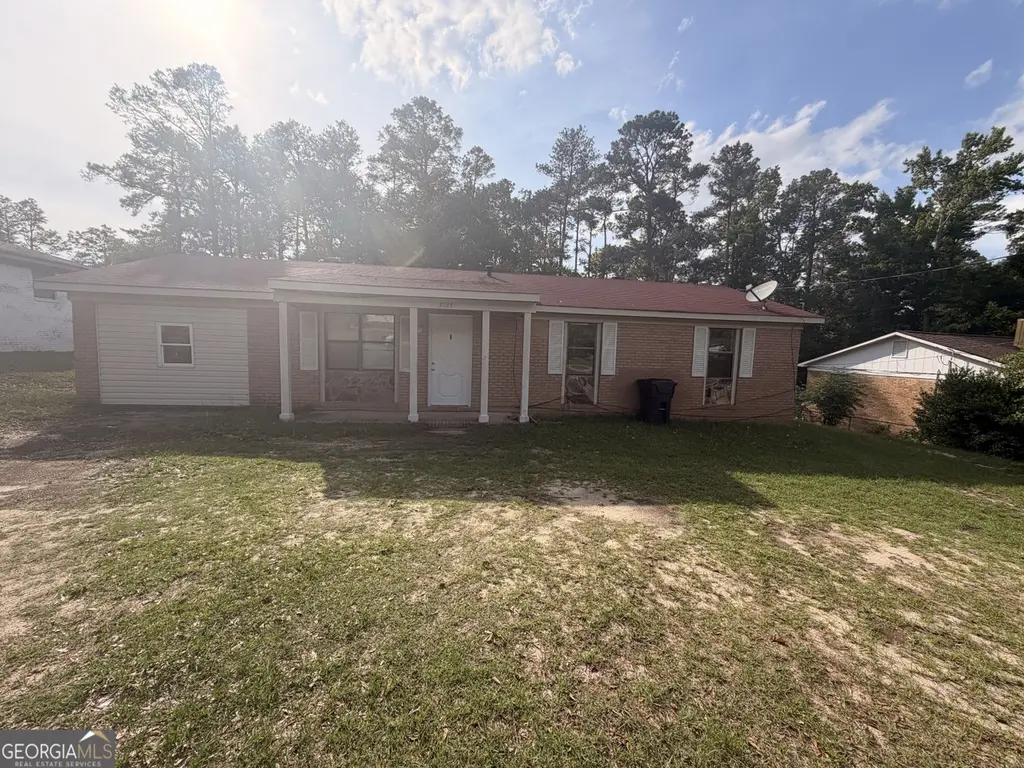
3523 Morgan Rd · Augusta-Richmond County consolidated government (balance), GA
Flood risk 1/10 · Minimal
- FEMA flood zone
- X (unshaded)
- Chance of flooding over 30 yrs
- 0.0%
- Est. flood insurance / yr
- $507 – $1,088
Fire risk 4/10 · Minor
- Est. fire insurance / yr
- $963 – $1,789
Heat risk 7/10 · Major
- Hot days now (above 107°F)
- 7 days/yr
- Hot days in 30 yrs
- 17 days/yr
Wind risk 6/10 · Moderate
- Chance of severe wind over 30 yrs
- 66.0%
Air-quality risk 3/10 · Minor
- Unhealthy air days now
- 3 days/yr
- Unhealthy air days in 30 yrs
- 3 days/yr
Risk factors via First Street. Map © Google.
Why this score? — see what drove the C+ grade
The composite is a weighted blend of 9 inputs, each scored 0–100. Each bar is that input's sub-score; the figure is the points it added to the 100-point composite (weight × sub-score).
- Cash flow +23.9/30.0
- ARV discount +15.0/15.0
- DSCR +7.7/10.0
- 1% rule +6.2/10.0
- Livability +2.5/5.0
- Condition / age +2.5/5.0
- Rent growth +2.3/5.0
- Schools +1.3/10.0
- Appreciation +0.0/10.0
$140,000
🖨 Deal sheet 📄 Offer letter ✓ Due diligence
Listing remarks MLS
HUD home sold as is, www. bestassets.net for bid info. FHA Insurable w/ escrow of $3710. on this home. Accessible with HUD key. FHA#101-928086
Key facts
- 0.46 acre lot
- Garage
- Built 1985
Property features AI
Finance
- Other: Property condition: resale; Approximate lot size 0.46 acres
- HOA & community: No HOA; No association fees
Exterior
- Parking: Attached garage / parking
- Utilities: Public water; Septic tank sewer; Other utilities
- Home design: Single-family residence; Residential property; Built in 1985; One story
- Construction: Built in 1985; Composition roof; Other construction materials
- Exterior features: Composition roof; Other construction materials; Lot features listed as other
Interior
- Kitchen: Other appliances
- Bedrooms: 3 bedrooms on the main level
- Flooring: Other flooring
- Bathrooms: 2 full bathrooms on the main level
- Heating & cooling: Central heating; Central air conditioning
- Interior features: One-level layout; Fireplace (1); Other interior features
- Laundry & utility: Other laundry features
Neighborhood map
What this means for you Summary
Snapshot
- This is a 3-bed/2.0-bath single-family listed at $140k.
Deal economics
- At list price, monthly cash flow is $273 ($3k/yr) — positive.
- The deal already cash-flows at list — no discount required.
- Meets the 1% rule at list price ($2k rent vs $140k).
- Recommended offer: $138k (1.5% below list) — sets the bar for market timing.
- Cap rate 8.6% vs local median 5.3% in Augusta-Richmond County consolidated government (balance) — top-decile yield for the area; either an underpriced asset or a hidden risk that comps aren't pricing in. Stress-test before assuming the spread holds.
Location & tenants
- Location reads: area grade C — affects rentability + tenant quality, not the cash-flow math above.
- Richmond County (urban): math 12% / reading 20% proficiency, ranked #154 of 174 in GA (top 88%) — low school quality limits family demand, transient renter base, plan for 1-2y turnover; 72% free/reduced lunch — lower-income household profile, screen leases tightly.
- Zoned schools: Glenn Hills Middle School (math 2% / reading 6%, grade F, #467 of 470 statewide, top 99%, 762 students, 98% FRL); Glenn Hills High School (math 2% / reading 2%, grade F, #421 of 424 statewide, top 100%, 883 students, 98% FRL) — zoned schools average 98% FRL vs 72% district-wide (26 pts higher); higher-poverty schools than district average — tighter screening recommended.
- Zoned-school proficiency averages 3% at this address vs 16% district-wide (-13 pts) — the specific schools serving this property underperform the Richmond County average; the district grade overstates school quality for this exact location.
- Market conditions: Rents soft (-0.7%/yr); 359 active listings in the ZIP; 20 comparable units currently listed for rent nearby; rentals at typical pace (median 23d on market — plan ~3-4 weeks tenant-placement turnaround); 45% of comp listings sitting > 30 days — soft ceiling on asking rent; 561 units permitted in Richmond County in 2024 (0 in 5+ unit buildings).
Forward outlook
- Local home prices are declining (-3.0%/yr); year-one equity from $968 of loan paydown is wiped out by about $4k of value loss. Plan a longer hold.
- Richmond County population projected to shrink 5% by 2050 — rents likely to lag national; underwrite the cash flow, not the appreciation.
Negotiation context
- It's been on market 20 days — a 2% lower offer ($138k) is reasonable based on typical stale-listing flexibility.
- 5 sale attempts since 23y ago with the ask held roughly flat each time — persistent listings suggest the price (not the market) is what's stuck; bring a comps-based counter.
- Current owner paid $53k; list at $140k implies a 162% gain — meaningful room to come down on a strong offer.
Risks & watch-outs
- Climate carrying-cost: major wind risk, 66% chance of damaging wind over 30y; extreme-heat days projected 7→17/yr by 2055 (HVAC capex compounding) — expect insurance premiums to compound above CPI over the hold.
Questions for the listing agent
- Is there a deadline driving the sale (1031 exchange, divorce, estate, relocation)? That informs how much negotiation room exists.
- What's the average days-on-market for RENTAL listings here right now (not sales)? A rising rental-DOM trend means longer vacancies and softer asking-rent achievability than the comps imply.
- What's the recent tenant-quality profile in this submarket — average credit score on applications, eviction rate, late-payment / NSF rate, and stable-employment percentage? A property-management company in the area should have these aggregated.
- How much new for-sale + rental construction is in the pipeline within 1–3 miles? Heavy new supply typically softens prices + rents 12–24 months out; constrained supply supports both.
Investment metrics
- 1% rule
- 1.12% ✓
- Cap rate
- 8.63%
- Cash-on-cash
- 8.34%
- DSCR
- 1.37
- GRM
- 7.5
CMA / ARV
- ARV (on-the-fly)
- $196,625
- Comps found
- 12
Show comp detail 12 sales within ~0.75 mi
| Address | Dist | Beds/Ba | Sqft | Sold | Price | $/sf | Match |
|---|---|---|---|---|---|---|---|
| 3503 Edgeworth Dr | 0.33mi | 3/2.0 | 1,350 (-2%) | 5mo | $179,900 | $133 | 77 |
| 3627 Pebble Creek Dr | 0.34mi | 3/2.0 | 1,296 (-6%) | 2mo | $226,000 | $174 | 73 |
| 3629 Pebble Creek Dr | 0.33mi | 3/2.0 | 1,296 (-6%) | 3mo | $222,000 | $171 | 72 |
| 3409 Saddle Horn Run | 0.33mi | 3/2.0 | 1,436 (+4%) | 6mo | $169,900 | $118 | 72 |
| 4105 Darsey Ct | 0.28mi | 3/2.0 | 1,250 (-9%) | 1mo | $210,000 | $168 | 71 |
| 4004 Rambling Way | 0.26mi | 3/2.0 | 1,221 (-11%) | 6mo | $212,500 | $174 | 65 |
| 3623 Pebble Creek Dr | 0.36mi | 3/2.0 | 1,221 (-11%) | 2mo | $217,000 | $178 | 63 |
| 3332 Saddlebrook Dr Dr | 0.50mi | 3/2.0 | 1,460 (+6%) | 4mo | $169,500 | $116 | 63 |
| 3326 Saddlebrook Dr | 0.52mi | 3/2.0 | 1,257 (-9%) | 7mo | $147,000 | $117 | 56 |
| 2818 Cranbrook Dr | 0.51mi | 3/2.0 | 1,227 (-11%) | 6mo | $175,000 | $143 | 53 |
| 3018 Shady Ln | 0.67mi | 3/2.0 | 1,234 (-10%) | 1mo | $169,000 | $137 | 51 |
| 2912 Butler Manor Dr | 0.74mi | 3/1.5 | 1,274 (-7%) | 5mo | $80,000 | $63 | 47 |
Match score weights: distance 35% · size 25% · config 20% · recency 20%. Top-matched comps best support the ARV.
Projected returns pro-forma
-3.0% appreciation · 0.0% rent growth · sell at horizon
- IRR
- -7.0%
- Equity multiple
- 0.75×
- Total profit
- $-9,888
- Equity at exit
- $20,874
- IRR
- -1.7%
- Equity multiple
- 0.90×
- Total profit
- $-3,873
- Equity at exit
- $12,105
Cash invested: $39,200 (down + closing). Projections, not guarantees.
Landlord ↔ Tenant lean methodology
- Overall (STATE)
- 90 Strongly Landlord-Friendly
- State Georgia
- 90 Strongly Landlord-Friendly · R+3
- County
- — inherits STATE
- City
- — inherits STATE
ZIP-level market 30815
- Home prices YoY
- -24.2%
- Rents YoY
- -0.7%
- Active inventory
- 359
- Price-to-rent
- 7.5×
Monthly cashflow live
- Estimated rent
- $1,562 high interval (Pro) →
- Mortgage (P&I)
- −$734
- Tax from tax record
- −$169 /mo · $2,030/yr
- Insurance
- −$58
- HOA
- −$0
- Vacancy / Maint / Mgmt
- −$328
- Net cashflow
- $273
Break-even live
UW: 25.0% down · 7.5% · 30yr · 1.5% tax · 5.0% vac · 8.0% maint · 8.0% mgmt
Financing live
Cash to close
- Down payment
- $35,000
- Closing costs
- $4,200
- Reserves months
- —
- Total cash needed
- —
Loan-product check · same deal, 3 products live
Conventional
25% down · 7.5% · 30yr
- Down + closing
- —
- Monthly P&I
- —
- Monthly cashflow
- —
- DSCR
- —
- Eligible?
- —
Personal DTI + credit; lowest rate.
DSCR
20% down · 8.5% · 30yr
- Down + closing
- —
- Monthly P&I
- —
- Monthly cashflow
- —
- DSCR
- —
- Eligible?
- —
No personal income docs; deal must DSCR.
Hard money
10% down · 12.0% · 12mo
- Down + closing
- —
- Monthly P&I
- —
- Monthly cashflow
- —
- DSCR
- —
- Eligible?
- —
Short-term bridge; refi at stabilization.
Rent comps 20 comps
| Address | Beds | Baths | Sqft | Rent | $/sqft | DOM | Units | Dist |
|---|---|---|---|---|---|---|---|---|
| 2817 Ridgecrest Dr Hephzibah, GA | 4.0 | 2.0 | 1257 | $1,495 | $1.19 | 43d | 1 | 0.22mi |
| 3524 Edgeworth Dr Hephzibah, GA | 3.0 | 2.0 | 1200 | $1,295 | $1.08 | 23d | 1 | 0.27mi |
| 3543 Windermere Dr Hephzibah, GA | 4.0 | 2.0 | 1394 | $1,550 | $1.11 | 23d | 1 | 0.41mi |
| 3543 Windermere Dr Hephzibah, GA | 4.0 | 2.0 | 1394 | $1,550 | $1.11 | 43d | 1 | 0.41mi |
| 2834 Brentway Dr Hephzibah, GA | 3.0 | 2.0 | 1475 | $1,600 | $1.08 | 43d | 1 | 0.49mi |
| 1010 Horizon Ridge Dr Hephzibah, GA | 1.0–3.0 | 1.0–2.0 | 936 | $1,196 | $1.28 | 13d | 1 | 0.60mi |
| 2803 Ptarmigan Rd Hephzibah, GA | 3.0 | 2.0 | 1377 | $1,600 | $1.16 | 23d | 1 | 0.66mi |
| 2803 Ptarmigan Rd Hephzibah, GA | 3.0 | 2.0 | 1400 | $1,600 | $1.14 | 43d | 1 | 0.66mi |
| 2727 Barclay St Hephzibah, GA | 4.0 | 2.0 | 1430 | $1,234 | $0.86 | 43d | 1 | 0.84mi |
| 2704 Cranbrook Dr Hephzibah, GA | 3.0 | 2.0 | 1377 | $1,650 | $1.20 | 43d | 1 | 0.95mi |
| 2813 Leawood Ct Hephzibah, GA | 3.0 | 2.0 | 1377 | $1,250 | $0.91 | 43d | 1 | 1.02mi |
| 3032 Tobacco Rd Hephzibah, GA | 2.0 | 1.0 | 960 | $1,315 | $1.37 | 23d | 1 | 1.12mi |
| 2604 Edmonton Ct Hephzibah, GA | 3.0 | 2.0 | 1343 | $1,190 | $0.89 | 13d | 1 | 1.17mi |
| 3532 Edmonton St Hephzibah, GA | 3.0 | 2.0 | 1377 | $1,425 | $1.03 | 43d | 1 | 1.19mi |
| 3532 Edmonton St Hephzibah, GA | 3.0 | 2.0 | 1377 | $1,425 | $1.03 | 23d | 1 | 1.19mi |
| 3613 Alene Cir Augusta, GA | 3.0 | 2.0 | 1260 | $1,325 | $1.05 | 13d | 1 | 1.34mi |
| 3883 Crest Dr Hephzibah, GA | 3.0 | 2.0 | 1380 | $3,600 | $2.61 | 13d | 1 | 1.37mi |
| 3001 Alene Ct Augusta, GA | 4.0 | 2.0 | 1288 | $1,631 | $1.27 | 23d | 1 | 1.39mi |
| 3881 Crest Dr Hephzibah, GA | 3.0 | 2.0 | 1400 | $1,595 | $1.14 | 13d | 1 | 1.39mi |
| 2614 Andorra Dr Hephzibah, GA | 3.0 | 2.0 | 1622 | $1,395 | $0.86 | 43d | 1 | 1.41mi |
Listing history 15 events
-
2026-06-18days on market $140,000 Active 20 DOM
-
2026-06-17days on market $140,000 Active 19 DOM
-
2026-06-16days on market $140,000 Active 18 DOM
-
2026-06-15days on market $140,000 Active 17 DOM
-
2026-06-14statusdays on market $140,000 Active 15 DOM
-
2026-06-10days on market $140,000 New 12 DOM
-
2026-06-09days on market $140,000 New 11 DOM
-
2026-06-08days on market $140,000 New 10 DOM
-
2026-06-07days on market $140,000 New 9 DOM
-
2026-06-03days on market $140,000 New 5 DOM
-
2026-06-02days on market $140,000 New 4 DOM
-
2026-06-01days on market $140,000 New 3 DOM
-
2026-05-31days on market $140,000 New 2 DOM
-
2026-05-30remarks 462-char remark
-
2026-05-30$140,000 New 1 DOM
ⓘ Source: listings_history table (triggers on properties + properties_extension) + one-shot
backfill from property_details.listing_events for pre-trigger history.
Tax reassessment forecast GA · Resets to sale price
- Current annual tax
- $2,030 · $169/mo
- Projected year-2 tax
- $2,030 · $169/mo
- Expected delta
- $0/yr ($0/mo · 0.0%)
ⓘ Screening estimate from a state-policy table — verify with the county assessor before closing.
Climate risk First Street
- Flood 1/10 Low FEMA zone X (unshaded) · 0% chance over 30 yrs
- Wildfire 4/10 Moderate
- Heat 7/10 Severe 7 d/yr ≥107°F today · 17 d/yr by 30 yrs out
- Wind 6/10 Major 66% chance of damaging wind over 30 yrs
- Air quality 3/10 Moderate 3 unhealthy d/yr today · 3 by 30 yrs out
Nearby sold comps map
Loading sold comps map…
Walkable amenities ~0.75 mi
Loading nearby amenities…
Taxation est. · year 1
- Rental income
- $18,747
- − Mortgage interest
- −$7,842
- − Property taxes
- −$2,030
- − Insurance
- −$700
- − Repairs & maintenance
- −$1,500
- − Management
- −$1,500
- − Depreciation
- −$4,073
- Taxable income
- $1,103
- Est. tax owed @ 24.0%
- −$265
- After-tax cash flow
- $3,006/yr
For passive investors: Depreciation is non-cash, so a rental often shows a tax loss while cash-flowing — sheltering income. Rental losses are passive: they offset passive income freely, and up to $25,000/yr can offset ordinary (W-2) income if you actively participate and your MAGI is under $100k (phasing out to $0 by $150k); unused losses carry forward. On sale, claimed depreciation is recaptured at up to 25%, and gains may owe capital-gains tax (a 1031 exchange can defer both). Figures are a year-1 estimate at your 24.0% rate — not tax advice; consult a CPA.
Schools (NCES district)
- District
- Richmond County
- NCES district ID
- 1304380
- Math proficiency
- 12% ▼ -9.00%
- Reading proficiency
- 20% ▼ -6.00%
- Median HH income
- $38,069
- Composite
- 13.43/100
- National rank
- #9524
- State rank
- #154 of 174 in GA
Livability — Augusta-Richmond County consolidated government (balance)
No livability data for this city. (Only ~50 U.S. cities are tracked.)
Census & demographics
- Census place
- Augusta-Richmond County consolidated government (balance), GA
- County
- Richmond County · 190,917 people
- City population
- 154,035
- Metro
- Augusta-Richmond County, GA-SC
- Population (ZIP)
- 44,109
- Household income
- $70,202
- Rent vs Own
- Severe rent burden
- 867.0
Population outlook (Richmond County) Hauer SSP2
- Today (2025)
- 200,753 people
- By 2030
- 200,232 · -0.3%
- By 2040
- 196,813 · -2.0%
- By 2050
- 190,347 · -5.2%
- By 2075
- 172,496 · -14.1%
- By 2100
- 146,284 · -27.1%
Race, ethnicity, and origin ACS 2023
- Neighborhood character
- Majority Black (62%)
- Race & ethnicity
- Black 62% White 27% Two or more races 5% Hispanic / Latino 4%
- Foreign-born
- 4% · Canada, South Korea
- Languages at home
- 93% English-only · Spanish 3% Other Indo-European 1% Korean 1%
Political lean MEDSL · Richmond
- 2024 margin
- Solid D (+36.1) · D 67.8% · R 31.7%
- 2008→2024 swing
- +4.3pp toward D · 2008: 31.8pp · 2024: 36.1pp
- All cycles
- 2024: D+36.1 2020: D+37.2 2016: D+32.4 2012: D+33.8 2008: D+31.8
Not yet ingested
- Civics
- —
Market trends
- HPI YoY
- ▼ -51.74%
- Current HPI
- 162.4074
- Rent YoY
- ▼ -0.71%
- Metro
- Augusta-Richmond County, GA-SC
- State GDP YoY
- ▲ 2.66%
- F500 in state
- 28
Industry mix (Fortune 500 HQ in GA)
| Industry | F500 HQs | Revenue |
|---|---|---|
| Paper / Packaging | 2 | $29B |
|
||
| Retail | 1 | $160B |
|
||
| Transportation / Logistics | 1 | $91B |
|
||
| Airlines | 1 | $62B |
|
||
| Consumer Goods | 1 | $47B |
|
||
| Utilities | 1 | $25B |
|
||
Price history
+141.4% since first listed11 events — show timeline
- 2026-05-29 Listed $140,000 GAMLS
- 2026-02-13 Price Changed $58,000 Hive MLS
- 2021-02-10 Sold (MLS) $53,380 Hive MLS
- 2020-10-23 Listed $1,250,000 Hive MLS
- 2010-08-05 Sold (MLS) $36,000 Hive MLS
- 2010-08-05 Sold (MLS) $36,000 Hive MLS
- 2010-06-01 Listed $42,000 Hive MLS
- 2010-06-01 Listed $42,000 Hive MLS
- 2003-09-22 Sold (MLS) $53,380 Hive MLS
- 2003-09-22 Sold (MLS) $53,380 Hive MLS
- 2003-06-06 Listed $58,000 Hive MLS
Property tax history
+4.1%/yrLatest (2025): $2,030 · +8.0% YoY. Source: county tax records.
Cash-flow waterfall
monthlySold comps — $/sqft
last 12 mo · ≤1 miLoading sold comps…