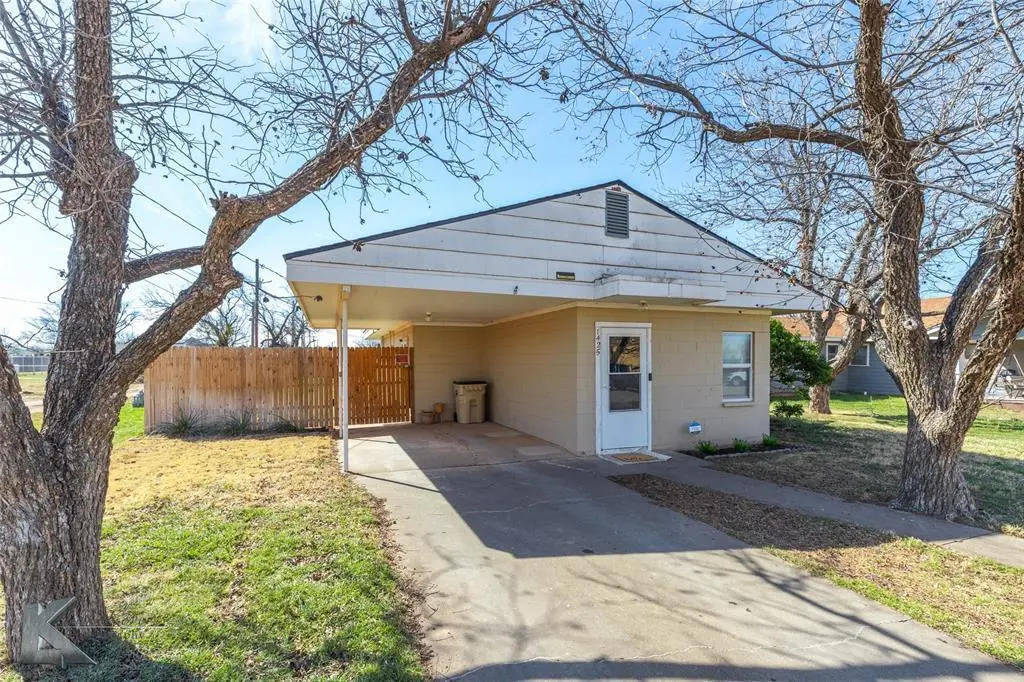
1425 12th St · Anson, TX
Flood risk No data
- FEMA flood zone
- —
- Chance of flooding over 30 yrs
- —
- Est. flood insurance / yr
- —
Fire risk No data
- Est. fire insurance / yr
- —
Heat risk No data
- Hot days now (above threshold)
- —
- Hot days in 30 yrs
- —
Wind risk No data
- Chance of severe wind over 30 yrs
- —
Air-quality risk No data
- Unhealthy air days now
- —
- Unhealthy air days in 30 yrs
- —
Risk factors via First Street. Map © Google.
Why this score? — see what drove the B+ grade
The composite is a weighted blend of 9 inputs, each scored 0–100. Each bar is that input's sub-score; the figure is the points it added to the 100-point composite (weight × sub-score).
- Cash flow +30.0/30.0
- 1% rule +10.0/10.0
- DSCR +10.0/10.0
- ARV discount +7.5/15.0
- Appreciation +7.1/10.0
- Livability +3.5/5.0
- Schools +2.8/10.0
- Rent growth +2.5/5.0
- Condition / age +2.5/5.0
$105,000
🖨 Deal sheet (PDF) 📄 Offer letter ✓ Due diligence
Listing remarks
Charming Remodeled 1-Bedroom Home on Spacious Quarter-Acre Lot Welcome to this beautifully remodeled 1-bedroom, 1-bath home, offering charm and modern updates on a generous ¼-acre lot. The open-concept layout creates a bright and inviting living space, complemented by updated windows and storm doors that bring in plenty of natural light. The kitchen boasts stainless steel appliances, perfect for cooking enthusiasts. Major upgrades include a Class 4 roof , water heater, Electrical and HVAC updates, ensuring peace of mind for years to come. Enjoy a large fenced backyard, complete with irrigation in the front and back, and the backyard irrigation system running off well water(with newe
Key facts
- Updated windows
- Class 4 roof
- Water heater
Tags
Property features AI
Finance
- Other: Survey available; Verify tax exemptions; Possession at closing/funding; Special listing conditions: Standard
- Financial info: Listing terms: Cash; No second mortgage indicated
- HOA & community: No HOA
Exterior
- Parking: Covered carport (1 covered space); Driveway parking; 1 carport space
- Security: Audio and video surveillance present (cameras and doorbell excluded from sale)
- Utilities: City sewer; City water; Well
- Home design: Single-family residence; One story; Residential property
- Construction: Built in 1962; Block and other construction materials; Slab foundation; Composition roof
- Exterior features: Large backyard with grass; Sprinkler system; Storage shed(s)
Interior
- Kitchen: Dishwasher; Electric range; Microwave
- Bedrooms: 1 bedroom (Primary bedroom on level 1)
- Flooring: Tile flooring
- Bathrooms: 1 full bathroom
- Heating & cooling: Central heating; Central air conditioning
- Interior features: Open floorplan; Eat-in kitchen; 1 living area; 2 total rooms
- Laundry & utility: Well water (on-site water source noted)
Neighborhood map
What this means for you Summary
Snapshot
- This is a 1-bed/1.0-bath single-family listed at $105k.
Deal economics
- At list price, monthly cash flow is $1k ($14k/yr) — positive.
- The deal already cash-flows at list — no discount required.
- Meets the 1% rule at list price ($2k rent vs $105k).
- Recommended offer: $103k (1.5% below list) — sets the bar for market timing.
Location & tenants
- Location reads 70/100 on livability (#377 in TX) — a middle-class / working-renter tenant base. Strengths: crime A+, cost of living A+, housing A-; Watch: health & safety C-, employment D, amenities F.
- Anson ISD (rural): math 29% / reading 37% proficiency, ranked #565 of 826 in TX (top 68%) — families likely to look elsewhere, expect single-tenant / working-renter base with shorter leases.
- Zoned schools: Anson El (math 17% / reading 32%, grade F, #3,052 of 4,322 statewide, top 74%, 368 students, 68% FRL).
- Market conditions: 73 active listings in the ZIP; 1 units permitted in Jones County in 2024 (0 in 5+ unit buildings).
Forward outlook
- In year one you build about $5k of equity ($726 loan paydown + $4k appreciation (4.1% local appreciation)).
- Jones County population projected at +13% by 2050 — modest demand growth; plan on rents tracking national, not racing it.
- At projected returns (4.1% appreciation + 3.0% rent growth), your $29k cash investment doubles in ~2 years — after that, you're playing with house money.
- By year 7, paydown + projected appreciation supports a ~$32k cash-out refi (75% LTV) — recoverable capital for the next deal without selling this one.
Negotiation context
- It's been on market 17 days — a 2% lower offer ($103k) is reasonable based on typical stale-listing flexibility.
- 4 sale attempts with the ask held roughly flat each time — persistent listings suggest the price (not the market) is what's stuck; bring a comps-based counter.
Questions for the listing agent
- Built in 1962 — when were the roof, HVAC, electrical panel, plumbing, and water heater last replaced?
- Is there a deadline driving the sale (1031 exchange, divorce, estate, relocation)? That informs how much negotiation room exists.
- Schools are D-rated, which usually means shorter tenancies and higher turnover. Who's the typical renter profile here, and what's been the actual vacancy rate?
- What's the average days-on-market for RENTAL listings here right now (not sales)? A rising rental-DOM trend means longer vacancies and softer asking-rent achievability than the comps imply.
- What's the recent tenant-quality profile in this submarket — average credit score on applications, eviction rate, late-payment / NSF rate, and stable-employment percentage? A property-management company in the area should have these aggregated.
- How much new for-sale + rental construction is in the pipeline within 1–3 miles? Heavy new supply typically softens prices + rents 12–24 months out; constrained supply supports both.
Investment metrics
- 1% rule
- 2.35% ✓
- Cap rate
- 19.56%
- Cash-on-cash
- 47.38%
- DSCR
- 3.11
- GRM
- 3.5
CMA / ARV
No comps found within radius.
Projected returns pro-forma
4.13% appreciation · 3.0% rent growth · sell at horizon
- IRR
- 54.1%
- Equity multiple
- 4.17×
- Total profit
- $93,081
- Equity at exit
- $54,045
- IRR
- 52.6%
- Equity multiple
- 8.49×
- Total profit
- $220,316
- Equity at exit
- $89,045
Cash invested: $29,400 (down + closing). Projections, not guarantees.
Landlord ↔ Tenant lean methodology
- Overall (STATE)
- 87 Strongly Landlord-Friendly
- State Texas
- 87 Strongly Landlord-Friendly · R+5
- County
- — inherits STATE
- City
- — inherits STATE
ZIP-level market 79501
- Home prices YoY
- 2.9%
- Active inventory
- 73
- Price-to-rent
- 3.5×
Monthly cashflow live
- Estimated rent
- $2,472 medium interval (Pro) →
- Mortgage (P&I)
- −$551
- Tax from tax record
- −$197 /mo · $2,370/yr
- Insurance
- −$44
- HOA
- −$0
- Vacancy / Maint / Mgmt
- −$519
- Net cashflow
- $1,161
Break-even live
Sensitivity live
| Price | -10% $1,220 | -5% $1,191 | +0% $1,161 | +5% $1,131 | +10% $1,101 |
|---|---|---|---|---|---|
| Rent | -10% $966 | -5% $1,063 | +0% $1,161 | +5% $1,258 | +10% $1,356 |
| Rate | -1.0pp $1,214 | -0.5pp $1,188 | base $1,161 | +0.5pp $1,134 | +1.0pp $1,106 |
UW: 25.0% down · 7.5% · 30yr · 1.5% tax · 5.0% vac · 8.0% maint · 8.0% mgmt
Financing live
Cash to close
- Down payment
- $26,250
- Closing costs
- $3,150
- Reserves months
- —
- Total cash needed
- —
Loan-product check · same deal, 3 products live
Conventional
25% down · 7.5% · 30yr
- Down + closing
- —
- Monthly P&I
- —
- Monthly cashflow
- —
- DSCR
- —
- Eligible?
- —
Personal DTI + credit; lowest rate.
DSCR
20% down · 8.5% · 30yr
- Down + closing
- —
- Monthly P&I
- —
- Monthly cashflow
- —
- DSCR
- —
- Eligible?
- —
No personal income docs; deal must DSCR.
Hard money
10% down · 12.0% · 12mo
- Down + closing
- —
- Monthly P&I
- —
- Monthly cashflow
- —
- DSCR
- —
- Eligible?
- —
Short-term bridge; refi at stabilization.
Listing history 13 events
-
2026-06-21days on market $105,000 Active 17 DOM
-
2026-06-19days on market $105,000 Active 15 DOM
-
2026-06-18days on market $105,000 Active 14 DOM
-
2026-06-17days on market $105,000 Active 13 DOM
-
2026-06-16days on market $105,000 Active 12 DOM
-
2026-06-15days on market $105,000 Active 11 DOM
-
2026-06-14days on market $105,000 Active 9 DOM
-
2026-06-13days on market $105,000 Active 8 DOM
-
2026-06-10days on market $105,000 Active 6 DOM
-
2026-06-09days on market $105,000 Active 5 DOM
-
2026-06-08days on market $105,000 Active 4 DOM
-
2026-06-07remarks 692-char remark
-
2026-06-07$105,000 Active 3 DOM
ⓘ Source: listings_history table (triggers on properties + properties_extension) + one-shot
backfill from property_details.listing_events for pre-trigger history.
Tax reassessment forecast TX · Resets to sale price
- Current annual tax
- $2,370 · $197/mo
- Projected year-2 tax
- $2,370 · $197/mo
- Expected delta
- $0/yr ($0/mo · 0.0%)
ⓘ Screening estimate from a state-policy table — verify with the county assessor before closing.
Nearby sold comps map
Loading sold comps map…
Walkable amenities ~0.75 mi
Loading nearby amenities…
Taxation est. · year 1
- Rental income
- $29,661
- − Mortgage interest
- −$5,882
- − Property taxes
- −$2,370
- − Insurance
- −$525
- − Repairs & maintenance
- −$2,373
- − Management
- −$2,373
- − Depreciation
- −$3,055
- Taxable income
- $13,084
- Est. tax owed @ 24.0%
- −$3,140
- After-tax cash flow
- $10,789/yr
For passive investors: Depreciation is non-cash, so a rental often shows a tax loss while cash-flowing — sheltering income. Rental losses are passive: they offset passive income freely, and up to $25,000/yr can offset ordinary (W-2) income if you actively participate and your MAGI is under $100k (phasing out to $0 by $150k); unused losses carry forward. On sale, claimed depreciation is recaptured at up to 25%, and gains may owe capital-gains tax (a 1031 exchange can defer both). Figures are a year-1 estimate at your 24.0% rate — not tax advice; consult a CPA.
Schools (NCES district)
- District
- Anson ISD
- NCES district ID
- 4808400
- Math proficiency
- 29% ▼ -9.00%
- Reading proficiency
- 37% ▼ -3.00%
- Median HH income
- $45,223
- Composite
- 28.21/100
- National rank
- #6805
- State rank
- #565 of 826 in TX
Livability — Anson
- Score
- 70/100
- State rank
- #377
- US rank
- #7976
Category grades
Schools grade is shown separately in the Schools card above.
Census & demographics
- Census place
- Anson, TX
- City population
- 2,635
- Population (ZIP)
- 2,635
Population outlook (Jones County) Hauer SSP2
- Today (2025)
- 19,845 people
- By 2030
- 20,213 · +1.9%
- By 2040
- 21,446 · +8.1%
- By 2050
- 22,499 · +13.4%
- By 2075
- 23,272 · +17.3%
- By 2100
- 20,420 · +2.9%
Race, ethnicity, and origin ACS 2023
- Neighborhood character
- Predominantly White (65%)
- Race & ethnicity
- White 65% Hispanic / Latino 31% Two or more races 12% Black 2%
- Hispanic origin (detail)
- Mexican 24%
- Common ancestry
- Slovak 4% Serbian 2% Scotch-Irish 1%
- Foreign-born
- 5% · Canada, Vietnam
- Languages at home
- 81% English-only · Spanish 19%
Political lean MEDSL · Jones
- 2024 margin
- Solid R (+73.2) · D 13.1% · R 86.2%
- 2008→2024 swing
- -27.1pp toward R · 2008: -46.1pp · 2024: -73.2pp
- All cycles
- 2024: R+73.2 2020: R+69.1 2016: R+65.4 2012: R+54.5 2008: R+46.1
Not yet ingested
- Civics
- —
Market trends
- HPI YoY
- ▲ 4.13%
- Current HPI
- 148.5884
- Rent YoY
- —
- Metro
- —
- State GDP YoY
- ▲ 3.95%
- F500 in state
- 110
Industry mix (Fortune 500 HQ in TX)
| Industry | F500 HQs | Revenue |
|---|---|---|
| Energy | 16 | $1,198B |
|
||
| Technology | 5 | $198B |
|
||
| Engineering / Construction | 4 | $72B |
|
||
| Energy Services | 3 | $60B |
|
||
| Utilities | 3 | $41B |
|
||
| Healthcare | 2 | $330B |
|
||
Price history
+0.0% since first listed9 events — show timeline
- 2026-05-28 Listed $105,000 NTREIS
- 2025-07-01 Rental Removed $1,200 Avail
- 2025-06-22 Relisted — NTREIS
- 2025-06-21 Listing Removed — NTREIS
- 2025-06-07 Listed for Rent $1,200 Avail
- 2025-05-01 Pending — NTREIS
- 2025-04-21 Contingent — NTREIS
- 2025-02-27 Listed $105,000 NTREIS
- 2022-06-09 Sold (Public Records) — Public Records
Property tax history
+10.6%/yrLatest (2025): $2,370 · +10.0% YoY. Source: county tax records.
Cash-flow waterfall
monthlySold comps — $/sqft
last 12 mo · ≤1 miLoading sold comps…