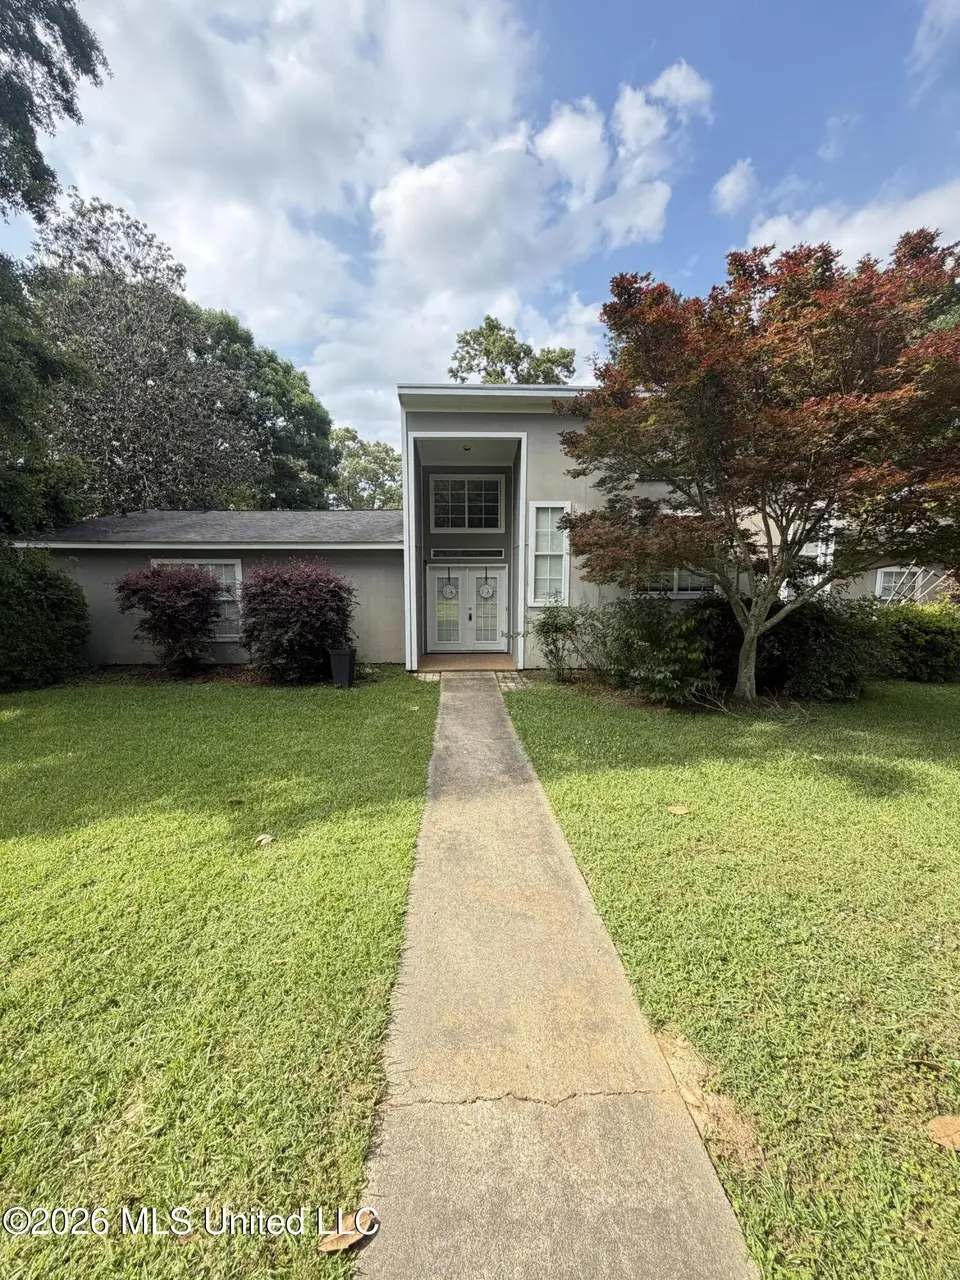
804 North St · McComb, MS
Flood risk 1/10 · Minimal
- FEMA flood zone
- X (unshaded)
- Chance of flooding over 30 yrs
- 0.0%
- Est. flood insurance / yr
- $507 – $1,088
Fire risk 4/10 · Minor
- Est. fire insurance / yr
- $1,241 – $2,305
Heat risk 8/10 · Major
- Hot days now (above 109°F)
- 7 days/yr
- Hot days in 30 yrs
- 20 days/yr
Wind risk 8/10 · Major
- Chance of severe wind over 30 yrs
- 99.0%
Air-quality risk 1/10 · Minimal
- Unhealthy air days now
- 0 days/yr
- Unhealthy air days in 30 yrs
- 0 days/yr
Risk factors via First Street. Map © Google.
Why this score? — see what drove the C- grade
The composite is a weighted blend of 9 inputs, each scored 0–100. Each bar is that input's sub-score; the figure is the points it added to the 100-point composite (weight × sub-score).
- Cash flow +16.2/30.0
- ARV discount +15.0/15.0
- 1% rule +5.0/10.0
- DSCR +5.0/10.0
- Livability +3.5/5.0
- Rent growth +2.5/5.0
- Condition / age +2.5/5.0
- Schools +1.2/10.0
- Appreciation +0.0/10.0
$149,500
🖨 Deal sheet (PDF) 📄 Offer letter ✓ Due diligence
Listing remarks MLS
This home is in beautiful Edgewood Park area of McComb; with great outdoor and indoor entertaining areas .Outdoor area includes covered patio, sun deck and Hot tub. Lots of upgrades have been done including a natural gas generator for bad weather. Seller is very motivated and ready to hear your offer.
Key facts
- Large living room
- Gas stove
- Granite countertops
Tags
Property features AI
Finance
- HOA & community: Community parks; Playground
Exterior
- Parking: Attached garage; On-site parking; Parking pad; Paved, private concrete parking
- Utilities: Public water; Public sewer; Electricity connected; Natural gas available; Cable available; Sewer connected; Water connected
- Home design: Single family residence; One story; See remarks (structure type)
- Construction: Wood siding; Shingle roof; Slab foundation; Built (year source: Assessor)
- Exterior features: Private yard; Back yard privacy fencing; Rain gutters; Patio; Rear porch
Interior
- Kitchen: Dishwasher; Free-standing refrigerator; Kitchen island; Granite counters; Pantry; Eat-in kitchen
- Bedrooms: Walk-in closet(s)
- Flooring: Carpet; Ceramic tile; Concrete; Wood
- Bathrooms: 2 full bathrooms
- Heating & cooling: Natural gas heating; Central air conditioning; Electric cooling
- Interior features: Eat-in kitchen; Entrance foyer; High ceilings; Kitchen island; Pantry; Walk-in closets; Granite counters; Wood burning fireplace; Blinds
- Laundry & utility: Laundry room; Electric water heater
Neighborhood map
What this means for you Summary
Snapshot
- This is a 3-bed/2.0-bath single-family listed at $150k.
Deal economics
- At list price, monthly cash flow is $79 ($949/yr) — positive.
- The deal already cash-flows at list — no discount required.
- Meets the 1% rule at list price ($2k rent vs $150k).
- Recommended offer: $145k (3.0% below list) — sets the bar for market timing.
Location & tenants
- Location reads 69/100 on livability (#50 in MS) — a middle-class / working-renter tenant base. Strengths: cost of living A+, health & safety A+, housing A-; Watch: schools D-, amenities F, commute F.
- Mccomb School District (town): math 15% / reading 16% proficiency, ranked #106 of 130 in MS (top 82%) — low school quality limits family demand, transient renter base, plan for 1-2y turnover; 93% free/reduced lunch — lower-income household profile, screen leases tightly.
- Market conditions: 191 active listings in the ZIP; 1 comparable units currently listed for rent nearby; 10 units permitted in Pike County in 2024 (0 in 5+ unit buildings).
Forward outlook
- Local home prices are declining (-3.0%/yr); year-one equity from $1k of loan paydown is wiped out by about $4k of value loss. Plan a longer hold.
- Pike County population projected at -14% by 2050 — secular population decline; favor cash flow + early exit over multi-decade hold.
Negotiation context
- It's been on market 53 days — a 3% lower offer ($145k) is reasonable based on typical stale-listing flexibility.
- 3 sale attempts since 13y ago with the ask held roughly flat each time — persistent listings suggest the price (not the market) is what's stuck; bring a comps-based counter.
Risks & watch-outs
- Climate carrying-cost: severe wind risk, 99% chance of damaging wind over 30y; extreme-heat days projected 7→20/yr by 2055 (HVAC capex compounding) — expect insurance premiums to compound above CPI over the hold.
Questions for the listing agent
- It's been on market 53 days. Have you received any prior offers? Is the seller open to a 3% concession, seller financing, or rate buy-down credit?
- Built in 1979 — when were the roof, HVAC, electrical panel, plumbing, and water heater last replaced?
- Is there a deadline driving the sale (1031 exchange, divorce, estate, relocation)? That informs how much negotiation room exists.
- Schools are D-rated, which usually means shorter tenancies and higher turnover. Who's the typical renter profile here, and what's been the actual vacancy rate?
- What's the average days-on-market for RENTAL listings here right now (not sales)? A rising rental-DOM trend means longer vacancies and softer asking-rent achievability than the comps imply.
- What's the recent tenant-quality profile in this submarket — average credit score on applications, eviction rate, late-payment / NSF rate, and stable-employment percentage? A property-management company in the area should have these aggregated.
- How much new for-sale + rental construction is in the pipeline within 1–3 miles? Heavy new supply typically softens prices + rents 12–24 months out; constrained supply supports both.
Investment metrics
- 1% rule
- 1.00% ✓
- Cap rate
- 6.93%
- Cash-on-cash
- 2.27%
- DSCR
- 1.10
- GRM
- 8.3
CMA / ARV
- ARV (median comp)
- $187,232
- List price
- $149,500
- Delta
- -20.15%
- Verdict
- UNDERPRICED
- Comps
- 20 within 1.0 mi
Show comp detail 12 sales within ~0.75 mi
| Address | Dist | Beds/Ba | Sqft | Sold | Price | $/sf | Match |
|---|---|---|---|---|---|---|---|
| 715 N James Ave | 0.25mi | 3/2.0 | 1,918 (-1%) | 14mo | $199,000 | $104 | 75 |
| 600 Lake | 0.24mi | 3/2.0 | 1,880 (-3%) | 14mo | $279,500 | $149 | 73 |
| 1212 Park St | 0.39mi | 4/2.0 (+1) | 1,945 (+0%) | 7mo | $162,900 | $84 | 70 |
| 521 Avalon Ave | 0.15mi | 3/2.0 | 1,661 (-14%) | 1mo | $259,500 | $156 | 68 |
| 402 High St | 0.34mi | 4/2.0 (+1) | 2,023 (+4%) | 8mo | $169,900 | $84 | 65 |
| 1018 Park St | 0.34mi | 4/2.5 (+1) | 2,198 (+14%) | 3mo | $169,500 | $77 | 52 |
| 602 Maxine Ave | 0.51mi | 4/2.0 (+1) | 1,836 (-5%) | 13mo | $194,900 | $106 | 52 |
| 406 Aston Ave | 0.64mi | 3/1.5 | 1,690 (-13%) | 0mo | $120,000 | $71 | 47 |
| 612 W New York Ave | 0.73mi | 3/2.0 | 1,708 (-12%) | 1mo | $54,600 | $32 | 45 |
| 708 Dyson Dr | 0.67mi | 4/1.5 (+1) | 2,018 (+4%) | 16mo | $65,000 | $32 | 42 |
| 308 Burke Ave | 0.56mi | 3/2.0 | 1,658 (-14%) | 11mo | $149,000 | $90 | 41 |
| 508 Kentucky Ave | 0.58mi | 3/2.0 | 1,680 (-13%) | 20mo | $99,999 | $60 | 35 |
Match score weights: distance 35% · size 25% · config 20% · recency 20%. Top-matched comps best support the ARV.
Projected returns pro-forma
-3.0% appreciation · 3.0% rent growth · sell at horizon
- IRR
- -12.7%
- Equity multiple
- 0.54×
- Total profit
- $-19,119
- Equity at exit
- $22,291
- IRR
- -3.5%
- Equity multiple
- 0.76×
- Total profit
- $-9,887
- Equity at exit
- $12,926
Cash invested: $41,860 (down + closing). Projections, not guarantees.
Landlord ↔ Tenant lean methodology
- Overall (STATE)
- 90 Strongly Landlord-Friendly
- State Mississippi
- 90 Strongly Landlord-Friendly · R+11
- County
- — inherits STATE
- City
- — inherits STATE
ZIP-level market 39648
- Active inventory
- 191
- Price-to-rent
- 8.3×
Monthly cashflow live
- Estimated rent
- $1,500 medium interval (Pro) →
- Mortgage (P&I)
- −$784
- Tax from tax record
- −$260 /mo · $3,115/yr
- Insurance
- −$62
- HOA
- −$0
- Vacancy / Maint / Mgmt
- −$315
- Net cashflow
- $79
Break-even live
Sensitivity live
| Price | -10% $164 | -5% $121 | +0% $79 | +5% $37 | +10% $-6 |
|---|---|---|---|---|---|
| Rent | -10% $-39 | -5% $20 | +0% $79 | +5% $138 | +10% $198 |
| Rate | -1.0pp $154 | -0.5pp $117 | base $79 | +0.5pp $40 | +1.0pp $1 |
UW: 25.0% down · 7.5% · 30yr · 1.5% tax · 5.0% vac · 8.0% maint · 8.0% mgmt
Financing live
Cash to close
- Down payment
- $37,375
- Closing costs
- $4,485
- Reserves months
- —
- Total cash needed
- —
Loan-product check · same deal, 3 products live
Conventional
25% down · 7.5% · 30yr
- Down + closing
- —
- Monthly P&I
- —
- Monthly cashflow
- —
- DSCR
- —
- Eligible?
- —
Personal DTI + credit; lowest rate.
DSCR
20% down · 8.5% · 30yr
- Down + closing
- —
- Monthly P&I
- —
- Monthly cashflow
- —
- DSCR
- —
- Eligible?
- —
No personal income docs; deal must DSCR.
Hard money
10% down · 12.0% · 12mo
- Down + closing
- —
- Monthly P&I
- —
- Monthly cashflow
- —
- DSCR
- —
- Eligible?
- —
Short-term bridge; refi at stabilization.
Rent comps 1 comps
| Address | Beds | Baths | Sqft | Rent | $/sqft | DOM | Units | Dist |
|---|---|---|---|---|---|---|---|---|
| 606 Lakeview Ave McComb, MS | 2.0 | 2.0 | 2312 | $1,500 | $0.65 | 45d | 1 | 0.41mi |
Listing history 21 events
-
2026-06-21days on market $149,500 Active 53 DOM
-
2026-06-18days on market $149,500 Active 51 DOM
-
2026-06-17days on market $149,500 Active 50 DOM
-
2026-06-16days on market $149,500 Active 49 DOM
-
2026-06-15days on market $149,500 Active 48 DOM
-
2026-06-13days on market $149,500 Active 46 DOM
-
2026-06-12days on market $149,500 Active 45 DOM
-
2026-06-09days on market $149,500 Active 42 DOM
-
2026-06-08days on market $149,500 Active 41 DOM
-
2026-06-07days on market $149,500 Active 40 DOM
-
2026-06-07days on market $149,500 Active 39 DOM
-
2026-06-04days on market $149,500 Active 36 DOM
-
2026-06-02days on market $149,500 Active 35 DOM
-
2026-06-01days on market $149,500 Active 34 DOM
-
2026-05-31days on market $149,500 Active 33 DOM
-
2026-04-27$149,500 Active 1104-char remark
-
2026-04-22historical
-
2026-02-18$149,500 Active
-
2014-07-25soldstatus
Show marketing remark (302 chars)
This home is in beautiful Edgewood Park area of McComb; with great outdoor and indoor entertaining areas .Outdoor area includes covered patio, sun deck and Hot tub. Lots of upgrades have been done including a natural gas generator for bad weather. Seller is very motivated and ready to hear your offer.
-
2013-06-10$145,000
Show marketing remark (302 chars)
This home is in beautiful Edgewood Park area of McComb; with great outdoor and indoor entertaining areas .Outdoor area includes covered patio, sun deck and Hot tub. Lots of upgrades have been done including a natural gas generator for bad weather. Seller is very motivated and ready to hear your offer.
-
2005-04-29soldstatus
ⓘ Source: listings_history table (triggers on properties + properties_extension) + one-shot
backfill from property_details.listing_events for pre-trigger history.
Tax reassessment forecast MS · Resets to sale price
- Current annual tax
- $3,115 · $260/mo
- Projected year-2 tax
- $3,115 · $260/mo
- Expected delta
- $0/yr ($0/mo · 0.0%)
ⓘ Screening estimate from a state-policy table — verify with the county assessor before closing.
Climate risk First Street
- Flood 1/10 Low FEMA zone X (unshaded) · 0% chance over 30 yrs
- Wildfire 4/10 Moderate
- Heat 8/10 Severe 7 d/yr ≥109°F today · 20 d/yr by 30 yrs out
- Wind 8/10 Severe 99% chance of damaging wind over 30 yrs
- Air quality 1/10 Low 0 unhealthy d/yr today · 0 by 30 yrs out
Nearby sold comps map
Loading sold comps map…
Walkable amenities ~0.75 mi
Loading nearby amenities…
Taxation est. · year 1
- Rental income
- $18,000
- − Mortgage interest
- −$8,374
- − Property taxes
- −$3,115
- − Insurance
- −$748
- − Repairs & maintenance
- −$1,440
- − Management
- −$1,440
- − Depreciation
- −$4,349
- Taxable loss
- −$1,466
- Est. tax savings @ 24.0%
- +$352
- After-tax cash flow
- $1,301/yr
For passive investors: Depreciation is non-cash, so a rental often shows a tax loss while cash-flowing — sheltering income. Rental losses are passive: they offset passive income freely, and up to $25,000/yr can offset ordinary (W-2) income if you actively participate and your MAGI is under $100k (phasing out to $0 by $150k); unused losses carry forward. On sale, claimed depreciation is recaptured at up to 25%, and gains may owe capital-gains tax (a 1031 exchange can defer both). Figures are a year-1 estimate at your 24.0% rate — not tax advice; consult a CPA.
Schools (NCES district)
- District
- Mccomb School District
- NCES district ID
- 2802880
- Math proficiency
- 15% ▼ -20.00%
- Reading proficiency
- 16% ▼ -5.00%
- Median HH income
- $29,855
- Composite
- 12.26/100
- National rank
- #9645
- State rank
- #106 of 130 in MS
Livability — McComb
- Score
- 69/100
- State rank
- #50
- US rank
- #8347
Category grades
Schools grade is shown separately in the Schools card above.
Census & demographics
- Census place
- McComb, MS
- Population (ZIP)
- 19,767
Population outlook (Pike County) Hauer SSP2
- Today (2025)
- 38,766 people
- By 2030
- 37,874 · -2.3%
- By 2040
- 35,743 · -7.8%
- By 2050
- 33,276 · -14.2%
- By 2075
- 26,799 · -30.9%
- By 2100
- 18,562 · -52.1%
Race, ethnicity, and origin ACS 2023
- Neighborhood character
- Majority Black (64%)
- Race & ethnicity
- Black 64% White 32% Two or more races 2% Hispanic / Latino 2%
- Common ancestry
- Slovak 2% Lithuanian 1% Italian 1%
- Foreign-born
- 1%
- Languages at home
- 98% English-only · Spanish 1%
Political lean MEDSL · Pike
- 2024 margin
- Toss-up / Even · D 47.8% · R 51.3%
- 2008→2024 swing
- -7.0pp toward R · 2008: 3.5pp · 2024: -3.5pp
- All cycles
- 2024: R+3.5 2020: D+1.0 2016: R+0.7 2012: D+7.6 2008: D+3.5
Not yet ingested
- Civics
- —
Market trends
- HPI YoY
- ▼ -88.61%
- Current HPI
- 92.2495
- Rent YoY
- —
- Metro
- —
- State GDP YoY
- —
- F500 in state
- 0
Price history
+3.1% since first listed6 events — show timeline
- 2026-04-27 Listed $149,500 MLSU
- 2026-04-22 Listing Removed — MLSU
- 2026-02-18 Listed $149,500 MLSU
- 2014-07-25 Sold (MLS) — MLSU
- 2013-06-10 Listed $145,000 MLSU
- 2005-04-29 Sold (Public Records) — Public Records
Property tax history
+6.7%/yrLatest (2025): $3,115 · +13.6% YoY. Source: county tax records.
Cash-flow waterfall
monthlySold comps — $/sqft
last 12 mo · ≤1 miLoading sold comps…