1633 Sunset Dr · Homewood, AL
Flood risk 1/10 · Minimal
- FEMA flood zone
- X (unshaded)
- Chance of flooding over 30 yrs
- 0.0%
- Est. flood insurance / yr
- $473 – $860
Fire risk 1/10 · Minimal
- Est. fire insurance / yr
- $916 – $1,700
Heat risk 6/10 · Moderate
- Hot days now (above 105°F)
- 7 days/yr
- Hot days in 30 yrs
- 18 days/yr
Wind risk 6/10 · Moderate
- Chance of severe wind over 30 yrs
- 27.0%
Air-quality risk 4/10 · Minor
- Unhealthy air days now
- 6 days/yr
- Unhealthy air days in 30 yrs
- 6 days/yr
Risk factors via First Street. Map © Google.
Why this score? — see what drove the D grade
The composite is a weighted blend of 9 inputs, each scored 0–100. Each bar is that input's sub-score; the figure is the points it added to the 100-point composite (weight × sub-score).
- ARV discount +15.0/15.0
- Cash flow +10.7/30.0
- Livability +4.0/5.0
- DSCR +3.1/10.0
- Rent growth +3.1/5.0
- Condition / age +2.5/5.0
- 1% rule +2.0/10.0
- Schools +1.8/10.0
- Appreciation +0.0/10.0
$449,900
🖨 Deal sheet (PDF) 📄 Offer letter ✓ Due diligence
Listing remarks MLS
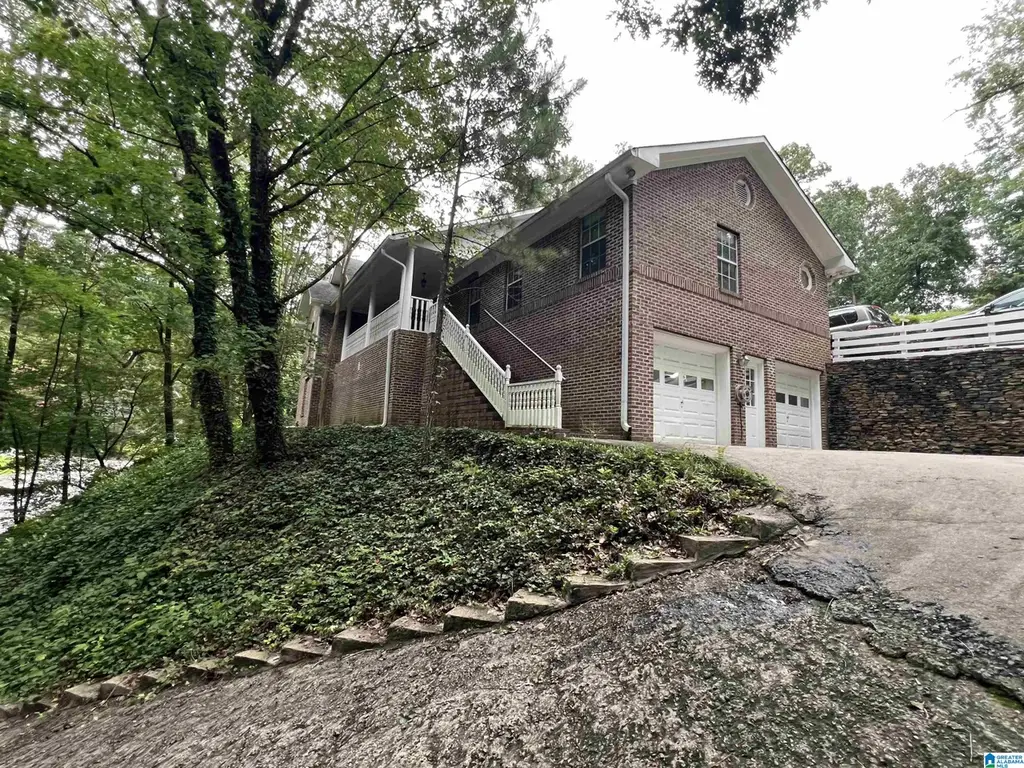
Charming all-brick home situated on a large elevated lot with a spacious covered front porch to enjoy wooded views. The huge, open backyard at the top of a hill has plenty of room for a pool, garden, or outdoor entertaining. Inside, you'll find a stunning stacked-stone wood-burning fireplace, along with a kitchen featuring a farmhouse sink and smart refrigerator. Conveniently located near Samford University, downtown, and the many restaurants and businesses along Lakeshore Drive and Columbiana Road. Owner reports the property is eligible for annexation into the Homewood or Vestavia Hills school systems for buyers who prefer that option and are comfortable with the associated tax increase. The owner also has estimates of $6,000–$7,000 to widen and resurface the steep driveway. * * SELLER FINANCING may be available for buyers intending to occupy the home.
Key facts
- Covered front porch
- Wooded views
- Farmhouse sink
Tags
Neighborhood map
What this means for you Summary
Snapshot
- This is a 3-bed/3.0-bath single-family listed at $450k.
Deal economics
- At list price, monthly cash flow is $-215 ($-3k/yr) — negative.
- To cash-flow at today's rent, offer at most $412k (8.4% below list).
- To meet the 1% rule (rent ≥ 1% of price), the offer needs to be $316k (29.7% below list).
- Recommended offer: $316k (29.7% below list) — sets the bar for 1% rule.
- Cap rate 5.7% vs local median 2.2% in Homewood — top-decile yield for the area; either an underpriced asset or a hidden risk that comps aren't pricing in. Stress-test before assuming the spread holds.
Location & tenants
- Location reads 80/100 on livability (#5 in AL, #1,730 nationally) — a professional / high-income tenant draw. Strengths: commute A+, employment A+, housing A+; Watch: cost of living F.
- Jefferson County (suburban): math 9% / reading 32% proficiency, ranked #104 of 129 in AL (top 81%) — low school quality limits family demand, transient renter base, plan for 1-2y turnover.
- Zoned schools: Irondale Middle School (math 2% / reading 35%, grade F, #195 of 257 statewide, top 76%, 467 students, 58% FRL); Shades Valley High School (math 29% / reading 39%, grade F, #53 of 305 statewide, top 18%, 1,200 students, 68% FRL).
- Market conditions: Rents rising (+2.6%/yr); 139 active listings in the ZIP; 4 comparable units currently listed for rent nearby; rentals lingering (median 46d on market — plan ~5-8 weeks vacancy on turnover, expect pricing pressure); 50% of comp listings sitting > 30 days — soft ceiling on asking rent; 2,114 units permitted in Jefferson County in 2024 (556 in 5+ unit buildings).
- At $3,163/mo this rent would consume 51% of the median local household income ($75k/yr) (locally 1747% of renters already pay >50% of income on rent) — very limited rent-growth headroom before tenants either downsize or default.
Forward outlook
- Local home prices are declining (-3.0%/yr); year-one equity from $3k of loan paydown is wiped out by about $13k of value loss. Plan a longer hold.
- Jefferson County population projected to shrink 4% by 2050 — rents likely to lag national; underwrite the cash flow, not the appreciation.
Negotiation context
- It's been on market 97 days — a 9% lower offer ($409k) is reasonable based on typical stale-listing flexibility.
- Current owner paid $162k; list at $450k implies a 179% gain — meaningful room to come down on a strong offer.
Risks & watch-outs
- Climate carrying-cost: major wind risk, 27% chance of damaging wind over 30y; extreme-heat days projected 7→18/yr by 2055 (HVAC capex compounding) — expect insurance premiums to compound above CPI over the hold.
Questions for the listing agent
- What do current leases actually rent for vs. the listed asking? Can we see a recent rent roll and the last 12 months of T-12 income?
- It's been on market 97 days. Have you received any prior offers? Is the seller open to a 30% concession, seller financing, or rate buy-down credit?
- Why hasn't it sold? Are there any deal-killer items the seller is aware of (foundation, flood, title, zoning, code violations)?
- Is there a deadline driving the sale (1031 exchange, divorce, estate, relocation)? That informs how much negotiation room exists.
- Schools are A-rated — typically a magnet for longer-tenancy family renters. What's the average tenant stay here, and is there a school-zone premium baked into asking?
- The area grade is low — what's the realistic commute time and amenity access for the typical tenant pool here? Any planned neighborhood developments (good or bad) we should know about?
- What's the average days-on-market for RENTAL listings here right now (not sales)? A rising rental-DOM trend means longer vacancies and softer asking-rent achievability than the comps imply.
- What's the recent tenant-quality profile in this submarket — average credit score on applications, eviction rate, late-payment / NSF rate, and stable-employment percentage? A property-management company in the area should have these aggregated.
- How much new for-sale + rental construction is in the pipeline within 1–3 miles? Heavy new supply typically softens prices + rents 12–24 months out; constrained supply supports both.
Investment metrics
- 1% rule
- 0.70% ✗
- Cap rate
- 5.72%
- Cash-on-cash
- -2.05%
- DSCR
- 0.91
- GRM
- 11.9
CMA / ARV
- ARV (median comp)
- $540,696
- List price
- $449,900
- Delta
- -16.79%
- Verdict
- UNDERPRICED
- Comps
- 20 within 1.0 mi
Show comp detail 12 sales within ~0.75 mi
| Address | Dist | Beds/Ba | Sqft | Sold | Price | $/sf | Match |
|---|---|---|---|---|---|---|---|
| 1752 Shades Crest Rd | 0.25mi | 4/3.0 (+1) | 2,637 (+6%) | 5mo | $426,000 | $162 | 68 |
| 1576 Berry Rd | 0.45mi | 4/2.5 (+1) | 2,390 (-4%) | 6mo | $495,000 | $207 | 61 |
| 1735 Old Columbiana Rd | 0.20mi | 4/2.0 (+1) | 2,200 (-11%) | 3mo | $430,000 | $195 | 60 |
| 1833 Shades Crest Rd | 0.54mi | 4/3.0 (+1) | 2,498 (+1%) | 11mo | $699,900 | $280 | 59 |
| 1729 S Lakeshore Dr | 0.23mi | 3/2.5 | 2,804 (+13%) | 10mo | $400,000 | $143 | 57 |
| 2233 Great Rock Rd | 0.70mi | 4/3.0 (+1) | 2,303 (-7%) | 1mo | $475,000 | $206 | 49 |
| 100 University Park Dr | 0.57mi | 3/3.0 | 2,760 (+11%) | 6mo | $749,000 | $271 | 49 |
| 176 University Park Dr | 0.73mi | 4/3.0 (+1) | 2,539 (+2%) | 9mo | $730,000 | $288 | 49 |
| 611 Longwood Pl | 0.63mi | 3/3.5 | 2,705 (+9%) | 8mo | $408,000 | $151 | 47 |
| 1519 Berry Rd | 0.71mi | 3/2.0 | 2,252 (-9%) | 11mo | $467,007 | $207 | 38 |
| 1833 Cedarwood Rd | 0.68mi | 3/2.0 | 2,118 (-14%) | 7mo | $490,000 | $231 | 34 |
| 516 Lansdowne Pl | 0.55mi | 4/3.5 (+1) | 2,841 (+15%) | 11mo | $525,000 | $185 | 34 |
Match score weights: distance 35% · size 25% · config 20% · recency 20%. Top-matched comps best support the ARV.
Projected returns pro-forma
-3.0% appreciation · 2.59% rent growth · sell at horizon
- IRR
- -20.1%
- Equity multiple
- 0.30×
- Total profit
- $-88,072
- Equity at exit
- $67,082
- IRR
- -14.1%
- Equity multiple
- 0.20×
- Total profit
- $-100,382
- Equity at exit
- $38,899
Cash invested: $125,972 (down + closing). Projections, not guarantees.
Landlord ↔ Tenant lean methodology
- Overall (STATE)
- 90 Strongly Landlord-Friendly
- State Alabama
- 90 Strongly Landlord-Friendly · R+15
- County
- — inherits STATE
- City
- — inherits STATE
ZIP-level market 35216
- Rents YoY
- 2.6%
- Active inventory
- 139
- Price-to-rent
- 11.9×
Monthly cashflow live
- Estimated rent
- $3,163 medium interval (Pro) →
- Mortgage (P&I)
- −$2,359
- Tax from tax record
- −$167 /mo · $2,002/yr
- Insurance
- −$187
- HOA
- −$0
- Vacancy / Maint / Mgmt
- −$664
- Net cashflow
- $-215
Break-even live
Sensitivity live
| Price | -10% $40 | -5% $-87 | +0% $-215 | +5% $-342 | +10% $-469 |
|---|---|---|---|---|---|
| Rent | -10% $-465 | -5% $-340 | +0% $-215 | +5% $-90 | +10% $35 |
| Rate | -1.0pp $12 | -0.5pp $-100 | base $-215 | +0.5pp $-331 | +1.0pp $-450 |
UW: 25.0% down · 7.5% · 30yr · 1.5% tax · 5.0% vac · 8.0% maint · 8.0% mgmt
Financing live
Cash to close
- Down payment
- $112,475
- Closing costs
- $13,497
- Reserves months
- —
- Total cash needed
- —
Loan-product check · same deal, 3 products live
Conventional
25% down · 7.5% · 30yr
- Down + closing
- —
- Monthly P&I
- —
- Monthly cashflow
- —
- DSCR
- —
- Eligible?
- —
Personal DTI + credit; lowest rate.
DSCR
20% down · 8.5% · 30yr
- Down + closing
- —
- Monthly P&I
- —
- Monthly cashflow
- —
- DSCR
- —
- Eligible?
- —
No personal income docs; deal must DSCR.
Hard money
10% down · 12.0% · 12mo
- Down + closing
- —
- Monthly P&I
- —
- Monthly cashflow
- —
- DSCR
- —
- Eligible?
- —
Short-term bridge; refi at stabilization.
Rent comps 4 comps
| Address | Beds | Baths | Sqft | Rent | $/sqft | DOM | Units | Dist |
|---|---|---|---|---|---|---|---|---|
| 1712 Ridgewood Pl Vestavia Hills, AL | 3.0 | 2.0 | 1742 | $3,950 | $2.27 | 17d | 1 | 0.05mi |
| 1856 Catala Rd Vestavia Hills, AL | 4.0 | 2.5 | 1908 | $2,550 | $1.34 | 45d | 1 | 0.80mi |
| 1828 Jacobs Ln Vestavia Hills, AL | 3.0 | 2.0 | 2203 | $3,000 | $1.36 | 45d | 1 | 1.11mi |
| 112 Crest Dr Birmingham, AL | 3.0 | 3.0 | 1691 | $3,573 | $2.11 | 4d | 1 | 1.17mi |
Listing history 23 events
-
2026-06-22days on market $449,900 Active 97 DOM
-
2026-06-18days on market $449,900 Active 94 DOM
-
2026-06-17days on market $449,900 Active 93 DOM
-
2026-06-16days on market $449,900 Active 92 DOM
-
2026-06-15days on market $449,900 Active 91 DOM
-
2026-06-13days on market $449,900 Active 89 DOM
-
2026-06-10days on market $449,900 Active 86 DOM
-
2026-06-09days on market $449,900 Active 85 DOM
-
2026-06-08days on market $449,900 Active 84 DOM
-
2026-06-07days on market $449,900 Active 83 DOM
-
2026-06-03days on market $449,900 Active 79 DOM
-
2026-06-02days on market $449,900 Active 78 DOM
-
2026-06-01days on market $449,900 Active 77 DOM
-
2026-05-31days on market $449,900 Active 76 DOM
-
2026-03-16$449,900 Active 873-char remark
Show marketing remark (873 chars)
Charming all-brick home situated on a large elevated lot with a spacious covered front porch to enjoy wooded views. The huge, open backyard at the top of a hill has plenty of room for a pool, garden, or outdoor entertaining. Inside, you'll find a stunning stacked-stone wood-burning fireplace, along with a kitchen featuring a farmhouse sink and smart refrigerator. Conveniently located near Samford University, downtown, and the many restaurants and businesses along Lakeshore Drive and Columbiana Road. Owner reports the property is eligible for annexation into the Homewood or Vestavia Hills school systems for buyers who prefer that option and are comfortable with the associated tax increase. The owner also has estimates of $6,000–$7,000 to widen and resurface the steep driveway. * * SELLER FINANCING may be available for buyers intending to occupy the home.
-
2019-04-15price $345,000
-
2019-02-21price $349,000
-
2019-02-02price $359,900
-
2019-01-29price $349,999
-
2002-02-08soldstatus $161,500
-
2001-03-28soldstatus $154,000
-
1995-11-22soldstatus $146,000
-
1994-07-01soldstatus $16,500
ⓘ Source: listings_history table (triggers on properties + properties_extension) + one-shot
backfill from property_details.listing_events for pre-trigger history.
Tax reassessment forecast AL · Resets to sale price
- Current annual tax
- $2,002 · $167/mo
- Projected year-2 tax
- $2,002 · $167/mo
- Expected delta
- $0/yr ($0/mo · 0.0%)
ⓘ Screening estimate from a state-policy table — verify with the county assessor before closing.
Climate risk First Street
- Flood 1/10 Low FEMA zone X (unshaded) · 0% chance over 30 yrs
- Wildfire 1/10 Low
- Heat 6/10 Major 7 d/yr ≥105°F today · 18 d/yr by 30 yrs out
- Wind 6/10 Major 27% chance of damaging wind over 30 yrs
- Air quality 4/10 Moderate 6 unhealthy d/yr today · 6 by 30 yrs out
Nearby sold comps map
Loading sold comps map…
Walkable amenities ~0.75 mi
Loading nearby amenities…
Taxation est. · year 1
- Rental income
- $37,958
- − Mortgage interest
- −$25,201
- − Property taxes
- −$2,002
- − Insurance
- −$2,250
- − Repairs & maintenance
- −$3,037
- − Management
- −$3,037
- − Depreciation
- −$13,088
- Taxable loss
- −$10,656
- Est. tax savings @ 24.0%
- +$2,557
- After-tax cash flow
- $-19/yr
For passive investors: Depreciation is non-cash, so a rental often shows a tax loss while cash-flowing — sheltering income. Rental losses are passive: they offset passive income freely, and up to $25,000/yr can offset ordinary (W-2) income if you actively participate and your MAGI is under $100k (phasing out to $0 by $150k); unused losses carry forward. On sale, claimed depreciation is recaptured at up to 25%, and gains may owe capital-gains tax (a 1031 exchange can defer both). Figures are a year-1 estimate at your 24.0% rate — not tax advice; consult a CPA.
Schools (NCES district)
- District
- Jefferson County
- NCES district ID
- 0101920
- Math proficiency
- 9% ▼ -24.00%
- Reading proficiency
- 32% ▼ -5.00%
- Median HH income
- $51,712
- Composite
- 18.4/100
- National rank
- #8937
- State rank
- #104 of 129 in AL
Livability — Homewood
- Score
- 80/100
- State rank
- #5
- US rank
- #1730
Category grades
Schools grade is shown separately in the Schools card above.
Census & demographics
- County
- Jefferson County · 527,445 people
- City population
- 32,734
- Metro
- Birmingham-Hoover, AL
- Population (ZIP)
- 34,327
- Household income
- $74,525
- Rent vs Own
- Severe rent burden
- 1747.0
Population outlook (Jefferson County) Hauer SSP2
- Today (2025)
- 669,185 people
- By 2030
- 669,694 · +0.1%
- By 2040
- 661,388 · -1.2%
- By 2050
- 643,086 · -3.9%
- By 2075
- 577,267 · -13.7%
- By 2100
- 474,758 · -29.1%
Race, ethnicity, and origin ACS 2023
- Neighborhood character
- Diverse neighborhood (Simpson 0.56)
- Race & ethnicity
- White 61% Black 24% Hispanic / Latino 8% Asian 5% Two or more races 4% Native American 1%
- Hispanic origin (detail)
- Mexican 4%
- Common ancestry
- Slovak 3% Serbian 2% Italian 2%
- Foreign-born
- 8% · Canada, China, South Korea
- Languages at home
- 88% English-only · Spanish 6% Other Indo-European 2% Arabic 1%
Political lean MEDSL · Jefferson
- 2024 margin
- D (+10.4) · D 54.6% · R 44.2% · Other 1.2%
- 2008→2024 swing
- +5.4pp toward D · 2008: 5.1pp · 2024: 10.4pp
- All cycles
- 2024: D+10.4 2020: D+13.2 2016: D+7.2 2012: D+6.0 2008: D+5.1
Not yet ingested
- Civics
- —
Market trends
- HPI YoY
- ▼ -259.83%
- Current HPI
- 239.8705
- Rent YoY
- ▲ 2.59%
- Metro
- Birmingham-Hoover, AL
- State GDP YoY
- ▲ 2.94%
- F500 in state
- 4
Industry mix (Fortune 500 HQ in AL)
| Industry | F500 HQs | Revenue |
|---|---|---|
| Financial Services | 1 | $8B |
|
||
| Healthcare | 1 | $5B |
|
||
Price history
+2626.7% since first listed9 events — show timeline
- 2026-03-16 Listed $449,900 Greater Alabama MLS
- 2019-04-15 Price Changed $345,000 Greater Alabama MLS
- 2019-02-21 Price Changed $349,000 Greater Alabama MLS
- 2019-02-02 Price Changed $359,900 Greater Alabama MLS
- 2019-01-29 Price Changed $349,999 Greater Alabama MLS
- 2002-02-08 Sold (Public Records) $161,500 Public Records
- 2001-03-28 Sold (Public Records) $154,000 Public Records
- 1995-11-22 Sold (Public Records) $146,000 Public Records
- 1994-07-01 Sold (Public Records) $16,500 Public Records
Property tax history
+5.6%/yrLatest (2025): $2,002 · +0.0% YoY. Source: county tax records.
Cash-flow waterfall
monthlySold comps — $/sqft
last 12 mo · ≤1 miLoading sold comps…