340 Peace Mnr · Memphis, FL
Flood risk 5/10 · Moderate
- FEMA flood zone
- X (unshaded)
- Chance of flooding over 30 yrs
- 0.23%
- Est. flood insurance / yr
- $507 – $1,088
Fire risk 1/10 · Minimal
- Est. fire insurance / yr
- $947 – $1,759
Heat risk 10/10 · Severe
- Hot days now (above 107°F)
- 7 days/yr
- Hot days in 30 yrs
- 29 days/yr
Wind risk 10/10 · Severe
- Chance of severe wind over 30 yrs
- 99.0%
Air-quality risk 3/10 · Minor
- Unhealthy air days now
- 2 days/yr
- Unhealthy air days in 30 yrs
- 2 days/yr
Risk factors via First Street. Map © Google.
Why this score? — see what drove the B+ grade
The composite is a weighted blend of 9 inputs, each scored 0–100. Each bar is that input's sub-score; the figure is the points it added to the 100-point composite (weight × sub-score).
- Cash flow +30.0/30.0
- ARV discount +15.0/15.0
- 1% rule +10.0/10.0
- DSCR +10.0/10.0
- Schools +4.4/10.0
- Livability +3.2/5.0
- Condition / age +2.5/5.0
- Rent growth +1.8/5.0
- Appreciation +0.0/10.0
$135,000
🖨 Deal sheet 📄 Offer letter ✓ Due diligence
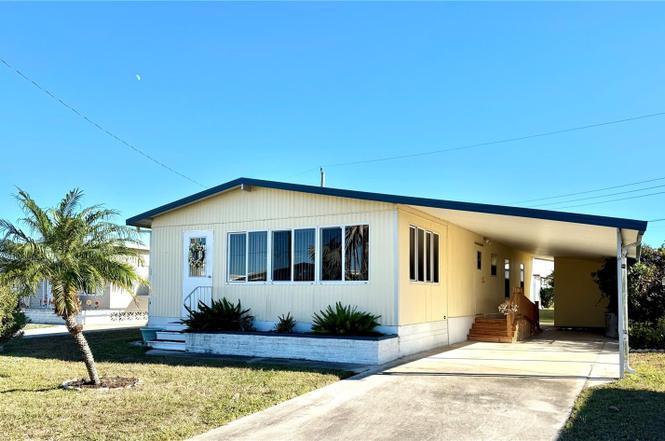
Listing remarks
Welcome to Leisure Lake Co-Op 55+ Community, Where Comfort Meets Convenience! Step into this beautifully maintained double-wide home, perfectly situated in the heart of the highly sought-after Leisure Lake Co-Op. Offering an ideal blend of space and functionality, this residence features a private primary suite with its own en-suite bathroom, plus an additional bedroom and full bath which perfect for guests or a hobby room. Storage is never an issue here. Enjoy abundant cabinetry, generous closets, and a charming built-in china cabinet in the dedicated dining area, keeping everything organized and within reach. Upon entering, you’ll be greeted by a spacious bonus room. This inviting
Key facts
- Generous closets
- Spacious bonus room
- Abundant cabinetry
Tags
Property features AI
Finance
- Other: Total annual association fees approximately $2,544
- Financial info: Turnkey (furnished); Lease restrictions apply
- HOA & community: HOA required with approval required; Monthly HOA fee of $212; Association amenities: clubhouse, fitness center, pool, pickleball courts; Association fee covers insurance, grounds maintenance, pool, sewer, trash, and water; Senior community; Buyer approval required; Deed-restricted community; Golf carts allowed; Pets allowed
Exterior
- Parking: Covered parking; Driveway parking; Tandem parking; Carport with 3 spaces
- Utilities: Public water; Public sewer; Cable available; Broadband/high-speed internet available; Electricity available and connected; Sewer and water connected
- Home design: Manufactured double-wide home; Single-story; North-facing entry
- Construction: Metal siding and frame construction; Membrane roof; Crawlspace and slab foundation; Built as a double-wide manufactured home
- Exterior features: Private mailbox; Rain gutters; Sliding doors; Storage; Landscaped lot; Asphalt road frontage
Interior
- Kitchen: Disposal; Microwave; Range; Range hood; Refrigerator; Eat-in kitchen
- Bedrooms: 2 bedrooms
- Flooring: Ceramic tile; Linoleum; Wood; Wood-style flooring
- Bathrooms: 2 full bathrooms
- Heating & cooling: Central heating; Central air; Wall/window AC units
- Interior features: Built-in features; Ceiling fans; Eat-in kitchen; Living/dining layout; Thermostat; Walk-in closets; Window treatments; Blinds
- Laundry & utility: Washer; Dryer; Electric water heater; Laundry located outside
Neighborhood map
What this means for you Summary
Snapshot
- This is a 2-bed/2.0-bath manufactured listed at $135k.
Deal economics
- At list price, monthly cash flow is $640 ($8k/yr) — positive.
- The deal already cash-flows at list — no discount required.
- Meets the 1% rule at list price ($2k rent vs $135k).
- Recommended offer: $119k (12.0% below list) — sets the bar for market timing.
- Cap rate 12.0% vs local median 4.5% in Memphis — top-decile yield for the area; either an underpriced asset or a hidden risk that comps aren't pricing in. Stress-test before assuming the spread holds.
Location & tenants
- Location reads 63/100 on livability (#745 in FL) — a middle-class / working-renter tenant base. Strengths: cost of living A+, housing A+; Watch: employment D+, schools F, amenities F.
- Manatee (suburban): math 54% / reading 50% proficiency, ranked #26 of 73 in FL (top 36%) — acceptable for families but not a draw, mixed tenant base, ~2y average lease.
- Market conditions: Rents soft (-3.0%/yr); 1160 active listings in the ZIP; 29 comparable units currently listed for rent nearby; rentals at typical pace (median 24d on market — plan ~3-4 weeks tenant-placement turnaround); solid renter incomes; 7,472 units permitted in Manatee County in 2024 (1,782 in 5+ unit buildings).
- This rent runs 35% of the median local income ($78k/yr) — at the standard rent-burdened threshold; future hikes will face affordability resistance.
Forward outlook
- Local home prices are declining (-3.0%/yr); year-one equity from $933 of loan paydown is wiped out by about $4k of value loss. Plan a longer hold.
- Manatee County population projected at +43% by 2050 — long-run rental-demand tailwind backs the buy-and-hold thesis.
- At projected returns (-3.0% appreciation + 0.0% rent growth), your $38k cash investment doubles in ~8 years — after that, you're playing with house money.
Negotiation context
- It's been on market 160 days — a 12% lower offer ($119k) is reasonable based on typical stale-listing flexibility.
Risks & watch-outs
- Climate carrying-cost: moderate flood risk; severe wind risk, 99% chance of damaging wind over 30y; extreme-heat days projected 7→29/yr by 2055 (HVAC capex compounding) — expect insurance premiums to compound above CPI over the hold.
Questions for the listing agent
- It's been on market 160 days. Have you received any prior offers? Is the seller open to a 12% concession, seller financing, or rate buy-down credit?
- What does the HOA fee cover, when was the last increase, and are there any pending special assessments or reserve-fund shortfalls?
- Why hasn't it sold? Are there any deal-killer items the seller is aware of (foundation, flood, title, zoning, code violations)?
- Is there a deadline driving the sale (1031 exchange, divorce, estate, relocation)? That informs how much negotiation room exists.
- Schools are F-rated, which usually means shorter tenancies and higher turnover. Who's the typical renter profile here, and what's been the actual vacancy rate?
- What's the average days-on-market for RENTAL listings here right now (not sales)? A rising rental-DOM trend means longer vacancies and softer asking-rent achievability than the comps imply.
- What's the recent tenant-quality profile in this submarket — average credit score on applications, eviction rate, late-payment / NSF rate, and stable-employment percentage? A property-management company in the area should have these aggregated.
- How much new for-sale + rental construction is in the pipeline within 1–3 miles? Heavy new supply typically softens prices + rents 12–24 months out; constrained supply supports both.
Investment metrics
- 1% rule
- 1.67% ✓
- Cap rate
- 11.98%
- Cash-on-cash
- 20.31%
- DSCR
- 1.90
- GRM
- 5.0
CMA / ARV
- ARV (on-the-fly)
- $185,600
- Comps found
- 5
Show comp detail 5 sales within ~0.75 mi
| Address | Dist | Beds/Ba | Sqft | Sold | Price | $/sf | Match |
|---|---|---|---|---|---|---|---|
| 165 Lakeview Dr | 0.10mi | 2/2.0 | 1,242 (-3%) | 3mo | $193,500 | $156 | 88 |
| 312 Peace Mnr | 0.03mi | 2/2.0 | 1,320 (+3%) | 13mo | $115,000 | $87 | 82 |
| 40 Shady Ln #40 | 0.28mi | 2/2.0 | 1,164 (-9%) | 1mo | $195,000 | $168 | 71 |
| 317 Peace Mnr | 0.08mi | 2/2.0 | 1,128 (-12%) | 8mo | $125,000 | $111 | 70 |
| 21 Shady Ln | 0.16mi | 2/2.0 | 1,412 (+10%) | 7mo | $205,000 | $145 | 70 |
Match score weights: distance 35% · size 25% · config 20% · recency 20%. Top-matched comps best support the ARV.
Projected returns pro-forma
-3.0% appreciation · 0.0% rent growth · sell at horizon
- IRR
- 8.7%
- Equity multiple
- 1.33×
- Total profit
- $12,423
- Equity at exit
- $20,129
- IRR
- 14.9%
- Equity multiple
- 2.02×
- Total profit
- $38,376
- Equity at exit
- $11,672
Cash invested: $37,800 (down + closing). Projections, not guarantees.
Landlord ↔ Tenant lean methodology
- Overall (STATE)
- 87 Strongly Landlord-Friendly
- State Florida
- 87 Strongly Landlord-Friendly · R+3
- County
- — inherits STATE
- City
- — inherits STATE
ZIP-level market 34221
- Rents YoY
- -3.0%
- Active inventory
- 1160
- Price-to-rent
- 5.0×
Monthly cashflow live
- Estimated rent
- $2,259 high interval (Pro) →
- Mortgage (P&I)
- −$708
- Tax est. 1.5%
- −$169 /mo · $2,025/yr
- Insurance
- −$56
- HOA
- −$212
- Vacancy / Maint / Mgmt
- −$474
- Net cashflow
- $640
Break-even live
UW: 25.0% down · 7.5% · 30yr · 1.5% tax · 5.0% vac · 8.0% maint · 8.0% mgmt
Financing live
Cash to close
- Down payment
- $33,750
- Closing costs
- $4,050
- Reserves months
- —
- Total cash needed
- —
Loan-product check · same deal, 3 products live
Conventional
25% down · 7.5% · 30yr
- Down + closing
- —
- Monthly P&I
- —
- Monthly cashflow
- —
- DSCR
- —
- Eligible?
- —
Personal DTI + credit; lowest rate.
DSCR
20% down · 8.5% · 30yr
- Down + closing
- —
- Monthly P&I
- —
- Monthly cashflow
- —
- DSCR
- —
- Eligible?
- —
No personal income docs; deal must DSCR.
Hard money
10% down · 12.0% · 12mo
- Down + closing
- —
- Monthly P&I
- —
- Monthly cashflow
- —
- DSCR
- —
- Eligible?
- —
Short-term bridge; refi at stabilization.
Rent comps 29 comps
| Address | Beds | Baths | Sqft | Rent | $/sqft | DOM | Units | Dist |
|---|---|---|---|---|---|---|---|---|
| 3222 6th Ave W Palmetto, FL | 3.0 | 2.0 | 1414 | $2,185 | $1.55 | 23d | 1 | 0.15mi |
| 307 27th St E Palmetto, FL | 2.0 | 2.0 | 980 | $2,000 | $2.04 | 23d | 1 | 0.60mi |
| 1809 5th Ave W Palmetto, FL | 3.0 | 1.0 | 962 | $1,895 | $1.97 | 23d | 1 | 0.61mi |
| 2225 14th Ave W Unit 201 Palmetto, FL | 3.0 | 2.0 | 1550 | $2,275 | $1.47 | 23d | 1 | 0.72mi |
| 2225 14th Ave W Palmetto, FL | 2.0 | 2.0 | 1120 | $1,895 | $1.69 | 23d | 1 | 0.72mi |
| 2225 14th Ave W Unit 204 Palmetto, FL | 2.0 | 2.0 | 1120 | $1,795 | $1.60 | 23d | 1 | 0.72mi |
| 2320 Terra Ceia Bay Blvd #211 Palmetto, FL | 2.0 | 2.0 | 978 | $2,500 | $2.56 | 23d | 1 | 0.72mi |
| 3115 Live Oak Ln #30 Palmetto, FL | 2.0 | 2.0 | 1253 | $3,695 | $2.95 | 23d | 1 | 0.77mi |
| 1514 Fairway Oaks Dr Palmetto, FL | 3.0 | 2.0 | 1461 | $1,540 | $1.05 | 10d | 1 | 0.85mi |
| 4207 5th Ave W Palmetto, FL | 3.0 | 2.0 | 1744 | $3,000 | $1.72 | 23d | 1 | 0.89mi |
| 719 23rd St E Palmetto, FL | 3.0 | 2.0 | 1060 | $1,800 | $1.70 | 10d | 1 | 0.95mi |
| 2602 Edgewater Ct Palmetto, FL | 2.0 | 2.0 | 1253 | $4,000 | $3.19 | 23d | 1 | 0.97mi |
| 2615 9th Avenue Dr E Palmetto, FL | 3.0 | 2.0 | 1369 | $2,200 | $1.61 | 23d | 1 | 0.98mi |
| 1213 15th St W Palmetto, FL | 2.0 | 1.0 | 1000 | $1,800 | $1.80 | 23d | 1 | 0.98mi |
| 2725 Terra Ceia Bay Blvd #102 Palmetto, FL | 2.0 | 2.0 | 1256 | $2,200 | $1.75 | 16d | 1 | 1.01mi |
| 2725 Terra Ceia Bay Blvd #203 Palmetto, FL | 1.0 | 2.0 | 1106 | $3,200 | $2.89 | 23d | 1 | 1.01mi |
| 2725 Terra Ceia Bay Blvd #201 Palmetto, FL | 3.0 | 2.0 | 1486 | $2,200 | $1.48 | 3d | 1 | 1.01mi |
| 2625 Terra Ceia Bay Blvd #802 Palmetto, FL | 2.0 | 2.0 | 1148 | $2,395 | $2.09 | 23d | 1 | 1.02mi |
| 2625 Terra Ceia Bay Blvd #401 Palmetto, FL | 2.0 | 2.0 | 1349 | $3,495 | $2.59 | 23d | 1 | 1.02mi |
| 900 21st St E Palmetto, FL | 2.0–3.0 | 1.0 | 800 | $1,495 | $1.87 | 23d | 1 | 1.03mi |
| 1229 11th Ave W Palmetto, FL | 3.0 | 1.0 | 1072 | $1,800 | $1.68 | 2d | 1 | 1.07mi |
| 2211 11th Ave E Palmetto, FL | 3.0 | 2.0 | 1285 | $2,195 | $1.71 | 16d | 1 | 1.15mi |
| 515 45th St E Palmetto, FL | 2.0 | 2.0 | 900 | $2,100 | $2.33 | 23d | 1 | 1.25mi |
| 4633 1st Ave E Palmetto, FL | 3.0 | 2.5 | 1586 | $1,875 | $1.18 | 3d | 1 | 1.25mi |
| 709 45th St E Palmetto, FL | 2.0 | 2.0 | 1000 | $1,550 | $1.55 | 3d | 1 | 1.28mi |
| 4721 1st Ave E #4721 Palmetto, FL | 3.0 | 2.0 | 1460 | $2,000 | $1.37 | 23d | 1 | 1.29mi |
| 110 49th Ct E Palmetto, FL | 3.0 | 2.0 | 1655 | $1,850 | $1.12 | 3d | 1 | 1.48mi |
| 105 2nd Ave E Palmetto, FL | 3.0 | 2.0 | 1569 | $1,895 | $1.21 | 11d | 1 | 1.49mi |
| 105 2nd Ave E Palmetto, FL | 3.0 | 2.0 | 1569 | $1,895 | $1.21 | 23d | 1 | 1.49mi |
HOA detail
- Monthly dues
- $212 · $2,544/yr
Listing history 12 events
-
2026-06-18days on market $135,000 Active 160 DOM
-
2026-06-17days on market $135,000 Active 159 DOM
-
2026-06-16days on market $135,000 Active 158 DOM
-
2026-06-15days on market $135,000 Active 157 DOM
-
2026-06-13days on market $135,000 Active 155 DOM
-
2026-06-13status $135,000 Active 154 DOM
-
2026-06-08statusdays on market $135,000 Pending 154 DOM
-
2026-06-03days on market $135,000 Active 150 DOM
-
2026-06-02days on market $135,000 Active 149 DOM
-
2026-06-01days on market $135,000 Active 148 DOM
-
2026-05-31days on market $135,000 Active 147 DOM
-
2026-01-04$135,000 Active
ⓘ Source: listings_history table (triggers on properties + properties_extension) + one-shot
backfill from property_details.listing_events for pre-trigger history.
Climate risk First Street
- Flood 5/10 Major FEMA zone X (unshaded) · 23% chance over 30 yrs
- Wildfire 1/10 Low
- Heat 10/10 Extreme 7 d/yr ≥107°F today · 29 d/yr by 30 yrs out
- Wind 10/10 Extreme 99% chance of damaging wind over 30 yrs
- Air quality 3/10 Moderate 2 unhealthy d/yr today · 2 by 30 yrs out
Nearby sold comps map
Loading sold comps map…
Walkable amenities ~0.75 mi
Loading nearby amenities…
Taxation est. · year 1
- Rental income
- $27,112
- − Mortgage interest
- −$7,562
- − Property taxes
- −$2,025
- − Insurance
- −$675
- − Repairs & maintenance
- −$2,169
- − Management
- −$2,169
- − HOA
- −$2,544
- − Depreciation
- −$3,927
- Taxable income
- $6,040
- Est. tax owed @ 24.0%
- −$1,450
- After-tax cash flow
- $6,229/yr
For passive investors: Depreciation is non-cash, so a rental often shows a tax loss while cash-flowing — sheltering income. Rental losses are passive: they offset passive income freely, and up to $25,000/yr can offset ordinary (W-2) income if you actively participate and your MAGI is under $100k (phasing out to $0 by $150k); unused losses carry forward. On sale, claimed depreciation is recaptured at up to 25%, and gains may owe capital-gains tax (a 1031 exchange can defer both). Figures are a year-1 estimate at your 24.0% rate — not tax advice; consult a CPA.
Schools (NCES district)
- District
- Manatee
- NCES district ID
- 1201230
- Math proficiency
- 54% ▼ -6.00%
- Reading proficiency
- 50% ▼ -2.00%
- Median HH income
- $49,607
- Composite
- 44.43/100
- National rank
- #2806
- State rank
- #26 of 73 in FL
Livability — Memphis
- Score
- 63/100
- State rank
- #745
- US rank
- #16072
Category grades
Schools grade is shown separately in the Schools card above.
Census & demographics
- Census place
- Memphis, FL
- County
- Manatee County · 416,364 people
- Metro
- North Port-Sarasota-Bradenton, FL
- Population (ZIP)
- 56,208
- Household income
- $77,712
- Rent vs Own
- Severe rent burden
- 1193.0
Population outlook (Manatee County) Hauer SSP2
- Today (2025)
- 447,342 people
- By 2030
- 488,911 · +9.3%
- By 2040
- 567,934 · +27.0%
- By 2050
- 637,995 · +42.6%
- By 2075
- 781,970 · +74.8%
- By 2100
- 848,272 · +89.6%
Race, ethnicity, and origin ACS 2023
- Neighborhood character
- Diverse neighborhood (Simpson 0.58)
- Race & ethnicity
- White 59% Hispanic / Latino 22% Black 14% Two or more races 11%
- Hispanic origin (detail)
- Mexican 14% Puerto Rican 3%
- Common ancestry
- Romanian 2% Lithuanian 2% Italian 2%
- Foreign-born
- 10% · Canada, Dominican Republic, Jamaica
- Languages at home
- 81% English-only · Spanish 16% Other Indo-European 1%
Political lean MEDSL · Manatee
- 2024 margin
- Strong R (+23.5) · D 37.9% · R 61.4%
- 2008→2024 swing
- -16.5pp toward R · 2008: -7.0pp · 2024: -23.5pp
- All cycles
- 2024: R+23.5 2020: R+16.1 2016: R+17.1 2012: R+12.5 2008: R+7.0
Not yet ingested
- Civics
- —
Market trends
- HPI YoY
- ▼ -383.53%
- Current HPI
- 302.1458
- Rent YoY
- ▼ -2.98%
- Metro
- North Port-Sarasota-Bradenton, FL
- State GDP YoY
- ▲ 3.28%
- F500 in state
- 36
Industry mix (Fortune 500 HQ in FL)
| Industry | F500 HQs | Revenue |
|---|---|---|
| Industrial Technology | 2 | $29B |
|
||
| Insurance | 2 | $17B |
|
||
| Retail | 1 | $60B |
|
||
| Technology Distribution | 1 | $58B |
|
||
| Homebuilding | 1 | $35B |
|
||
| Technology Manufacturing | 1 | $35B |
|
||
Price history
1 event — show timeline
- 2026-01-04 Listed $135,000 Stellar MLS as Distributed by MLS Grid
Cash-flow waterfall
monthlySold comps — $/sqft
last 12 mo · ≤1 miLoading sold comps…