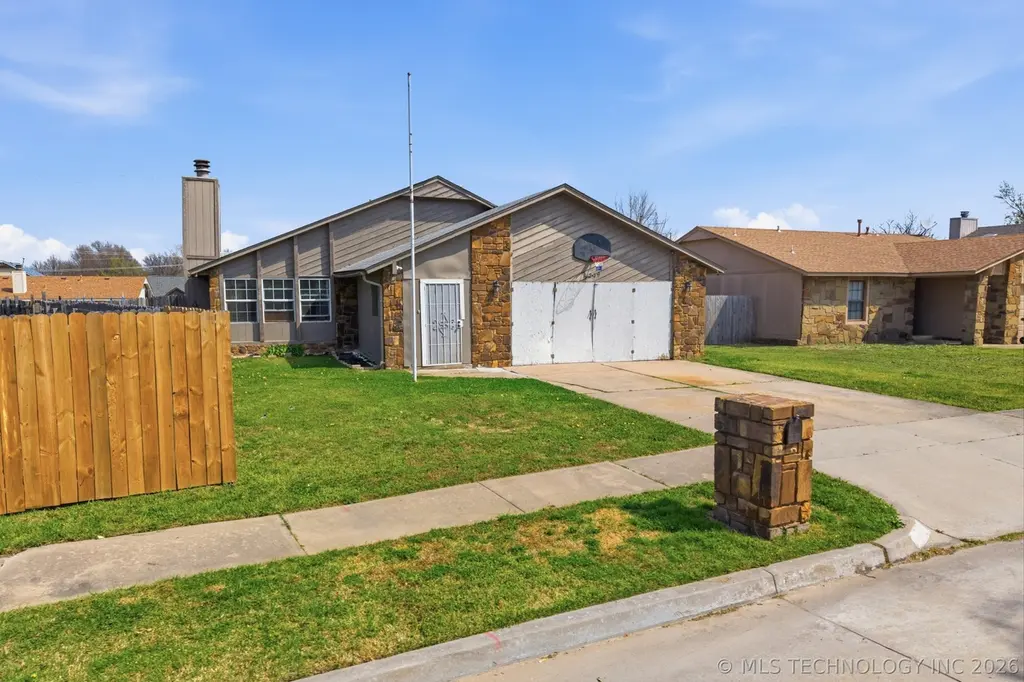
14209 E 37th Pl · Tulsa, OK
Flood risk 1/10 · Minimal
- FEMA flood zone
- X (unshaded)
- Chance of flooding over 30 yrs
- 0.0%
- Est. flood insurance / yr
- $473 – $860
Fire risk 4/10 · Minor
- Est. fire insurance / yr
- $2,463 – $4,575
Heat risk 7/10 · Major
- Hot days now (above 110°F)
- 7 days/yr
- Hot days in 30 yrs
- 18 days/yr
Wind risk 3/10 · Minor
- Chance of severe wind over 30 yrs
- 5.0%
Air-quality risk 2/10 · Minimal
- Unhealthy air days now
- 1 days/yr
- Unhealthy air days in 30 yrs
- 1 days/yr
Risk factors via First Street. Map © Google.
Why this score? — see what drove the D grade
The composite is a weighted blend of 9 inputs, each scored 0–100. Each bar is that input's sub-score; the figure is the points it added to the 100-point composite (weight × sub-score).
- Cash flow +11.6/30.0
- ARV discount +11.1/15.0
- Livability +3.8/5.0
- DSCR +3.4/10.0
- Rent growth +3.4/5.0
- 1% rule +2.5/10.0
- Condition / age +2.5/5.0
- Schools +1.8/10.0
- Appreciation +0.0/10.0
$210,000
🖨 Deal sheet 📄 Offer letter ✓ Due diligence
Listing remarks
Discover the potential in this charming three-bedroom, two-bath home located in the desirable Summer Glen Plaza Park community within the highly sought-after Union School District. Whether you're a first-time buyer or an investor, this home offers the perfect opportunity to build equity while enjoying a functional and inviting layout. Inside, you'll find a spacious floor plan featuring a generously sized primary suite, a remodeled kitchen, and a bright, versatile sunroom- ideal for a second living area, home office, or entertaining space. Major updates including HVAC, electrical, windows, doors, and locks provide a strong foundation and added peace of mind, allowing you to focus on personal
Key facts
- 9,236 sq ft lot
- 2 garage spots
- Built 1983
Property features AI
Finance
- HOA & community: Gutters listed as a community feature
Exterior
- Parking: Attached garage with 2 spaces
- Security: Owned security system; Smoke detector(s); No safety shelter
- Utilities: Public water; Public sewer; Electricity available; Natural gas available; Cable available; High-speed internet available
- Home design: Single-story; Faces south; Slab foundation
- Construction: HardiPlank, stone, and wood frame construction; Asphalt/fiberglass roof; Built (year per public records)
- Exterior features: Concrete driveway; Rain gutters; Privacy fence; Enclosed porch
Interior
- Kitchen: Electric oven connection; Electric range connection; Oven; Range
- Flooring: Laminate flooring
- Bathrooms: 2 full bathrooms
- Heating & cooling: Central heating (gas); Central air conditioning
- Interior features: Vaulted ceilings; Laminate counters; Cable TV available; High-speed internet available; Vinyl windows; Smoke detectors
- Laundry & utility: Washer hookup; Electric dryer hookup; Gas dryer hookup; Washer; Dryer; Gas water heater
Neighborhood map
What this means for you Summary
Snapshot
- This is a 3-bed/2.0-bath single-family listed at $210k.
Deal economics
- At list price, monthly cash flow is $-64 ($-772/yr) — negative.
- To cash-flow at today's rent, offer at most $199k (5.4% below list).
- To meet the 1% rule (rent ≥ 1% of price), the offer needs to be $157k (25.4% below list).
- Recommended offer: $157k (25.4% below list) — sets the bar for 1% rule.
- Cap rate 5.9% vs local median 3.9% in Tulsa — top-decile yield for the area; either an underpriced asset or a hidden risk that comps aren't pricing in. Stress-test before assuming the spread holds.
Location & tenants
- Location reads 75/100 on livability (#13 in OK, #4,058 nationally) — a middle-class / working-renter tenant base. Strengths: amenities A+, commute A+, cost of living A+; Watch: schools F, crime F, employment D-.
- Union (urban): math 20% / reading 20% proficiency, ranked #160 of 270 in OK (top 59%) — low school quality limits family demand, transient renter base, plan for 1-2y turnover.
- Market conditions: Rents rising (+3.5%/yr); 195 active listings in the ZIP; 13 comparable units currently listed for rent nearby; rentals leasing fast (median 12d on market — plan ~1-2 weeks tenant-placement turnaround); 2,818 units permitted in Tulsa County in 2024 (518 in 5+ unit buildings).
Forward outlook
- Local home prices are declining (-3.0%/yr); year-one equity from $1k of loan paydown is wiped out by about $6k of value loss. Plan a longer hold.
- Tulsa County population projected at +30% by 2050 — long-run rental-demand tailwind backs the buy-and-hold thesis.
Negotiation context
- It's been on market 84 days — a 6% lower offer ($197k) is reasonable based on typical stale-listing flexibility.
- 5 sale attempts since 27y ago with the ask held roughly flat each time — persistent listings suggest the price (not the market) is what's stuck; bring a comps-based counter.
- Current owner paid $125k; list at $210k implies a 68% gain — meaningful room to come down on a strong offer.
Risks & watch-outs
- Climate carrying-cost: extreme-heat days projected 7→18/yr by 2055 (HVAC capex compounding) — expect insurance premiums to compound above CPI over the hold.
Questions for the listing agent
- What do current leases actually rent for vs. the listed asking? Can we see a recent rent roll and the last 12 months of T-12 income?
- It's been on market 84 days. Have you received any prior offers? Is the seller open to a 25% concession, seller financing, or rate buy-down credit?
- Why hasn't it sold? Are there any deal-killer items the seller is aware of (foundation, flood, title, zoning, code violations)?
- Is there a deadline driving the sale (1031 exchange, divorce, estate, relocation)? That informs how much negotiation room exists.
- Schools are F-rated, which usually means shorter tenancies and higher turnover. Who's the typical renter profile here, and what's been the actual vacancy rate?
- Crime grade is F in this area — have there been break-ins, vandalism, or insurance claims at this property in the last 3 years? What carrier currently insures it and at what premium?
- The area grade is low — what's the realistic commute time and amenity access for the typical tenant pool here? Any planned neighborhood developments (good or bad) we should know about?
- What's the average days-on-market for RENTAL listings here right now (not sales)? A rising rental-DOM trend means longer vacancies and softer asking-rent achievability than the comps imply.
- What's the recent tenant-quality profile in this submarket — average credit score on applications, eviction rate, late-payment / NSF rate, and stable-employment percentage? A property-management company in the area should have these aggregated.
- How much new for-sale + rental construction is in the pipeline within 1–3 miles? Heavy new supply typically softens prices + rents 12–24 months out; constrained supply supports both.
Investment metrics
- 1% rule
- 0.75% ✗
- Cap rate
- 5.93%
- Cash-on-cash
- -1.31%
- DSCR
- 0.94
- GRM
- 11.2
CMA / ARV
- ARV (on-the-fly)
- $228,240
- Comps found
- 12
Show comp detail 12 sales within ~0.75 mi
| Address | Dist | Beds/Ba | Sqft | Sold | Price | $/sf | Match |
|---|---|---|---|---|---|---|---|
| 3804 S 146 EastAvenue | 0.26mi | 3/2.0 | 1,239 (-2%) | 1mo | $234,000 | $189 | 83 |
| 3544 S 150th EastAvenue | 0.49mi | 3/2.0 | 1,262 (-0%) | 7mo | $145,000 | $115 | 70 |
| 14811 E 32nd St | 0.66mi | 3/2.0 | 1,284 (+1%) | 0mo | $205,000 | $160 | 67 |
| 3437 S 148th EastAvenue | 0.45mi | 3/2.0 | 1,349 (+6%) | 4mo | $145,000 | $107 | 65 |
| 14715 E 39th St S | 0.41mi | 3/2.0 | 1,419 (+12%) | 3mo | $259,999 | $183 | 58 |
| 14618 E 39th St S | 0.34mi | 3/2.0 | 1,419 (+12%) | 7mo | $261,000 | $184 | 58 |
| 3727 S 151st East Ave | 0.63mi | 3/2.0 | 1,156 (-9%) | 2mo | $225,000 | $195 | 54 |
| 14827 E 39th St S | 0.49mi | 3/2.0 | 1,419 (+12%) | 4mo | $250,000 | $176 | 54 |
| 3740 S 150th EastAvenue | 0.55mi | 3/2.0 | 1,423 (+12%) | 7mo | $256,350 | $180 | 48 |
| 3938 S 148th EastPlace | 0.52mi | 3/2.0 | 1,456 (+15%) | 4mo | $269,900 | $185 | 48 |
| 15119 E 35th St | 0.67mi | 3/2.0 | 1,420 (+12%) | 3mo | $175,000 | $123 | 47 |
| 3743 S 153rd Ave E | 0.74mi | 3/2.0 | 1,431 (+13%) | 4mo | $240,000 | $168 | 41 |
Match score weights: distance 35% · size 25% · config 20% · recency 20%. Top-matched comps best support the ARV.
Projected returns pro-forma
-3.0% appreciation · 3.52% rent growth · sell at horizon
- IRR
- -18.0%
- Equity multiple
- 0.36×
- Total profit
- $-37,372
- Equity at exit
- $31,312
- IRR
- -9.4%
- Equity multiple
- 0.41×
- Total profit
- $-34,680
- Equity at exit
- $18,157
Cash invested: $58,800 (down + closing). Projections, not guarantees.
Landlord ↔ Tenant lean methodology
- Overall (STATE)
- 83 Strongly Landlord-Friendly
- State Oklahoma
- 83 Strongly Landlord-Friendly · R+20
- County
- — inherits STATE
- City
- — inherits STATE
ZIP-level market 74134
- Home prices YoY
- -25.5%
- Rents YoY
- 3.5%
- Active inventory
- 195
- Price-to-rent
- 11.2×
Monthly cashflow live
- Estimated rent
- $1,567 high interval (Pro) →
- Mortgage (P&I)
- −$1,101
- Tax from tax record
- −$113 /mo · $1,360/yr
- Insurance
- −$88
- HOA
- −$0
- Vacancy / Maint / Mgmt
- −$329
- Net cashflow
- $-64
Break-even live
UW: 25.0% down · 7.5% · 30yr · 1.5% tax · 5.0% vac · 8.0% maint · 8.0% mgmt
Financing live
Cash to close
- Down payment
- $52,500
- Closing costs
- $6,300
- Reserves months
- —
- Total cash needed
- —
Loan-product check · same deal, 3 products live
Conventional
25% down · 7.5% · 30yr
- Down + closing
- —
- Monthly P&I
- —
- Monthly cashflow
- —
- DSCR
- —
- Eligible?
- —
Personal DTI + credit; lowest rate.
DSCR
20% down · 8.5% · 30yr
- Down + closing
- —
- Monthly P&I
- —
- Monthly cashflow
- —
- DSCR
- —
- Eligible?
- —
No personal income docs; deal must DSCR.
Hard money
10% down · 12.0% · 12mo
- Down + closing
- —
- Monthly P&I
- —
- Monthly cashflow
- —
- DSCR
- —
- Eligible?
- —
Short-term bridge; refi at stabilization.
Rent comps 13 comps
| Address | Beds | Baths | Sqft | Rent | $/sqft | DOM | Units | Dist |
|---|---|---|---|---|---|---|---|---|
| 3121 S 145th East Ave Tulsa, OK | 1.0–2.0 | 1.0–2.0 | 825 | $1,200 | $1.45 | 3d | 1 | 0.51mi |
| 3208 S 137th East Ave Tulsa, OK | 3.0 | 2.0 | 1367 | $1,578 | $1.15 | 3d | 1 | 0.52mi |
| 14826 E 39th St S Tulsa, OK | 4.0 | 2.0 | 1691 | $1,980 | $1.17 | 11d | 1 | 0.53mi |
| 4020 S 130th East Ave Tulsa, OK | 1.0–2.0 | 1.0–2.0 | 737 | $1,245 | $1.69 | 21d | 4 | 0.82mi |
| 4104 S 130th East Ave Tulsa, OK | 1.0–2.0 | 1.0–2.0 | 750 | $1,299 | $1.73 | 11d | 23 | 0.86mi |
| 13102 E 30th St Tulsa, OK | 3.0 | 2.0 | 1190 | $1,395 | $1.17 | 23d | 1 | 0.89mi |
| 13102 E 30th St Tulsa, OK | 3.0 | 2.0 | 1190 | $1,395 | $1.17 | 19d | 1 | 0.89mi |
| 13809 E 27th Pl Tulsa, OK | 4.0 | 2.0 | 1741 | $1,785 | $1.03 | 21d | 1 | 1.00mi |
| 3311 S 126th East Ave Tulsa, OK | 3.0 | 2.0 | 1395 | $1,650 | $1.18 | 23d | 1 | 1.03mi |
| 12525 E 41st St Tulsa, OK | 1.0–2.0 | 1.0–2.0 | 775 | $1,300 | $1.68 | 21d | 1 | 1.05mi |
| 2336 S 137th East Ave Tulsa, OK | 1.0–3.0 | 1.0–2.0 | 1080 | $1,499 | $1.39 | 1d | 1 | 1.33mi |
| 5091 S 136th East Ave Tulsa, OK | 3.0 | 1.0–2.0 | 955 | $1,760 | $1.84 | 3d | 18 | 1.35mi |
| 13777 E 51st St Tulsa, OK | 1.0–3.0 | 1.0–2.0 | 972 | $1,425 | $1.47 | 2d | 10 | 1.38mi |
Listing history 28 events
-
2026-06-18days on market $210,000 Active 84 DOM
-
2026-06-17days on market $210,000 Active 83 DOM
-
2026-06-16days on market $210,000 Active 82 DOM
-
2026-06-15days on market $210,000 Active 81 DOM
-
2026-06-13days on market $210,000 Active 79 DOM
-
2026-06-13days on market $210,000 Active 78 DOM
-
2026-06-10days on market $210,000 Active 76 DOM
-
2026-06-09days on market $210,000 Active 75 DOM
-
2026-06-08days on market $210,000 Active 74 DOM
-
2026-06-07days on market $210,000 Active 73 DOM
-
2026-06-05days on market $210,000 Active 70 DOM
-
2026-06-03days on market $210,000 Active 69 DOM
-
2026-06-02days on market $210,000 Active 68 DOM
-
2026-06-01days on market $210,000 Active 67 DOM
-
2026-05-31days on market $210,000 Active 66 DOM
-
2026-03-26$210,000 Active
-
2025-01-23historical
-
2024-12-27$205,000 Active
-
2024-11-15historical
-
2024-06-25$190,000 Active
-
2017-04-27soldstatus $125,000
-
2017-04-25soldstatus $124,900 Closed
-
2017-02-27status Pending
-
2017-02-17$124,900 Active
-
1999-11-03soldstatus $86,000
-
1999-10-29soldstatus $85,900
-
1999-09-28historical
-
1999-09-18$86,900
ⓘ Source: listings_history table (triggers on properties + properties_extension) + one-shot
backfill from property_details.listing_events for pre-trigger history.
Tax reassessment forecast OK · Resets to sale price
- Current annual tax
- $1,360 · $113/mo
- Projected year-2 tax
- $1,890 · $157/mo
- Expected delta
- +$530/yr (+$44/mo · 39.0%)
ⓘ Screening estimate from a state-policy table — verify with the county assessor before closing.
Climate risk First Street
- Flood 1/10 Low FEMA zone X (unshaded) · 0% chance over 30 yrs
- Wildfire 4/10 Moderate
- Heat 7/10 Severe 7 d/yr ≥110°F today · 18 d/yr by 30 yrs out
- Wind 3/10 Moderate 5% chance of damaging wind over 30 yrs
- Air quality 2/10 Low 1 unhealthy d/yr today · 1 by 30 yrs out
Nearby sold comps map
Loading sold comps map…
Walkable amenities ~0.75 mi
Loading nearby amenities…
Taxation est. · year 1
- Rental income
- $18,801
- − Mortgage interest
- −$11,763
- − Property taxes
- −$1,360
- − Insurance
- −$1,050
- − Repairs & maintenance
- −$1,504
- − Management
- −$1,504
- − Depreciation
- −$6,109
- Taxable loss
- −$4,489
- Est. tax savings @ 24.0%
- +$1,077
- After-tax cash flow
- $305/yr
For passive investors: Depreciation is non-cash, so a rental often shows a tax loss while cash-flowing — sheltering income. Rental losses are passive: they offset passive income freely, and up to $25,000/yr can offset ordinary (W-2) income if you actively participate and your MAGI is under $100k (phasing out to $0 by $150k); unused losses carry forward. On sale, claimed depreciation is recaptured at up to 25%, and gains may owe capital-gains tax (a 1031 exchange can defer both). Figures are a year-1 estimate at your 24.0% rate — not tax advice; consult a CPA.
Schools (NCES district)
- District
- Union
- NCES district ID
- 4030600
- Math proficiency
- 20% ▼ -9.00%
- Reading proficiency
- 20% ▼ -9.00%
- Median HH income
- $52,744
- Composite
- 18.18/100
- National rank
- #8962
- State rank
- #160 of 270 in OK
Livability — Tulsa
- Score
- 75/100
- State rank
- #13
- US rank
- #4058
Category grades
Schools grade is shown separately in the Schools card above.
Census & demographics
- Census place
- Tulsa, OK
- County
- Tulsa County · 640,811 people
- City population
- 389,418
- Metro
- Tulsa, OK
- Population (ZIP)
- 23,323
- Household income
- $73,119
- Rent vs Own
- Severe rent burden
- 608.0
Population outlook (Tulsa County) Hauer SSP2
- Today (2025)
- 723,846 people
- By 2030
- 766,033 · +5.8%
- By 2040
- 851,386 · +17.6%
- By 2050
- 938,389 · +29.6%
- By 2075
- 1,166,011 · +61.1%
- By 2100
- 1,350,277 · +86.5%
Race, ethnicity, and origin ACS 2023
- Neighborhood character
- Highly diverse neighborhood (Simpson 0.70)
- Race & ethnicity
- White 46% Hispanic / Latino 26% Two or more races 15% Black 10% Asian 7% Native American 5%
- Hispanic origin (detail)
- Mexican 20%
- Common ancestry
- Slovak 1% Lithuanian 1% Italian 1%
- Foreign-born
- 18% · Canada, Vietnam, South Korea
- Languages at home
- 71% English-only · Spanish 22% Other Asian/Pacific 3% Vietnamese 2%
Political lean MEDSL · Tulsa
- 2024 margin
- R (+15.2) · D 41.3% · R 56.5% · Other 2.2%
- 2008→2024 swing
- +9.2pp toward D · 2008: -24.5pp · 2024: -15.2pp
- All cycles
- 2024: R+15.2 2020: R+15.6 2016: R+22.9 2012: R+27.4 2008: R+24.5
Not yet ingested
- Civics
- —
Market trends
- HPI YoY
- ▼ -68.07%
- Current HPI
- 198.7031
- Rent YoY
- ▲ 3.52%
- Metro
- Tulsa, OK
- State GDP YoY
- ▲ 1.55%
- F500 in state
- 6
Industry mix (Fortune 500 HQ in OK)
| Industry | F500 HQs | Revenue |
|---|---|---|
| Energy | 3 | $48B |
|
||
Price history
+141.7% since first listed13 events — show timeline
- 2026-03-26 Listed $210,000 MLS Technology, Inc.
- 2025-01-23 Listing Removed — MLS Technology, Inc.
- 2024-12-27 Listed $205,000 MLS Technology, Inc.
- 2024-11-15 Listing Removed — MLS Technology, Inc.
- 2024-06-25 Listed $190,000 MLS Technology, Inc.
- 2017-04-27 Sold (Public Records) $125,000 Public Records
- 2017-04-25 Sold (MLS) $124,900 MLS Technology, Inc.
- 2017-02-27 Pending — MLS Technology, Inc.
- 2017-02-17 Listed $124,900 MLS Technology, Inc.
- 1999-11-03 Sold (Public Records) $86,000 Public Records
- 1999-10-29 Sold (MLS) $85,900 MLS Technology, Inc.
- 1999-09-28 Listing Removed — MLS Technology, Inc.
- 1999-09-18 Listed $86,900 MLS Technology, Inc.
Property tax history
+2.0%/yrLatest (2017): $1,360 · +5.7% YoY. Source: county tax records.
Cash-flow waterfall
monthlySold comps — $/sqft
last 12 mo · ≤1 miLoading sold comps…