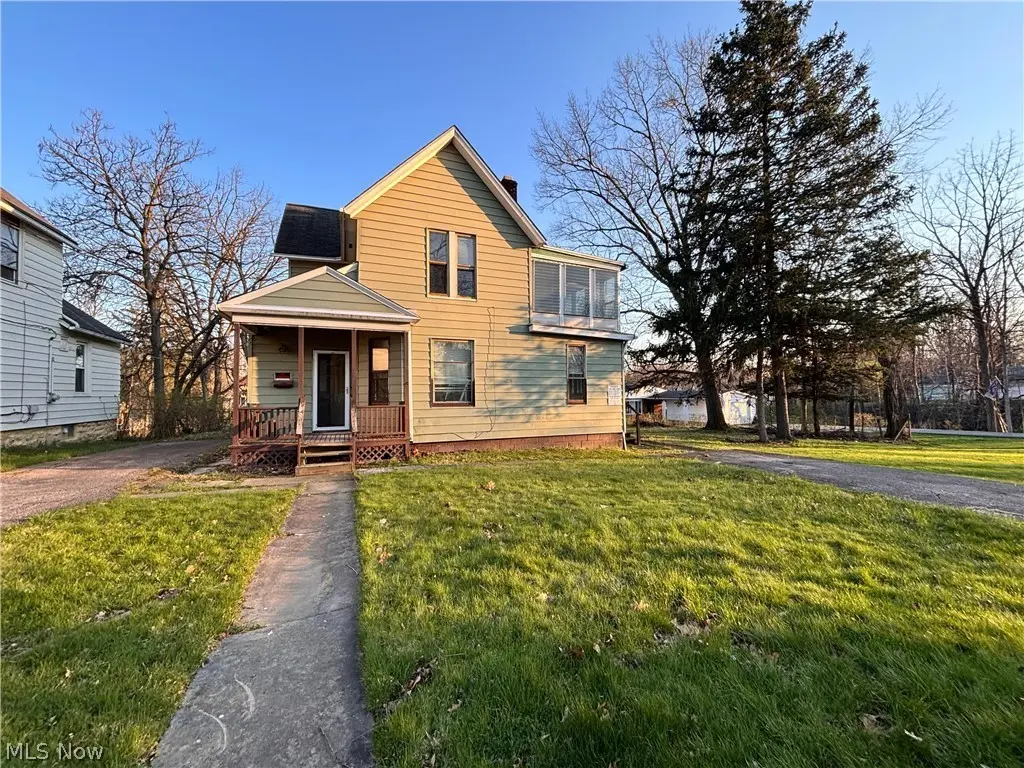
78 W Glendale Rd · Bedford, OH
Flood risk 1/10 · Minimal
- FEMA flood zone
- X (unshaded)
- Chance of flooding over 30 yrs
- 0.0%
- Est. flood insurance / yr
- $473 – $860
Fire risk 1/10 · Minimal
- Est. fire insurance / yr
- $713 – $1,323
Heat risk 2/10 · Minimal
- Hot days now (above 94°F)
- 7 days/yr
- Hot days in 30 yrs
- 17 days/yr
Wind risk 1/10 · Minimal
- Chance of severe wind over 30 yrs
- —
Air-quality risk 3/10 · Minor
- Unhealthy air days now
- 2 days/yr
- Unhealthy air days in 30 yrs
- 4 days/yr
Risk factors via First Street. Map © Google.
Why this score? — see what drove the B+ grade
The composite is a weighted blend of 9 inputs, each scored 0–100. Each bar is that input's sub-score; the figure is the points it added to the 100-point composite (weight × sub-score).
- Cash flow +30.0/30.0
- ARV discount +15.0/15.0
- 1% rule +10.0/10.0
- DSCR +10.0/10.0
- Rent growth +4.0/5.0
- Livability +3.7/5.0
- Condition / age +2.5/5.0
- Schools +2.2/10.0
- Appreciation +0.0/10.0
$100,000
🖨 Deal sheet (PDF) 📄 Offer letter ✓ Due diligence
Listing remarks MLS
3-bedroom 2 bath home located in historic Bedford, ready for full renovation. Located in a nice suburb with convenient access to major freeways, as well as nearby local shops, restaurants for everyday living. This property offers a solid opportunity for investors or buyers looking to complete a full rehab project. Walk-out basement offers potential for added living space, including additional bedrooms or a finished recreation area. Investor highlights: - Estimated ARV: $220,000+ based on neighborhood comps -Strong rental potential - Suitable for fix & flip or long-term hold - Full rehab required Owner-occupant highlights: - Opportunity to customize finishes and layout to your preferences - Potential to build equity through renovation - Located in a well-established community with access to daily needs No wholesale or assignments. Cash preferred. No blind offers. Buyer to perform their own due diligence. All information deemed accurate but not guaranteed. Property is being sold as-is.
Key facts
- 8,751 sq ft lot
- Parking
- Built 1952
Neighborhood map
What this means for you Summary
Snapshot
- This is a 3-bed/1.0-bath single-family listed at $100k.
Deal economics
- At list price, monthly cash flow is $573 ($7k/yr) — positive.
- The deal already cash-flows at list — no discount required.
- Meets the 1% rule at list price ($2k rent vs $100k).
- Recommended offer: $94k (6.0% below list) — sets the bar for market timing.
- Cap rate 13.2% vs local median 5.3% in Bedford — top-decile yield for the area; either an underpriced asset or a hidden risk that comps aren't pricing in. Stress-test before assuming the spread holds.
Location & tenants
- Location reads 73/100 on livability (#324 in OH) — a middle-class / working-renter tenant base. Strengths: crime A+, cost of living A+, housing A+; Watch: amenities F, commute F, employment D-.
- Bedford City (suburban): math 19% / reading 32% proficiency, ranked #597 of 656 in OH (top 91%) — low school quality limits family demand, transient renter base, plan for 1-2y turnover.
- Zoned schools: Glendale Primary School (math 24% / reading 27%, grade F, #1,211 of 1,584 statewide, top 76%, 291 students, 66% FRL); Heskett Middle School (math 21% / reading 27%, grade F, #593 of 654 statewide, top 91%, 573 students, 69% FRL); Bedford High School (math 12% / reading 52%, grade F, #607 of 781 statewide, top 78%, 862 students, 69% FRL).
- Market conditions: Rents rising fast (+5.8%/yr); 107 active listings in the ZIP; 8 comparable units currently listed for rent nearby; rentals at typical pace (median 18d on market — plan ~3-4 weeks tenant-placement turnaround); 1,441 units permitted in Cuyahoga County in 2024 (700 in 5+ unit buildings).
- This rent runs 35% of the median local income ($55k/yr) — at the standard rent-burdened threshold; future hikes will face affordability resistance.
Forward outlook
- Local home prices are declining (-3.0%/yr); year-one equity from $691 of loan paydown is wiped out by about $3k of value loss. Plan a longer hold.
- Cuyahoga County population projected to shrink 8% by 2050 — rents likely to lag national; underwrite the cash flow, not the appreciation.
- At projected returns (-3.0% appreciation + 5.8% rent growth), your $28k cash investment doubles in ~5 years — after that, you're playing with house money.
Negotiation context
- It's been on market 81 days — a 6% lower offer ($94k) is reasonable based on typical stale-listing flexibility.
- 2 sale attempts since 23y ago; this cycle's ask is 809% above the opening price — seller raised mid-cycle; expect resistance to lowballs.
Risks & watch-outs
- Watch-outs: built in 1952 — expect roof / HVAC / electrical / plumbing capex.
Questions for the listing agent
- It's been on market 81 days. Have you received any prior offers? Is the seller open to a 6% concession, seller financing, or rate buy-down credit?
- Built in 1952 — when were the roof, HVAC, electrical panel, plumbing, and water heater last replaced?
- Why hasn't it sold? Are there any deal-killer items the seller is aware of (foundation, flood, title, zoning, code violations)?
- Is there a deadline driving the sale (1031 exchange, divorce, estate, relocation)? That informs how much negotiation room exists.
- What's the average days-on-market for RENTAL listings here right now (not sales)? A rising rental-DOM trend means longer vacancies and softer asking-rent achievability than the comps imply.
- What's the recent tenant-quality profile in this submarket — average credit score on applications, eviction rate, late-payment / NSF rate, and stable-employment percentage? A property-management company in the area should have these aggregated.
- How much new for-sale + rental construction is in the pipeline within 1–3 miles? Heavy new supply typically softens prices + rents 12–24 months out; constrained supply supports both.
Investment metrics
- 1% rule
- 1.60% ✓
- Cap rate
- 13.17%
- Cash-on-cash
- 24.58%
- DSCR
- 2.09
- GRM
- 5.2
CMA / ARV
- ARV (median comp)
- $165,054
- List price
- $100,000
- Delta
- -39.41%
- Verdict
- UNDERPRICED
- Comps
- 20 within 1.0 mi
Show comp detail 12 sales within ~0.75 mi
| Address | Dist | Beds/Ba | Sqft | Sold | Price | $/sf | Match |
|---|---|---|---|---|---|---|---|
| 207 Forest Dr | 0.27mi | 3/2.5 | 1,788 (-6%) | 2mo | $210,000 | $117 | 70 |
| 48 Gould Ave | 0.50mi | 3/1.5 | 1,830 (-4%) | 9mo | $175,000 | $96 | 62 |
| 27 Ennis Ave | 0.49mi | 3/1.5 | 1,826 (-4%) | 17mo | $210,000 | $115 | 55 |
| 185 Eldred Ave | 0.51mi | 4/2.0 (+1) | 1,824 (-4%) | 12mo | $249,900 | $137 | 51 |
| 110 Powers Rd | 0.43mi | 4/2.5 (+1) | 1,817 (-4%) | 17mo | $279,900 | $154 | 48 |
| 274 W Glendale St | 0.38mi | 4/1.0 (+1) | 1,697 (-10%) | 15mo | $176,900 | $104 | 47 |
| 205 Logan St | 0.64mi | 3/1.0 | 1,743 (-8%) | 15mo | $203,000 | $116 | 44 |
| 46 Wandle Ave | 0.44mi | 4/3.0 (+1) | 1,644 (-13%) | 3mo | $281,000 | $171 | 42 |
| 738 Washington St | 0.68mi | 4/2.0 (+1) | 2,028 (+7%) | 10mo | $240,000 | $118 | 39 |
| 120 Grand Blvd | 0.56mi | 3/1.5 | 1,650 (-13%) | 17mo | $148,000 | $90 | 36 |
| 67 Southwick Dr | 0.46mi | 4/1.5 (+1) | 1,642 (-13%) | 18mo | $210,000 | $128 | 34 |
| 131 Noran Cir | 0.58mi | 4/3.5 (+1) | 2,151 (+13%) | 2mo | $307,000 | $143 | 34 |
Match score weights: distance 35% · size 25% · config 20% · recency 20%. Top-matched comps best support the ARV.
Projected returns pro-forma
-3.0% appreciation · 5.83% rent growth · sell at horizon
- IRR
- 21.1%
- Equity multiple
- 1.89×
- Total profit
- $25,033
- Equity at exit
- $14,910
- IRR
- 31.1%
- Equity multiple
- 4.19×
- Total profit
- $89,313
- Equity at exit
- $8,646
Cash invested: $28,000 (down + closing). Projections, not guarantees.
Landlord ↔ Tenant lean methodology
- Overall (STATE)
- 73 Landlord-Friendly
- State Ohio
- 73 Landlord-Friendly · R+6
- County
- — inherits STATE
- City
- — inherits STATE
ZIP-level market 44146
- Rents YoY
- 5.8%
- Active inventory
- 107
- Price-to-rent
- 5.2×
Monthly cashflow live
- Estimated rent
- $1,601 high interval (Pro) →
- Mortgage (P&I)
- −$524
- Tax est. 1.5%
- −$125 /mo · $1,500/yr
- Insurance
- −$42
- HOA
- −$0
- Vacancy / Maint / Mgmt
- −$336
- Net cashflow
- $573
Break-even live
Sensitivity live
| Price | -10% $643 | -5% $608 | +0% $573 | +5% $539 | +10% $504 |
|---|---|---|---|---|---|
| Rent | -10% $447 | -5% $510 | +0% $573 | +5% $637 | +10% $700 |
| Rate | -1.0pp $624 | -0.5pp $599 | base $573 | +0.5pp $548 | +1.0pp $521 |
UW: 25.0% down · 7.5% · 30yr · 1.5% tax · 5.0% vac · 8.0% maint · 8.0% mgmt
Financing live
Cash to close
- Down payment
- $25,000
- Closing costs
- $3,000
- Reserves months
- —
- Total cash needed
- —
Loan-product check · same deal, 3 products live
Conventional
25% down · 7.5% · 30yr
- Down + closing
- —
- Monthly P&I
- —
- Monthly cashflow
- —
- DSCR
- —
- Eligible?
- —
Personal DTI + credit; lowest rate.
DSCR
20% down · 8.5% · 30yr
- Down + closing
- —
- Monthly P&I
- —
- Monthly cashflow
- —
- DSCR
- —
- Eligible?
- —
No personal income docs; deal must DSCR.
Hard money
10% down · 12.0% · 12mo
- Down + closing
- —
- Monthly P&I
- —
- Monthly cashflow
- —
- DSCR
- —
- Eligible?
- —
Short-term bridge; refi at stabilization.
Rent comps 8 comps
| Address | Beds | Baths | Sqft | Rent | $/sqft | DOM | Units | Dist |
|---|---|---|---|---|---|---|---|---|
| 286 W Grace St Bedford, OH | 3.0 | 1.0 | 1254 | $1,500 | $1.20 | 18d | 1 | 0.38mi |
| 14 Elm St Bedford, OH | 3.0 | 2.0 | 2184 | $1,600 | $0.73 | 4d | 1 | 0.46mi |
| 5713 South Blvd Maple Heights, OH | 3.0 | 1.0 | 1700 | $2,300 | $1.35 | 3d | 1 | 0.91mi |
| 5435 Beechwood Ave Maple Heights, OH | 3.0 | 2.0 | 1664 | $2,000 | $1.20 | 4d | 1 | 1.23mi |
| 5508 Grasmere Ave Maple Heights, OH | 3.0 | 2.0 | 1834 | $1,710 | $0.93 | 45d | 1 | 1.35mi |
| 18004 North Blvd Maple Heights, OH | 3.0 | 1.0 | 1396 | $1,700 | $1.22 | 45d | 1 | 1.42mi |
| 5461 Clement Ave Maple Heights, OH | 3.0 | 1.5 | 1260 | $1,350 | $1.07 | 22d | 1 | 1.42mi |
| 5461 Clement Ave Maple Heights, OH | 3.0 | 1.5 | 1260 | $1,350 | $1.07 | 18d | 1 | 1.42mi |
Listing history 22 events
-
2026-06-21days on market $100,000 Active 81 DOM
-
2026-06-18days on market $100,000 Active 78 DOM
-
2026-06-17days on market $100,000 Active 77 DOM
-
2026-06-16days on market $100,000 Active 76 DOM
-
2026-06-15days on market $100,000 Active 75 DOM
-
2026-06-13days on market $100,000 Active 73 DOM
-
2026-06-09days on market $100,000 Active 69 DOM
-
2026-06-08statusdays on market $100,000 Active 68 DOM
-
2026-06-08price $100,000 Contingent 67 DOM
-
2026-06-07days on market $105,000 Contingent 67 DOM
-
2026-06-05days on market $105,000 Contingent 64 DOM
-
2026-06-03days on market $105,000 Contingent 63 DOM
-
2026-06-02days on market $105,000 Contingent 62 DOM
-
2026-06-02status $105,000 Contingent 61 DOM
-
2026-06-01days on market $105,000 Active 61 DOM
-
2026-05-31days on market $105,000 Active 60 DOM
-
2026-05-14price $105,000 1017-char remark
Show marketing remark (1017 chars)
3-bedroom 2 bath home located in historic Bedford, ready for full renovation. Located in a nice suburb with convenient access to major freeways, as well as nearby local shops, restaurants for everyday living. This property offers a solid opportunity for investors or buyers looking to complete a full rehab project. Walk-out basement offers potential for added living space, including additional bedrooms or a finished recreation area. Investor highlights: - Estimated ARV: $220,000+ based on neighborhood comps -Strong rental potential - Suitable for fix & flip or long-term hold - Full rehab required Owner-occupant highlights: - Opportunity to customize finishes and layout to your preferences - Potential to build equity through renovation - Located in a well-established community with access to daily needs No wholesale or assignments. Cash preferred. No blind offers. Buyer to perform their own due diligence. All information deemed accurate but not guaranteed. Property is being sold as-is.
-
2026-04-02price $110,000 1017-char remark
Show marketing remark (1017 chars)
3-bedroom 2 bath home located in historic Bedford, ready for full renovation. Located in a nice suburb with convenient access to major freeways, as well as nearby local shops, restaurants for everyday living. This property offers a solid opportunity for investors or buyers looking to complete a full rehab project. Walk-out basement offers potential for added living space, including additional bedrooms or a finished recreation area. Investor highlights: - Estimated ARV: $220,000+ based on neighborhood comps -Strong rental potential - Suitable for fix & flip or long-term hold - Full rehab required Owner-occupant highlights: - Opportunity to customize finishes and layout to your preferences - Potential to build equity through renovation - Located in a well-established community with access to daily needs No wholesale or assignments. Cash preferred. No blind offers. Buyer to perform their own due diligence. All information deemed accurate but not guaranteed. Property is being sold as-is.
-
2026-04-01$11,000 Active 1017-char remark
Show marketing remark (1017 chars)
3-bedroom 2 bath home located in historic Bedford, ready for full renovation. Located in a nice suburb with convenient access to major freeways, as well as nearby local shops, restaurants for everyday living. This property offers a solid opportunity for investors or buyers looking to complete a full rehab project. Walk-out basement offers potential for added living space, including additional bedrooms or a finished recreation area. Investor highlights: - Estimated ARV: $220,000+ based on neighborhood comps -Strong rental potential - Suitable for fix & flip or long-term hold - Full rehab required Owner-occupant highlights: - Opportunity to customize finishes and layout to your preferences - Potential to build equity through renovation - Located in a well-established community with access to daily needs No wholesale or assignments. Cash preferred. No blind offers. Buyer to perform their own due diligence. All information deemed accurate but not guaranteed. Property is being sold as-is.
-
2004-07-01soldstatus $109,000 244-char remark
Show marketing remark (244 chars)
Two Parcels Being Sold As One. Seller To Do City Point Of Sale Violations. Stove, Refrig, Washer & Dryer Stay. 2nd Floor Consists Of 2 Bdrm In-law Suite. Has Separate Entrance. Home Is Near Public Transportation & I 271 & 480.
-
2004-06-30soldstatus $109,000
-
2003-11-30$109,500 244-char remark
Show marketing remark (244 chars)
Two Parcels Being Sold As One. Seller To Do City Point Of Sale Violations. Stove, Refrig, Washer & Dryer Stay. 2nd Floor Consists Of 2 Bdrm In-law Suite. Has Separate Entrance. Home Is Near Public Transportation & I 271 & 480.
ⓘ Source: listings_history table (triggers on properties + properties_extension) + one-shot
backfill from property_details.listing_events for pre-trigger history.
Climate risk First Street
- Flood 1/10 Low FEMA zone X (unshaded) · 0% chance over 30 yrs
- Wildfire 1/10 Low
- Heat 2/10 Low 7 d/yr ≥94°F today · 17 d/yr by 30 yrs out
- Wind 1/10 Low
- Air quality 3/10 Moderate 2 unhealthy d/yr today · 4 by 30 yrs out
Nearby sold comps map
Loading sold comps map…
Walkable amenities ~0.75 mi
Loading nearby amenities…
Taxation est. · year 1
- Rental income
- $19,209
- − Mortgage interest
- −$5,602
- − Property taxes
- −$1,500
- − Insurance
- −$500
- − Repairs & maintenance
- −$1,537
- − Management
- −$1,537
- − Depreciation
- −$2,909
- Taxable income
- $5,625
- Est. tax owed @ 24.0%
- −$1,350
- After-tax cash flow
- $5,532/yr
For passive investors: Depreciation is non-cash, so a rental often shows a tax loss while cash-flowing — sheltering income. Rental losses are passive: they offset passive income freely, and up to $25,000/yr can offset ordinary (W-2) income if you actively participate and your MAGI is under $100k (phasing out to $0 by $150k); unused losses carry forward. On sale, claimed depreciation is recaptured at up to 25%, and gains may owe capital-gains tax (a 1031 exchange can defer both). Figures are a year-1 estimate at your 24.0% rate — not tax advice; consult a CPA.
Schools (NCES district)
- District
- Bedford City
- NCES district ID
- 3910017
- Math proficiency
- 19% ▼ -23.00%
- Reading proficiency
- 32% ▼ -16.00%
- Median HH income
- $42,353
- Composite
- 21.69/100
- National rank
- #8273
- State rank
- #597 of 656 in OH
Livability — Bedford
- Score
- 73/100
- State rank
- #324
- US rank
- #5334
Category grades
Schools grade is shown separately in the Schools card above.
Census & demographics
- Census place
- Bedford, OH
- County
- Cuyahoga County · 1,090,369 people
- City population
- 29,349
- Metro
- Cleveland-Elyria, OH
- Population (ZIP)
- 29,349
- Household income
- $54,925
- Rent vs Own
- Severe rent burden
- 1314.0
Population outlook (Cuyahoga County) Hauer SSP2
- Today (2025)
- 1,244,621 people
- By 2030
- 1,230,093 · -1.2%
- By 2040
- 1,189,108 · -4.5%
- By 2050
- 1,145,706 · -7.9%
- By 2075
- 1,076,557 · -13.5%
- By 2100
- 978,987 · -21.3%
Race, ethnicity, and origin ACS 2023
- Neighborhood character
- Majority Black (59%)
- Race & ethnicity
- Black 59% White 33% Two or more races 6% Hispanic / Latino 3%
- Common ancestry
- Romanian 5% Serbian 1% Armenian 1%
- Foreign-born
- 2% · Canada
- Languages at home
- 96% English-only · Spanish 2% Arabic 1%
Political lean MEDSL · Cuyahoga
- 2024 margin
- Solid D (+31.5) · D 65.4% · R 33.9%
- 2008→2024 swing
- -7.4pp toward R · 2008: 38.9pp · 2024: 31.5pp
- All cycles
- 2024: D+31.5 2020: D+34.1 2016: D+35.0 2012: D+38.7 2008: D+38.9
Not yet ingested
- Civics
- —
Market trends
- HPI YoY
- ▼ -114.08%
- Current HPI
- 172.9421
- Rent YoY
- ▲ 5.83%
- Metro
- Cleveland-Elyria, OH
- State GDP YoY
- ▲ 1.98%
- F500 in state
- 48
Industry mix (Fortune 500 HQ in OH)
| Industry | F500 HQs | Revenue |
|---|---|---|
| Insurance | 3 | $145B |
|
||
| Industrial Machinery | 3 | $49B |
|
||
| Financial Services | 3 | $24B |
|
||
| Consumer Goods | 2 | $93B |
|
||
| Aerospace / Defense | 2 | $47B |
|
||
| Utilities | 2 | $33B |
|
||
Price history
-4.1% since first listed6 events — show timeline
- 2026-05-14 Price Changed $105,000 MLSNOW
- 2026-04-02 Price Changed $110,000 MLSNOW
- 2026-04-01 Listed $11,000 MLSNOW
- 2004-07-01 Sold (MLS) $109,000 MLSNOW
- 2004-06-30 Sold (Public Records) $109,000 Public Records
- 2003-11-30 Listed $109,500 MLSNOW
Property tax history
+9.7%/yrLatest (2025): $5,440 · +30.5% YoY. Source: county tax records.
Cash-flow waterfall
monthlySold comps — $/sqft
last 12 mo · ≤1 miLoading sold comps…