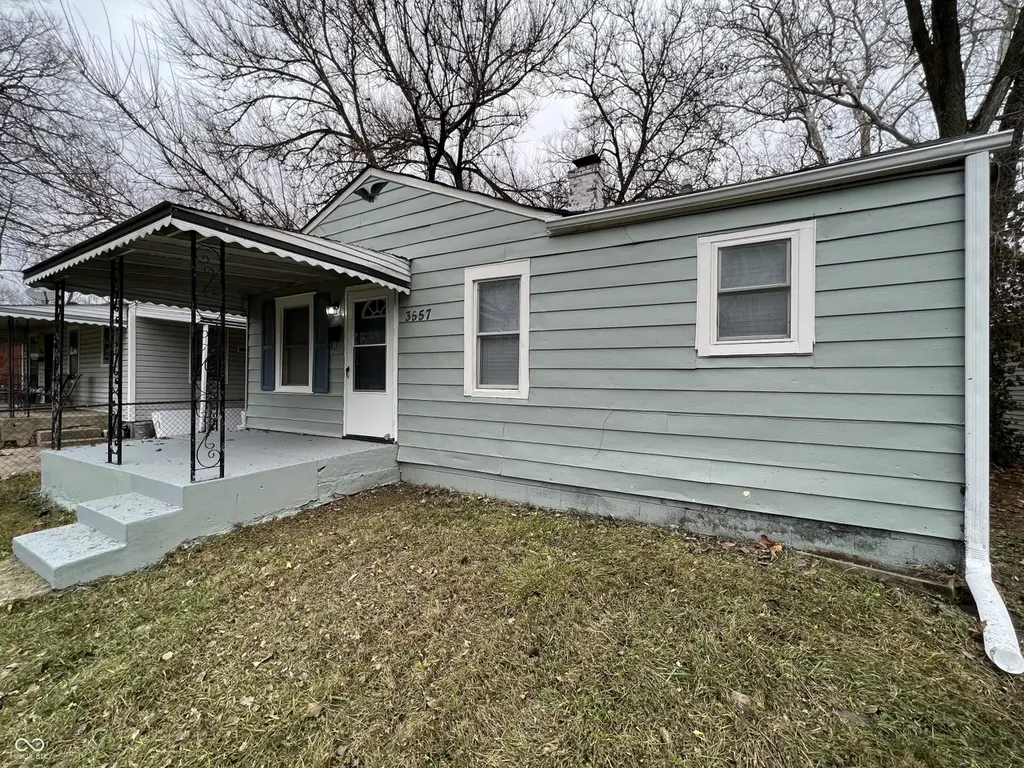
3557 Caroline Ave · Indianapolis city (balance), IN
Flood risk 5/10 · Moderate
- FEMA flood zone
- X (unshaded)
- Chance of flooding over 30 yrs
- 0.32%
- Est. flood insurance / yr
- $507 – $1,088
Fire risk 1/10 · Minimal
- Est. fire insurance / yr
- $717 – $1,331
Heat risk 3/10 · Minor
- Hot days now (above 102°F)
- 7 days/yr
- Hot days in 30 yrs
- 18 days/yr
Wind risk 2/10 · Minimal
- Chance of severe wind over 30 yrs
- 0.0%
Air-quality risk 4/10 · Minor
- Unhealthy air days now
- 5 days/yr
- Unhealthy air days in 30 yrs
- 7 days/yr
Risk factors via First Street. Map © Google.
Why this score? — see what drove the C- grade
The composite is a weighted blend of 9 inputs, each scored 0–100. Each bar is that input's sub-score; the figure is the points it added to the 100-point composite (weight × sub-score).
- Cash flow +24.1/30.0
- DSCR +7.8/10.0
- ARV discount +6.9/15.0
- 1% rule +5.8/10.0
- Rent growth +2.7/5.0
- Livability +2.5/5.0
- Condition / age +2.5/5.0
- Schools +1.4/10.0
- Appreciation +0.0/10.0
$109,000
🖨 Deal sheet 📄 Offer letter ✓ Due diligence
Listing remarks MLS
Quaint updated 2 bed room home features living room dining room combo, eat in kitchen, laundry room, 1 full updated bathroom, freshly painted interior, new flooring. Nice back yard with mature trees. Has been a good rental for several years.
Key facts
- Laundry room
- Eat in kitchen
- Updated home
Tags
Property features AI
Exterior
- Parking: No garage
- Utilities: Public water; Municipal sewer connected; Municipal solid waste service
- Home design: Single-family residence; One level
- Construction: Vinyl siding; Block foundation
- Exterior features: Lot smaller than 1/4 acre (approximately 0.12 acre)
Interior
- Kitchen: Electric oven; Refrigerator
- Bedrooms: Two main-level bedrooms (one 12x9)
- Bathrooms: One full bathroom on main level
- Heating & cooling: Forced-air heating (natural gas); Central air conditioning
- Interior features: Living room (15x12); Dining room (9x8); Additional main-level room (12x10)
- Laundry & utility: Washer; Dryer
Neighborhood map
What this means for you Summary
Snapshot
- This is a 2-bed/1.0-bath single-family listed at $109k.
Deal economics
- At list price, monthly cash flow is $214 ($3k/yr) — positive.
- The deal already cash-flows at list — no discount required.
- Meets the 1% rule at list price ($1k rent vs $109k).
- Recommended offer: $107k (1.5% below list) — sets the bar for market timing.
- Cap rate 8.7% vs local median 4.4% in Indianapolis city (balance) — top-decile yield for the area; either an underpriced asset or a hidden risk that comps aren't pricing in. Stress-test before assuming the spread holds.
Location & tenants
- Location reads: area grade C — affects rentability + tenant quality, not the cash-flow math above.
- Indianapolis Public Schools (urban): math 14% / reading 20% proficiency, ranked #286 of 301 in IN (top 95%) — low school quality limits family demand, transient renter base, plan for 1-2y turnover; 77% free/reduced lunch — lower-income household profile, screen leases tightly.
- Market conditions: Rents flat; 334 active listings in the ZIP; 40 comparable units currently listed for rent nearby; rentals at typical pace (median 24d on market — plan ~3-4 weeks tenant-placement turnaround); lower-income renter base — watch delinquency; 1,906 units permitted in Marion County in 2024 (621 in 5+ unit buildings).
- This rent runs 37% of the median local income ($38k/yr) — at the standard rent-burdened threshold; future hikes will face affordability resistance.
Forward outlook
- Local home prices are declining (-3.0%/yr); year-one equity from $754 of loan paydown is wiped out by about $3k of value loss. Plan a longer hold.
- Marion County population projected at +18% by 2050 — long-run rental-demand tailwind backs the buy-and-hold thesis.
Negotiation context
- It's been on market 30 days — a 2% lower offer ($107k) is reasonable based on typical stale-listing flexibility.
- 10 sale attempts since 23y ago with the ask held roughly flat each time — persistent listings suggest the price (not the market) is what's stuck; bring a comps-based counter.
- Current owner paid $56k; list at $109k implies a 93% gain — meaningful room to come down on a strong offer.
Risks & watch-outs
- Watch-outs: built in 1949 — expect roof / HVAC / electrical / plumbing capex.
- Climate carrying-cost: moderate flood risk — expect insurance premiums to compound above CPI over the hold.
Questions for the listing agent
- Built in 1949 — when were the roof, HVAC, electrical panel, plumbing, and water heater last replaced?
- Is there a deadline driving the sale (1031 exchange, divorce, estate, relocation)? That informs how much negotiation room exists.
- What's the average days-on-market for RENTAL listings here right now (not sales)? A rising rental-DOM trend means longer vacancies and softer asking-rent achievability than the comps imply.
- What's the recent tenant-quality profile in this submarket — average credit score on applications, eviction rate, late-payment / NSF rate, and stable-employment percentage? A property-management company in the area should have these aggregated.
- How much new for-sale + rental construction is in the pipeline within 1–3 miles? Heavy new supply typically softens prices + rents 12–24 months out; constrained supply supports both.
Investment metrics
- 1% rule
- 1.08% ✓
- Cap rate
- 8.65%
- Cash-on-cash
- 8.43%
- DSCR
- 1.38
- GRM
- 7.7
CMA / ARV
- ARV (on-the-fly)
- $107,520
- Comps found
- 12
Show comp detail 12 sales within ~0.75 mi
| Address | Dist | Beds/Ba | Sqft | Sold | Price | $/sf | Match |
|---|---|---|---|---|---|---|---|
| 3714 Hillside Ave | 0.19mi | 2/2.0 | 844 (+0%) | 4mo | $143,900 | $170 | 83 |
| 3511 N Keystone Ave | 0.24mi | 2/1.0 | 837 (-0%) | 10mo | $113,500 | $136 | 80 |
| 3706 Baltimore Ave | 0.13mi | 2/1.0 | 812 (-3%) | 13mo | $40,000 | $49 | 77 |
| 3930 Caroline Ave | 0.42mi | 2/1.0 | 812 (-3%) | 18mo | $102,500 | $126 | 60 |
| 2217 E 34th St | 0.28mi | 3/1.0 (+1) | 912 (+9%) | 15mo | $163,450 | $179 | 55 |
| 2120 E 34th St | 0.23mi | 3/2.0 (+1) | 900 (+7%) | 19mo | $115,000 | $128 | 53 |
| 3612 Schofield Ave | 0.24mi | 3/1.0 (+1) | 950 (+13%) | 11mo | $126,000 | $133 | 52 |
| 3051 N Tacoma Ave | 0.70mi | 2/1.0 | 856 (+2%) | 15mo | $101,000 | $118 | 52 |
| 3932 Millersville Dr | 0.44mi | 3/1.0 (+1) | 925 (+10%) | 10mo | $100,000 | $108 | 50 |
| 3038 Baltimore Ave | 0.67mi | 2/1.0 | 924 (+10%) | 4mo | $98,500 | $107 | 49 |
| 3331 Orchard Ave | 0.34mi | 2/1.0 | 720 (-14%) | 14mo | $115,000 | $160 | 49 |
| 3135 N Temple Ave | 0.64mi | 1/1.0 (-1) | 725 (-14%) | 4mo | $78,000 | $108 | 39 |
Match score weights: distance 35% · size 25% · config 20% · recency 20%. Top-matched comps best support the ARV.
Projected returns pro-forma
-3.0% appreciation · 0.81% rent growth · sell at horizon
- IRR
- -5.9%
- Equity multiple
- 0.79×
- Total profit
- $-6,545
- Equity at exit
- $16,252
- IRR
- 1.0%
- Equity multiple
- 1.06×
- Total profit
- $1,903
- Equity at exit
- $9,424
Cash invested: $30,520 (down + closing). Projections, not guarantees.
Landlord ↔ Tenant lean methodology
- Overall (STATE)
- 90 Strongly Landlord-Friendly
- State Indiana
- 90 Strongly Landlord-Friendly · R+11
- County
- — inherits STATE
- City
- — inherits STATE
ZIP-level market 46218
- Home prices YoY
- -17.1%
- Rents YoY
- 0.8%
- Active inventory
- 334
- Price-to-rent
- 7.7×
Monthly cashflow live
- Estimated rent
- $1,177 high interval (Pro) →
- Mortgage (P&I)
- −$572
- Tax from tax record
- −$98 /mo · $1,176/yr
- Insurance
- −$45
- HOA
- −$0
- Vacancy / Maint / Mgmt
- −$247
- Net cashflow
- $214
Break-even live
UW: 25.0% down · 7.5% · 30yr · 1.5% tax · 5.0% vac · 8.0% maint · 8.0% mgmt
Financing live
Cash to close
- Down payment
- $27,250
- Closing costs
- $3,270
- Reserves months
- —
- Total cash needed
- —
Loan-product check · same deal, 3 products live
Conventional
25% down · 7.5% · 30yr
- Down + closing
- —
- Monthly P&I
- —
- Monthly cashflow
- —
- DSCR
- —
- Eligible?
- —
Personal DTI + credit; lowest rate.
DSCR
20% down · 8.5% · 30yr
- Down + closing
- —
- Monthly P&I
- —
- Monthly cashflow
- —
- DSCR
- —
- Eligible?
- —
No personal income docs; deal must DSCR.
Hard money
10% down · 12.0% · 12mo
- Down + closing
- —
- Monthly P&I
- —
- Monthly cashflow
- —
- DSCR
- —
- Eligible?
- —
Short-term bridge; refi at stabilization.
Rent comps 40 comps
| Address | Beds | Baths | Sqft | Rent | $/sqft | DOM | Units | Dist |
|---|---|---|---|---|---|---|---|---|
| 3709 Kinnear Ave Indianapolis, IN | 2.0 | 1.0 | 650 | $1,000 | $1.54 | 43d | 1 | 0.11mi |
| 3723 Orchard Ave Unit 3723 Indianapolis, IN | 1.0 | 1.5 | 700 | $1,300 | $1.86 | 23d | 1 | 0.17mi |
| 3763 Baltimore Ave Unit 3765 Indianapolis, IN | 1.0 | 1.0 | 750 | $750 | $1.00 | 43d | 1 | 0.20mi |
| 3719 Hillside Ave Indianapolis, IN | 1.0 | 1.0 | 644 | $725 | $1.13 | 23d | 1 | 0.21mi |
| 1902 E 35th St Indianapolis, IN | 3.0 | 1.0 | 1100 | $1,600 | $1.45 | 43d | 1 | 0.23mi |
| 3363 Nicholas Ave Indianapolis, IN | 2.0 | 1.0 | 720 | $1,000 | $1.39 | 3d | 1 | 0.29mi |
| 3741 N Tacoma Ave Indianapolis, IN | 3.0 | 1.0 | 913 | $2,200 | $2.41 | 17d | 1 | 0.37mi |
| 3609 Balsam Ave Indianapolis, IN | 1.0 | 1.0 | 541 | $755 | $1.40 | 14d | 1 | 0.59mi |
| 3609 Balsam Ave Indianapolis, IN | 1.0 | 1.0 | 541 | $775 | $1.43 | 2d | 1 | 0.59mi |
| 3535 N Oxford St Indianapolis, IN | 3.0 | 1.0 | 1015 | $1,500 | $1.48 | 21d | 1 | 0.60mi |
| 3610 Balsam Ave Indianapolis, IN | 1.0 | 1.0 | 464 | $775 | $1.67 | 2d | 9 | 0.62mi |
| 3207 N Arsenal Ave Indianapolis, IN | 3.0 | 1.0 | 994 | $1,195 | $1.20 | 23d | 1 | 0.72mi |
| 3472 N Dearborn St Indianapolis, IN | 2.0 | 1.0 | 890 | $1,099 | $1.23 | 19d | 1 | 0.75mi |
| 3132 Dr Andrew J Brown Ave Indianapolis, IN | 2.0 | 1.0–2.0 | 791 | $2,120 | $2.68 | 1d | 46 | 0.82mi |
| 916 Fairfield Ave Unit 918 Indianapolis, IN | 3.0 | 1.0 | 1000 | $1,300 | $1.30 | 7d | 1 | 0.84mi |
| 3909 Winthrop Ave Unit B Indianapolis, IN | 2.0 | 1.5 | 931 | $1,550 | $1.66 | 11d | 1 | 0.86mi |
| 4303 Norwaldo Ave Indianapolis, IN | 3.0 | 1.0 | 1050 | $1,200 | $1.14 | 43d | 1 | 0.90mi |
| 2931 N Tacoma Ave Unit 31 Indianapolis, IN | 2.0 | 1.0 | 800 | $950 | $1.19 | 7d | 1 | 0.91mi |
| 4326 Crittenden Ave Indianapolis, IN | 2.0 | 1.0 | 812 | $1,045 | $1.29 | 20d | 1 | 0.94mi |
| 3139 Guilford Ave Indianapolis, IN | 3.0 | 1.0 | 1068 | $1,345 | $1.26 | 43d | 1 | 0.95mi |
| 4309 Ralston Ave Indianapolis, IN | 3.0 | 1.0 | 918 | $1,600 | $1.74 | 14d | 1 | 0.95mi |
| 3203 Sutherland Ave Unit 1310761P Indianapolis, IN | 2.0 | 1.0 | 1097 | $3,668 | $3.34 | 1d | 1 | 0.99mi |
| 2820 Caroline Ave Indianapolis, IN | 3.0 | 1.5 | 1112 | $1,250 | $1.12 | 23d | 1 | 0.99mi |
| 3522 N Olney St Indianapolis, IN | 3.0 | 1.0 | 768 | $1,300 | $1.69 | 43d | 1 | 1.00mi |
| 3716 N College Ave Unit 3 Indianapolis, IN | 2.0 | 2.0 | 1100 | $1,450 | $1.32 | 43d | 1 | 1.04mi |
| 3359 N College Ave Unit 3359 Indianapolis, IN | 2.0 | 1.5 | 1082 | $1,895 | $1.75 | 23d | 1 | 1.04mi |
| 3421 N Olney St Indianapolis, IN | 2.0 | 1.0 | 720 | $1,195 | $1.66 | 16d | 1 | 1.05mi |
| 636 E 37th St Unit 5 Indianapolis, IN | 2.0 | 1.0 | 700 | $695 | $0.99 | 23d | 1 | 1.07mi |
| 633 E 38th St #4 Indianapolis, IN | 3.0 | 1.0 | 650 | $1,050 | $1.62 | 43d | 1 | 1.08mi |
| 2930 N Dearborn St Indianapolis, IN | 1.0 | 1.0 | 536 | $599 | $1.12 | 23d | 1 | 1.12mi |
| 4115 Meadows Dr Indianapolis, IN | 1.0–3.0 | 1.0–2.0 | 1013 | $1,374 | $1.36 | 43d | 9 | 1.13mi |
| 3615 Sherman Forest Dr Indianapolis, IN | 4.0 | 1.0–2.5 | 1057 | $1,288 | $1.22 | 4d | 1 | 1.15mi |
| 2920 N Lasalle St Indianapolis, IN | 3.0 | 1.0 | 875 | $1,095 | $1.25 | 17d | 1 | 1.18mi |
| 4521 Norwaldo Ave Unit A Indianapolis, IN | 2.0 | 1.5 | 1024 | $1,525 | $1.49 | 23d | 1 | 1.18mi |
| 4521 Norwaldo Ave Unit B Indianapolis, IN | 2.0 | 1.5 | 1054 | $1,600 | $1.52 | 43d | 1 | 1.18mi |
| 4400 E Fall Creek Parkway North Dr Indianapolis, IN | 1.0–2.0 | 1.0–1.5 | 857 | $1,349 | $1.57 | 1d | 31 | 1.20mi |
| 2949 Adams St Indianapolis, IN | 2.0 | 1.0 | 978 | $1,150 | $1.18 | 43d | 1 | 1.21mi |
| 3383 Station St Indianapolis, IN | 3.0 | 1.0 | 744 | $1,250 | $1.68 | 23d | 1 | 1.21mi |
| 2511 E 46th St Indianapolis, IN | 1.0–2.0 | 1.0–2.0 | 830 | $1,305 | $1.57 | 43d | 2 | 1.23mi |
| 2010 E 25th St Indianapolis, IN | 2.0 | 1.0 | 792 | $775 | $0.98 | 23d | 1 | 1.26mi |
Listing history 35 events
-
2026-06-18days on market $109,000 Active 30 DOM
-
2026-06-17days on market $109,000 Active 29 DOM
-
2026-06-16days on market $109,000 Active 28 DOM
-
2026-06-15days on market $109,000 Active 27 DOM
-
2026-06-13days on market $109,000 Active 25 DOM
-
2026-06-13days on market $109,000 Active 24 DOM
-
2026-06-09days on market $109,000 Active 21 DOM
-
2026-06-08days on market $109,000 Active 20 DOM
-
2026-06-07days on market $109,000 Active 19 DOM
-
2026-06-03days on market $109,000 Active 15 DOM
-
2026-06-02days on market $109,000 Active 14 DOM
-
2026-06-01days on market $109,000 Active 13 DOM
-
2026-05-31days on market $109,000 Active 12 DOM
-
2026-05-19$109,000 Active
-
2024-07-16status Pending
-
2024-07-15historical
-
2024-07-01price $105,000
-
2024-06-13$109,000 Active
-
2021-11-19soldstatus $56,500 Closed 243-char remark
Show marketing remark (243 chars)
Quaint updated 2 bed room home features living room dining room combo, eat in kitchen, laundry room, 1 full updated bathroom, freshly painted interior, new flooring. Nice back yard with mature trees. Has been a good rental for several years.
-
2021-10-19status Pending 243-char remark
Show marketing remark (243 chars)
Quaint updated 2 bed room home features living room dining room combo, eat in kitchen, laundry room, 1 full updated bathroom, freshly painted interior, new flooring. Nice back yard with mature trees. Has been a good rental for several years.
-
2021-10-15$60,000 Active 243-char remark
Show marketing remark (243 chars)
Quaint updated 2 bed room home features living room dining room combo, eat in kitchen, laundry room, 1 full updated bathroom, freshly painted interior, new flooring. Nice back yard with mature trees. Has been a good rental for several years.
-
2008-11-21soldstatus $12,000
-
2008-09-12$12,500
-
2008-08-30historical
-
2008-02-16$32,975
-
2006-09-02historical
-
2006-07-06soldstatus $25,000
-
2006-06-07$29,900
-
2005-10-01$65,000
-
2004-08-25soldstatus $12,000
-
2004-07-04$15,900
-
2004-06-30historical
-
2004-03-15historical
-
2004-02-06$19,900
-
2003-10-13$23,500
ⓘ Source: listings_history table (triggers on properties + properties_extension) + one-shot
backfill from property_details.listing_events for pre-trigger history.
Tax reassessment forecast IN · Partial reset (capped growth)
- Current annual tax
- $1,176 · $98/mo
- Projected year-2 tax
- $1,176 · $98/mo
- Expected delta
- $0/yr ($0/mo · 0.0%)
ⓘ Screening estimate from a state-policy table — verify with the county assessor before closing.
Climate risk First Street
- Flood 5/10 Major FEMA zone X (unshaded) · 32% chance over 30 yrs
- Wildfire 1/10 Low
- Heat 3/10 Moderate 7 d/yr ≥102°F today · 18 d/yr by 30 yrs out
- Wind 2/10 Low 0% chance of damaging wind over 30 yrs
- Air quality 4/10 Moderate 5 unhealthy d/yr today · 7 by 30 yrs out
Nearby sold comps map
Loading sold comps map…
Walkable amenities ~0.75 mi
Loading nearby amenities…
Taxation est. · year 1
- Rental income
- $14,120
- − Mortgage interest
- −$6,106
- − Property taxes
- −$1,176
- − Insurance
- −$545
- − Repairs & maintenance
- −$1,130
- − Management
- −$1,130
- − Depreciation
- −$3,171
- Taxable income
- $862
- Est. tax owed @ 24.0%
- −$207
- After-tax cash flow
- $2,367/yr
For passive investors: Depreciation is non-cash, so a rental often shows a tax loss while cash-flowing — sheltering income. Rental losses are passive: they offset passive income freely, and up to $25,000/yr can offset ordinary (W-2) income if you actively participate and your MAGI is under $100k (phasing out to $0 by $150k); unused losses carry forward. On sale, claimed depreciation is recaptured at up to 25%, and gains may owe capital-gains tax (a 1031 exchange can defer both). Figures are a year-1 estimate at your 24.0% rate — not tax advice; consult a CPA.
Schools (NCES district)
- District
- Indianapolis Public Schools
- NCES district ID
- 1804770
- Math proficiency
- 14% ▼ -7.00%
- Reading proficiency
- 20% ▼ -3.00%
- Median HH income
- $32,034
- Composite
- 13.69/100
- National rank
- #9499
- State rank
- #286 of 301 in IN
Livability — Indianapolis city (balance)
No livability data for this city. (Only ~50 U.S. cities are tracked.)
Census & demographics
- Census place
- Indianapolis city (balance), IN
- County
- Marion County · 998,460 people
- City population
- 881,119
- Metro
- Indianapolis-Carmel-Anderson, IN
- Population (ZIP)
- 29,360
- Household income
- $38,063
- Rent vs Own
- Severe rent burden
- 2340.0
Population outlook (Marion County) Hauer SSP2
- Today (2025)
- 1,025,572 people
- By 2030
- 1,065,727 · +3.9%
- By 2040
- 1,141,577 · +11.3%
- By 2050
- 1,208,920 · +17.9%
- By 2075
- 1,367,288 · +33.3%
- By 2100
- 1,438,201 · +40.2%
Race, ethnicity, and origin ACS 2023
- Neighborhood character
- Predominantly Black (68%)
- Race & ethnicity
- Black 68% White 18% Hispanic / Latino 9% Two or more races 6%
- Hispanic origin (detail)
- Mexican 6%
- Common ancestry
- Romanian 1%
- Foreign-born
- 5% · Canada, Philippines
- Languages at home
- 92% English-only · Spanish 7%
Political lean MEDSL · Marion
- 2024 margin
- Strong D (+27.7) · D 63.0% · R 35.3% · Other 1.7%
- 2008→2024 swing
- -0.7pp no change · 2008: 28.4pp · 2024: 27.7pp
- All cycles
- 2024: D+27.7 2020: D+29.1 2016: D+22.8 2012: D+22.2 2008: D+28.4
Not yet ingested
- Civics
- —
Market trends
- HPI YoY
- ▼ -81.57%
- Current HPI
- 395.7071
- Rent YoY
- ▲ 0.81%
- Metro
- Indianapolis-Carmel-Anderson, IN
- State GDP YoY
- ▲ 2.90%
- F500 in state
- 18
Industry mix (Fortune 500 HQ in IN)
| Industry | F500 HQs | Revenue |
|---|---|---|
| Industrial Machinery | 2 | $37B |
|
||
| Healthcare | 1 | $177B |
|
||
| Pharmaceuticals | 1 | $45B |
|
||
| Metals / Steel | 1 | $18B |
|
||
| Agriculture | 1 | $17B |
|
||
| Packaging | 1 | $12B |
|
||
Price history
+363.8% since first listed22 events — show timeline
- 2026-05-19 Listed $109,000 MIBOR as Distributed by MLS Grid
- 2024-07-16 Pending — MIBOR as Distributed by MLS Grid
- 2024-07-15 Listing Removed — MIBOR as Distributed by MLS Grid
- 2024-07-01 Price Changed $105,000 MIBOR as Distributed by MLS Grid
- 2024-06-13 Listed $109,000 MIBOR as Distributed by MLS Grid
- 2021-11-19 Sold (MLS) $56,500 MIBOR as Distributed by MLS Grid
- 2021-10-19 Pending — MIBOR as Distributed by MLS Grid
- 2021-10-15 Listed $60,000 MIBOR as Distributed by MLS Grid
- 2008-11-21 Sold (MLS) $12,000 MIBOR as Distributed by MLS Grid
- 2008-09-12 Listed $12,500 MIBOR as Distributed by MLS Grid
- 2008-08-30 Listing Removed — MIBOR as Distributed by MLS Grid
- 2008-02-16 Listed $32,975 MIBOR as Distributed by MLS Grid
- 2006-09-02 Listing Removed — MIBOR as Distributed by MLS Grid
- 2006-07-06 Sold (MLS) $25,000 MIBOR as Distributed by MLS Grid
- 2006-06-07 Listed $29,900 MIBOR as Distributed by MLS Grid
- 2005-10-01 Listed $65,000 MIBOR as Distributed by MLS Grid
- 2004-08-25 Sold (MLS) $12,000 MIBOR as Distributed by MLS Grid
- 2004-07-04 Listed $15,900 MIBOR as Distributed by MLS Grid
- 2004-06-30 Listing Removed — MIBOR as Distributed by MLS Grid
- 2004-03-15 Listing Removed — MIBOR as Distributed by MLS Grid
- 2004-02-06 Listed $19,900 MIBOR as Distributed by MLS Grid
- 2003-10-13 Listed $23,500 MIBOR as Distributed by MLS Grid
Property tax history
+7.2%/yrLatest (2025): $1,176 · +5.3% YoY. Source: county tax records.
Cash-flow waterfall
monthlySold comps — $/sqft
last 12 mo · ≤1 miLoading sold comps…