 Multi-family
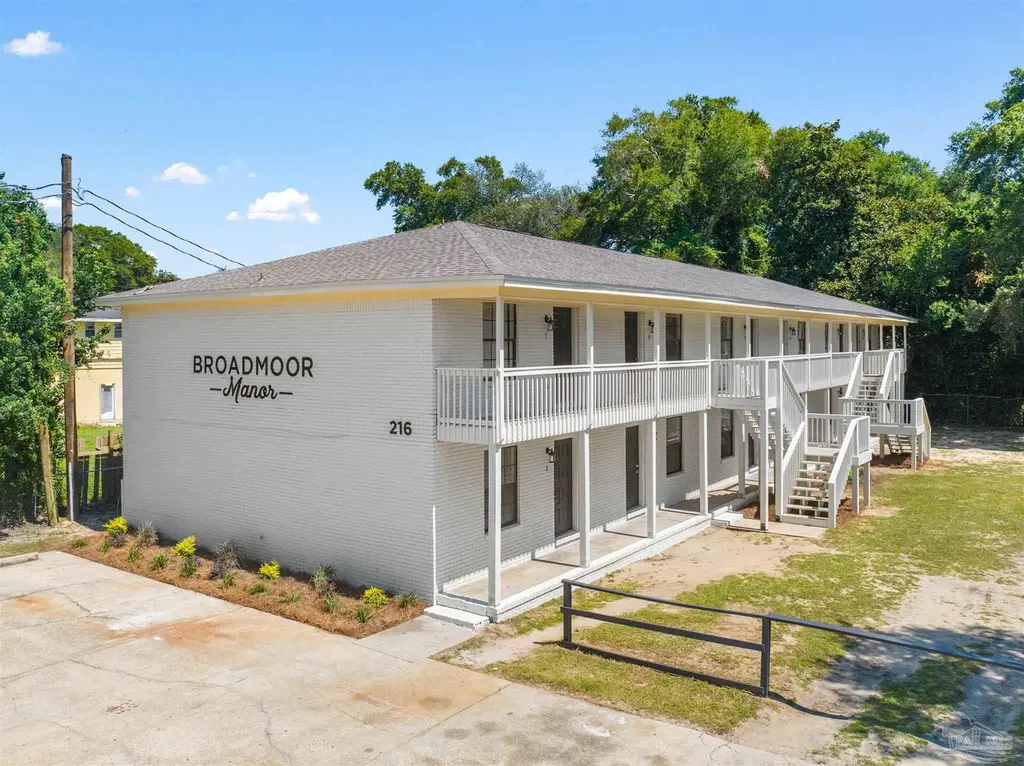
216 Broadmoor Ln · Warrington, FL
Flood risk 1/10 · Minimal
- FEMA flood zone
- X (unshaded)
- Chance of flooding over 30 yrs
- 0.0%
- Est. flood insurance / yr
- $507 – $1,088
Fire risk 1/10 · Minimal
- Est. fire insurance / yr
- $947 – $1,759
Heat risk 10/10 · Severe
- Hot days now (above 105°F)
- 7 days/yr
- Hot days in 30 yrs
- 22 days/yr
Wind risk 9/10 · Severe
- Chance of severe wind over 30 yrs
- 99.0%
Air-quality risk 1/10 · Minimal
- Unhealthy air days now
- 0 days/yr
- Unhealthy air days in 30 yrs
- 0 days/yr
Risk factors via First Street. Map © Google.
Why this score? — see what drove the C+ grade
The composite is a weighted blend of 9 inputs, each scored 0–100. Each bar is that input's sub-score; the figure is the points it added to the 100-point composite (weight × sub-score).
- Cash flow +28.1/30.0
- DSCR +10.0/10.0
- ARV discount +7.5/15.0
- 1% rule +7.0/10.0
- Schools +3.6/10.0
- Livability +3.2/5.0
- Rent growth +2.8/5.0
- Condition / age +2.5/5.0
- Appreciation +0.0/10.0
$1,500,000
🖨 Deal sheet 📄 Offer letter ✓ Due diligence
Multi-family units
County records classify this as Multi-Family (5+ Unit). Listing-text estimate: 1 unit. estimate disagrees with records
5+ unit building — per-unit beds/baths from public records are typically unavailable; the breakdown below (if shown) is an estimate from the listing text.
Listing remarks
This recently renovated 12-unit apartment building is located just west of Downtown Pensacola and offers investors a turnkey asset with strong in-place income and recent capital improvements. Each unit features a spacious 1-bedroom, 1-bathroom layout with approximately 610 sq. ft. of living space. Interior updates include new flooring, refreshed kitchens with updated cabinets and appliances, and renovated bathrooms, offering a clean and modern rental product for residents. Major exterior improvements include a new roof, new porch railings, and updated stairs, enhancing both curb appeal and long-term durability. The property is conveniently located just 4.4 miles from the NAS Pensacola Main
Key facts
- Refreshed kitchens
- Turnkey asset
- Updated cabinets
Tags
Property features AI
Finance
- Other: Public maintained road access
Exterior
- Parking: Parking lot
- Utilities: Public water; Public sewer; Electric with circuit breakers and copper wiring
- Home design: Resale property; Two levels; Building name: Broadmoor
- Construction: Brick and frame construction; Shingle roof; Slab foundation; Built as part of a multi-unit building (building area ~7,326 sq ft)
- Exterior features: Balcony; Interior lot
Interior
- Kitchen: Laminate counters; Microwave
- Bathrooms: 1 full bathroom
- Heating & cooling: Central heating; Central air; Ceiling fan cooling
- Interior features: Ceiling fans; High-speed internet
- Laundry & utility: Indoor laundry; Electric water heater
Neighborhood map
What this means for you Summary
Snapshot
- This is a 1-bed/12.0-bath multifamily listed at $1.50M.
Deal economics
- At list price, monthly cash flow is $5k ($56k/yr) — positive.
- The deal already cash-flows at list — no discount required.
- Meets the 1% rule at list price ($18k rent vs $1.50M).
- Cap rate 10.1% vs local median 4.3% in Warrington — top-decile yield for the area; either an underpriced asset or a hidden risk that comps aren't pricing in. Stress-test before assuming the spread holds.
Location & tenants
- Location reads 65/100 on livability (#631 in FL) — a middle-class / working-renter tenant base. Strengths: cost of living A+, housing A+; Watch: schools D, amenities F, commute F.
- Escambia (suburban): math 40% / reading 45% proficiency, ranked #56 of 73 in FL (top 77%) — families likely to look elsewhere, expect single-tenant / working-renter base with shorter leases.
- Market conditions: Rents rising (+1.2%/yr); 702 active listings in the ZIP; 1,479 units permitted in Escambia County in 2024 (0 in 5+ unit buildings).
- At $17,953/mo this rent would consume 293% of the median local household income ($74k/yr) (locally 1175% of renters already pay >50% of income on rent) — very limited rent-growth headroom before tenants either downsize or default.
Forward outlook
- Local home prices are declining (-3.0%/yr); year-one equity from $10k of loan paydown is wiped out by about $45k of value loss. Plan a longer hold.
- Escambia County population projected at +13% by 2050 — modest demand growth; plan on rents tracking national, not racing it.
Negotiation context
- Only 9 days on market — expect competitive offers; lowballing is unlikely to land.
- 2 sale attempts with the ask held roughly flat each time — persistent listings suggest the price (not the market) is what's stuck; bring a comps-based counter.
- Current owner paid $775k; list at $1.50M implies a 94% gain — meaningful room to come down on a strong offer.
Risks & watch-outs
- Climate carrying-cost: severe wind risk, 99% chance of damaging wind over 30y; extreme-heat days projected 7→22/yr by 2055 (HVAC capex compounding) — expect insurance premiums to compound above CPI over the hold.
Questions for the listing agent
- Is there a deadline driving the sale (1031 exchange, divorce, estate, relocation)? That informs how much negotiation room exists.
- Schools are D-rated, which usually means shorter tenancies and higher turnover. Who's the typical renter profile here, and what's been the actual vacancy rate?
- What's the average days-on-market for RENTAL listings here right now (not sales)? A rising rental-DOM trend means longer vacancies and softer asking-rent achievability than the comps imply.
- What's the recent tenant-quality profile in this submarket — average credit score on applications, eviction rate, late-payment / NSF rate, and stable-employment percentage? A property-management company in the area should have these aggregated.
- How much new apartment / multifamily construction is in the pipeline within 1–3 miles? Heavy new supply (>2% of stock underway) typically softens rents 12–24 months out; light construction supports rent growth.
Investment metrics
- 1% rule
- 1.20% ✓
- Cap rate
- 10.05%
- Cash-on-cash
- 13.44%
- DSCR
- 1.60
- GRM
- 7.0
CMA / ARV
No comps found within radius.
Projected returns pro-forma
-3.0% appreciation · 1.22% rent growth · sell at horizon
- IRR
- 1.6%
- Equity multiple
- 1.06×
- Total profit
- $24,557
- Equity at exit
- $223,655
- IRR
- 9.4%
- Equity multiple
- 1.67×
- Total profit
- $280,825
- Equity at exit
- $129,693
Cash invested: $420,000 (down + closing). Projections, not guarantees.
Landlord ↔ Tenant lean methodology
- Overall (STATE)
- 87 Strongly Landlord-Friendly
- State Florida
- 87 Strongly Landlord-Friendly · R+3
- County
- — inherits STATE
- City
- — inherits STATE
ZIP-level market 32507
- Home prices YoY
- -4.6%
- Rents YoY
- 1.2%
- Active inventory
- 702
- Price-to-rent
- 83.6×
Monthly cashflow live
- Estimated rent
- $17,953 medium interval (Pro) →
- Mortgage (P&I)
- −$7,866
- Tax from tax record
- −$989 /mo · $11,873/yr
- Insurance
- −$625
- HOA
- −$0
- Vacancy / Maint / Mgmt
- −$3,770
- Net cashflow
- $4,702
Break-even live
12-unit breakdown (identical units grouped — click to expand)
| Units | Beds | Baths | Est. rent |
|---|---|---|---|
| 12× units | 1 | 1 | $17,952 |
| #1 | 1 | 1 | $1,496 |
| #2 | 1 | 1 | $1,496 |
| #3 | 1 | 1 | $1,496 |
| #4 | 1 | 1 | $1,496 |
| #5 | 1 | 1 | $1,496 |
| #6 | 1 | 1 | $1,496 |
| #7 | 1 | 1 | $1,496 |
| #8 | 1 | 1 | $1,496 |
| #9 | 1 | 1 | $1,496 |
| #10 | 1 | 1 | $1,496 |
| #11 | 1 | 1 | $1,496 |
| #12 | 1 | 1 | $1,496 |
| Total (12 units) | $17,953 | ||
UW: 25.0% down · 7.5% · 30yr · 1.5% tax · 5.0% vac · 8.0% maint · 8.0% mgmt
Financing live
Cash to close
- Down payment
- $375,000
- Closing costs
- $45,000
- Reserves months
- —
- Total cash needed
- —
Loan-product check · same deal, 3 products live
Conventional
25% down · 7.5% · 30yr
- Down + closing
- —
- Monthly P&I
- —
- Monthly cashflow
- —
- DSCR
- —
- Eligible?
- —
Personal DTI + credit; lowest rate.
DSCR
20% down · 8.5% · 30yr
- Down + closing
- —
- Monthly P&I
- —
- Monthly cashflow
- —
- DSCR
- —
- Eligible?
- —
No personal income docs; deal must DSCR.
Hard money
10% down · 12.0% · 12mo
- Down + closing
- —
- Monthly P&I
- —
- Monthly cashflow
- —
- DSCR
- —
- Eligible?
- —
Short-term bridge; refi at stabilization.
Listing history 7 events
-
2026-06-18days on market $1,500,000 Active 9 DOM
-
2026-06-17days on market $1,500,000 Active 8 DOM
-
2026-06-16days on market $1,500,000 Active 7 DOM
-
2026-06-15days on market $1,500,000 Active 6 DOM
-
2026-06-14days on market $1,500,000 Active 4 DOM
-
2026-06-10remarks 699-char remark
-
2026-06-10$1,500,000 Active 1 DOM
ⓘ Source: listings_history table (triggers on properties + properties_extension) + one-shot
backfill from property_details.listing_events for pre-trigger history.
Tax reassessment forecast FL · Resets to sale price
- Current annual tax
- $11,873 · $989/mo
- Projected year-2 tax
- $12,450 · $1,038/mo
- Expected delta
- +$577/yr (+$48/mo · 4.9%)
ⓘ Screening estimate from a state-policy table — verify with the county assessor before closing.
Climate risk First Street
- Flood 1/10 Low FEMA zone X (unshaded) · 0% chance over 30 yrs
- Wildfire 1/10 Low
- Heat 10/10 Extreme 7 d/yr ≥105°F today · 22 d/yr by 30 yrs out
- Wind 9/10 Extreme 99% chance of damaging wind over 30 yrs
- Air quality 1/10 Low 0 unhealthy d/yr today · 0 by 30 yrs out
Nearby sold comps map
Loading sold comps map…
Walkable amenities ~0.75 mi
Loading nearby amenities…
Taxation est. · year 1
- Rental income
- $215,436
- − Mortgage interest
- −$84,023
- − Property taxes
- −$11,873
- − Insurance
- −$7,500
- − Repairs & maintenance
- −$17,235
- − Management
- −$17,235
- − Depreciation
- −$43,636
- Taxable income
- $33,933
- Est. tax owed @ 24.0%
- −$8,144
- After-tax cash flow
- $48,283/yr
For passive investors: Depreciation is non-cash, so a rental often shows a tax loss while cash-flowing — sheltering income. Rental losses are passive: they offset passive income freely, and up to $25,000/yr can offset ordinary (W-2) income if you actively participate and your MAGI is under $100k (phasing out to $0 by $150k); unused losses carry forward. On sale, claimed depreciation is recaptured at up to 25%, and gains may owe capital-gains tax (a 1031 exchange can defer both). Figures are a year-1 estimate at your 24.0% rate — not tax advice; consult a CPA.
Schools (NCES district)
- District
- Escambia
- NCES district ID
- 1200510
- Math proficiency
- 40% ▼ -9.00%
- Reading proficiency
- 45% ▼ -4.00%
- Median HH income
- $44,649
- Composite
- 36.04/100
- National rank
- #4773
- State rank
- #56 of 73 in FL
Livability — Warrington
- Score
- 65/100
- State rank
- #631
- US rank
- #12396
Category grades
Schools grade is shown separately in the Schools card above.
Census & demographics
- Census place
- Warrington, FL
- County
- Escambia County · 301,722 people
- Metro
- Pensacola-Ferry Pass-Brent, FL
- Population (ZIP)
- 32,226
- Household income
- $73,540
- Rent vs Own
- Severe rent burden
- 1175.0
Population outlook (Escambia County) Hauer SSP2
- Today (2025)
- 334,637 people
- By 2030
- 345,779 · +3.3%
- By 2040
- 364,828 · +9.0%
- By 2050
- 378,514 · +13.1%
- By 2075
- 403,220 · +20.5%
- By 2100
- 386,125 · +15.4%
Race, ethnicity, and origin ACS 2023
- Neighborhood character
- Predominantly White (73%)
- Race & ethnicity
- White 73% Black 10% Two or more races 10% Hispanic / Latino 7% Asian 2%
- Hispanic origin (detail)
- Mexican 3% Puerto Rican 2%
- Common ancestry
- Slovak 3% Lithuanian 2% Romanian 2%
- Foreign-born
- 5% · Canada, Vietnam
- Languages at home
- 92% English-only · Spanish 4% Other Asian/Pacific 1% French/Haitian/Cajun 1%
Political lean MEDSL · Escambia
- 2024 margin
- R (+19.5) · D 39.7% · R 59.2% · Other 1.1%
- 2008→2024 swing
- -0.2pp no change · 2008: -19.3pp · 2024: -19.5pp
- All cycles
- 2024: R+19.5 2020: R+15.1 2016: R+20.6 2012: R+20.6 2008: R+19.3
Not yet ingested
- Civics
- —
Market trends
- HPI YoY
- ▼ -26.23%
- Current HPI
- 548.03
- Rent YoY
- ▲ 1.22%
- Metro
- Pensacola-Ferry Pass-Brent, FL
- State GDP YoY
- ▲ 3.28%
- F500 in state
- 36
Industry mix (Fortune 500 HQ in FL)
| Industry | F500 HQs | Revenue |
|---|---|---|
| Industrial Technology | 2 | $29B |
|
||
| Insurance | 2 | $17B |
|
||
| Retail | 1 | $60B |
|
||
| Technology Distribution | 1 | $58B |
|
||
| Homebuilding | 1 | $35B |
|
||
| Technology Manufacturing | 1 | $35B |
|
||
Price history
+525.0% since first listed6 events — show timeline
- 2026-06-09 Listed $1,500,000 PARMLS
- 2025-03-06 Listing Removed — PARMLS
- 2025-02-11 Listed $1,500,000 PARMLS
- 2024-03-08 Sold (Public Records) $775,000 Public Records
- 1990-02-01 Sold (Public Records) $145,000 Public Records
- 1989-07-01 Sold (Public Records) $240,000 Public Records
Property tax history
+8.9%/yrLatest (2025): $11,873 · +18.3% YoY. Source: county tax records.
Cash-flow waterfall
monthlySold comps — $/sqft
last 12 mo · ≤1 miLoading sold comps…