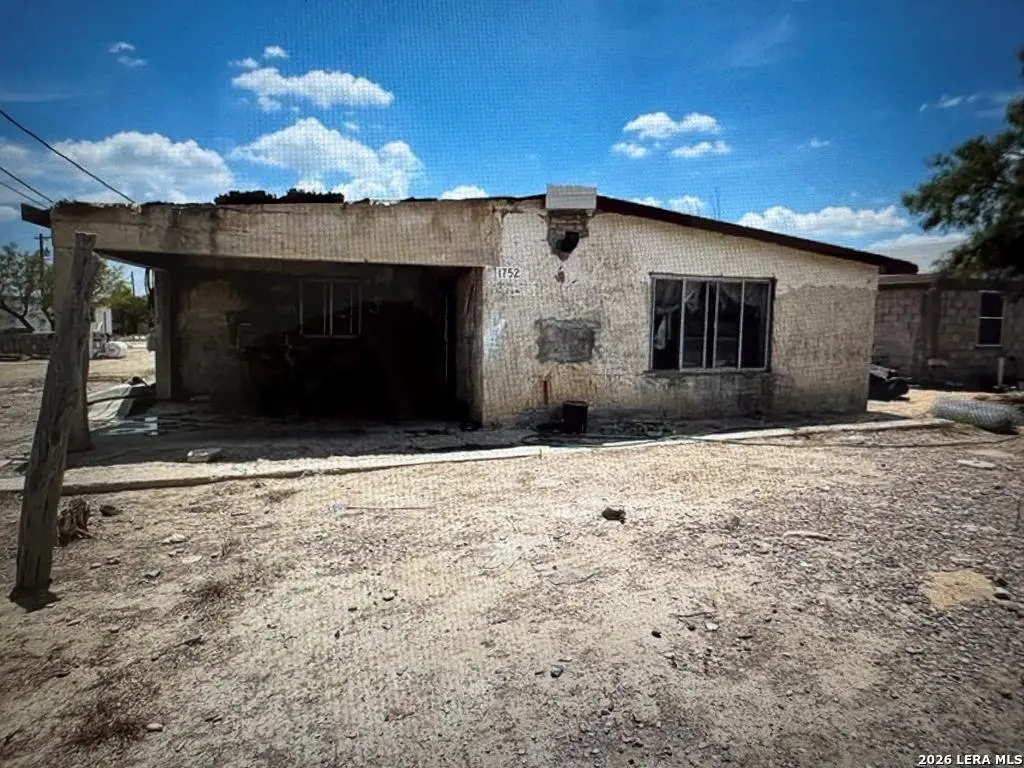
1752 Avenida Encuentro · Eidson Road, TX
Flood risk 1/10 · Minimal
- FEMA flood zone
- X (unshaded)
- Chance of flooding over 30 yrs
- 0.0%
- Est. flood insurance / yr
- $507 – $1,088
Fire risk 5/10 · Moderate
- Est. fire insurance / yr
- $1,222 – $2,270
Heat risk 8/10 · Major
- Hot days now (above 111°F)
- 7 days/yr
- Hot days in 30 yrs
- 23 days/yr
Wind risk 6/10 · Moderate
- Chance of severe wind over 30 yrs
- 27.0%
Air-quality risk 1/10 · Minimal
- Unhealthy air days now
- 0 days/yr
- Unhealthy air days in 30 yrs
- 0 days/yr
Risk factors via First Street. Map © Google.
Why this score? — see what drove the B- grade
The composite is a weighted blend of 9 inputs, each scored 0–100. Each bar is that input's sub-score; the figure is the points it added to the 100-point composite (weight × sub-score).
- Cash flow +30.0/30.0
- 1% rule +10.0/10.0
- DSCR +10.0/10.0
- ARV discount +7.5/15.0
- Livability +2.8/5.0
- Rent growth +2.5/5.0
- Condition / age +2.5/5.0
- Schools +1.7/10.0
- Appreciation +0.0/10.0
$80,000
🖨 Deal sheet 📄 Offer letter ✓ Due diligence
Listing remarks
For Sale !! This property is 50x310 has a home that needs to be demolished basically its the land that has potential survey is required all utilities are available perfect to build your dream home or build an investment located out side city limits. For more information Contact: Listing Agent; Original MLS#: 83397; Age Range: 31-40 Yrs; Appraisal District ID: 11838; Apx Bsmt SqFt: 0; Apx Lot Size SqFt: 17529.00; Qualify: No; Streets: All Weather
Key facts
- 0.4 acre lot
- Built 1980
- Listed 10 days
Tags
Property features AI
Finance
- Financial info: Down payment assistance not indicated
Exterior
- Utilities: City water/sewer
- Construction: Slab foundation; Composition roof
- Exterior features: Paved street
Interior
- Bathrooms: 1 full bathroom
- Interior features: 1 living area
Neighborhood map
What this means for you Summary
Snapshot
- This is a 2-bed/1.0-bath single-family listed at $80k.
Deal economics
- At list price, monthly cash flow is $603 ($7k/yr) — positive.
- The deal already cash-flows at list — no discount required.
- Meets the 1% rule at list price ($1k rent vs $80k).
- Cap rate 15.3% vs local median 4.3% in Eidson Road — top-decile yield for the area; either an underpriced asset or a hidden risk that comps aren't pricing in. Stress-test before assuming the spread holds.
Location & tenants
- Location reads 56/100 on livability (#1,298 in TX) — a working-class tenant base; expect higher turnover. Strengths: cost of living A+, housing A; Watch: health & safety C-, crime F, amenities F.
- Eagle Pass ISD (town): math 15% / reading 28% proficiency, ranked #774 of 826 in TX (top 94%) — low school quality limits family demand, transient renter base, plan for 1-2y turnover.
- Zoned schools: Ray H Darr El (math 8% / reading 8%, grade F, #4,301 of 4,322 statewide, top 100%, 391 students, 97% FRL); C C Winn H S (math 16% / reading 40%, grade F, #1,170 of 1,632 statewide, top 72%, 2,001 students, 86% FRL) — zoned schools average 91% FRL vs 32% district-wide (59 pts higher); higher-poverty schools than district average — tighter screening recommended.
- Market conditions: 461 active listings in the ZIP; 3 comparable units currently listed for rent nearby; rentals lingering (median 44d on market — plan ~5-8 weeks vacancy on turnover, expect pricing pressure); 100% of comp listings sitting > 30 days — soft ceiling on asking rent; 66 units permitted in Maverick County in 2024 (0 in 5+ unit buildings).
- This rent runs 36% of the median local income ($50k/yr) — at the standard rent-burdened threshold; future hikes will face affordability resistance.
Forward outlook
- Local home prices are declining (-3.0%/yr); year-one equity from $553 of loan paydown is wiped out by about $2k of value loss. Plan a longer hold.
- Maverick County population projected at +18% by 2050 — long-run rental-demand tailwind backs the buy-and-hold thesis.
- At projected returns (-3.0% appreciation + 3.0% rent growth), your $22k cash investment doubles in ~4 years — after that, you're playing with house money.
Negotiation context
- Only 11 days on market — expect competitive offers; lowballing is unlikely to land.
- 2 sale attempts since 4y ago with the ask held roughly flat each time — persistent listings suggest the price (not the market) is what's stuck; bring a comps-based counter.
Risks & watch-outs
- Climate carrying-cost: major wind risk, 27% chance of damaging wind over 30y; moderate wildfire risk; extreme-heat days projected 7→23/yr by 2055 (HVAC capex compounding) — expect insurance premiums to compound above CPI over the hold.
Questions for the listing agent
- Is there a deadline driving the sale (1031 exchange, divorce, estate, relocation)? That informs how much negotiation room exists.
- Schools are F-rated, which usually means shorter tenancies and higher turnover. Who's the typical renter profile here, and what's been the actual vacancy rate?
- Crime grade is F in this area — have there been break-ins, vandalism, or insurance claims at this property in the last 3 years? What carrier currently insures it and at what premium?
- What's the average days-on-market for RENTAL listings here right now (not sales)? A rising rental-DOM trend means longer vacancies and softer asking-rent achievability than the comps imply.
- What's the recent tenant-quality profile in this submarket — average credit score on applications, eviction rate, late-payment / NSF rate, and stable-employment percentage? A property-management company in the area should have these aggregated.
- How much new for-sale + rental construction is in the pipeline within 1–3 miles? Heavy new supply typically softens prices + rents 12–24 months out; constrained supply supports both.
Investment metrics
- 1% rule
- 1.85% ✓
- Cap rate
- 15.34%
- Cash-on-cash
- 32.29%
- DSCR
- 2.44
- GRM
- 4.5
CMA / ARV
- ARV (on-the-fly)
- $282,960
- Comps found
- 12
Show comp detail 12 sales within ~0.75 mi
| Address | Dist | Beds/Ba | Sqft | Sold | Price | $/sf | Match |
|---|---|---|---|---|---|---|---|
| 890 Calle Frente | 0.29mi | 3/1.5 (+1) | 1,452 (-8%) | 4mo | $159,000 | $110 | 63 |
| 1766 Ferrer Rd | 0.25mi | 3/2.0 (+1) | 1,440 (-8%) | 10mo | $172,900 | $120 | 57 |
| 1184 Calle Baltica Unit N/A | 0.56mi | 3/2.0 (+1) | 1,506 (-4%) | 5mo | $259,000 | $172 | 54 |
| 1107 Colon Ln | 0.49mi | 3/2.5 (+1) | 1,567 (-0%) | 16mo | $297,730 | $190 | 53 |
| 684 Anacua St | 0.58mi | 3/2.0 (+1) | 1,497 (-5%) | 5mo | $285,000 | $190 | 52 |
| 1105 Colon Ln Unit N/A | 0.41mi | 3/2.0 (+1) | 1,530 (-3%) | 19mo | $275,000 | $180 | 51 |
| 1097 Colon Ln | 0.44mi | 3/2.0 (+1) | 1,510 (-4%) | 18mo | $290,000 | $192 | 49 |
| 2373 Eidson Rd Unit N/A | 0.63mi | 3/2.0 (+1) | 1,506 (-4%) | 7mo | $265,000 | $176 | 49 |
| 325 Zaragoza Dr | 0.45mi | 3/2.0 (+1) | 1,430 (-9%) | 10mo | $265,500 | $186 | 47 |
| 811 Christian Dr | 0.55mi | 3/2.0 (+1) | 1,448 (-8%) | 7mo | $245,000 | $169 | 46 |
| 1042 Colon Ln | 0.34mi | 3/2.0 (+1) | 1,370 (-13%) | 10mo | $275,000 | $201 | 45 |
| 3298 Yucca Loop | 0.73mi | 3/2.0 (+1) | 1,377 (-12%) | 16mo | $223,000 | $162 | 23 |
Match score weights: distance 35% · size 25% · config 20% · recency 20%. Top-matched comps best support the ARV.
Projected returns pro-forma
-3.0% appreciation · 3.0% rent growth · sell at horizon
- IRR
- 27.4%
- Equity multiple
- 2.14×
- Total profit
- $25,460
- Equity at exit
- $11,928
- IRR
- 34.9%
- Equity multiple
- 4.20×
- Total profit
- $71,730
- Equity at exit
- $6,917
Cash invested: $22,400 (down + closing). Projections, not guarantees.
Landlord ↔ Tenant lean methodology
- Overall (STATE)
- 87 Strongly Landlord-Friendly
- State Texas
- 87 Strongly Landlord-Friendly · R+5
- County
- — inherits STATE
- City
- — inherits STATE
ZIP-level market 78852
- Home prices YoY
- -27.5%
- Active inventory
- 461
- Price-to-rent
- 4.5×
Monthly cashflow live
- Estimated rent
- $1,479 medium interval (Pro) →
- Mortgage (P&I)
- −$420
- Tax from tax record
- −$112 /mo · $1,349/yr
- Insurance
- −$33
- HOA
- −$0
- Vacancy / Maint / Mgmt
- −$310
- Net cashflow
- $603
Break-even live
UW: 25.0% down · 7.5% · 30yr · 1.5% tax · 5.0% vac · 8.0% maint · 8.0% mgmt
Financing live
Cash to close
- Down payment
- $20,000
- Closing costs
- $2,400
- Reserves months
- —
- Total cash needed
- —
Loan-product check · same deal, 3 products live
Conventional
25% down · 7.5% · 30yr
- Down + closing
- —
- Monthly P&I
- —
- Monthly cashflow
- —
- DSCR
- —
- Eligible?
- —
Personal DTI + credit; lowest rate.
DSCR
20% down · 8.5% · 30yr
- Down + closing
- —
- Monthly P&I
- —
- Monthly cashflow
- —
- DSCR
- —
- Eligible?
- —
No personal income docs; deal must DSCR.
Hard money
10% down · 12.0% · 12mo
- Down + closing
- —
- Monthly P&I
- —
- Monthly cashflow
- —
- DSCR
- —
- Eligible?
- —
Short-term bridge; refi at stabilization.
Rent comps 3 comps
| Address | Beds | Baths | Sqft | Rent | $/sqft | DOM | Units | Dist |
|---|---|---|---|---|---|---|---|---|
| 1001 Colon Ln Eagle Pass, TX | 3.0 | 2.0 | 1376 | $1,800 | $1.31 | 44d | 1 | 0.32mi |
| 3222 Yucca Loop Eagle Pass, TX | 3.0 | 1.0 | 1723 | $1,100 | $0.64 | 43d | 1 | 0.94mi |
| 1009 Kiriaka Dr Eagle Pass, TX | 3.0 | 2.0 | 1327 | $1,600 | $1.21 | 43d | 1 | 1.05mi |
Listing history 10 events
-
2026-06-19days on market $80,000 Active 11 DOM
-
2026-06-18days on market $80,000 Active 10 DOM
-
2026-06-17days on market $80,000 Active 9 DOM
-
2026-06-16days on market $80,000 Active 8 DOM
-
2026-06-15days on market $80,000 Active 7 DOM
-
2026-06-14days on market $80,000 Active 5 DOM
-
2026-06-13days on market $80,000 Active 4 DOM
-
2026-06-10days on market $80,000 Active 2 DOM
-
2026-06-09remarks 449-char remark
-
2026-06-09$80,000 Active 1 DOM
ⓘ Source: listings_history table (triggers on properties + properties_extension) + one-shot
backfill from property_details.listing_events for pre-trigger history.
Tax reassessment forecast TX · Resets to sale price
- Current annual tax
- $1,349 · $112/mo
- Projected year-2 tax
- $1,464 · $122/mo
- Expected delta
- +$115/yr (+$10/mo · 8.6%)
ⓘ Screening estimate from a state-policy table — verify with the county assessor before closing.
Climate risk First Street
- Flood 1/10 Low FEMA zone X (unshaded) · 0% chance over 30 yrs
- Wildfire 5/10 Major
- Heat 8/10 Severe 7 d/yr ≥111°F today · 23 d/yr by 30 yrs out
- Wind 6/10 Major 27% chance of damaging wind over 30 yrs
- Air quality 1/10 Low 0 unhealthy d/yr today · 0 by 30 yrs out
Nearby sold comps map
Loading sold comps map…
Walkable amenities ~0.75 mi
Loading nearby amenities…
Taxation est. · year 1
- Rental income
- $17,743
- − Mortgage interest
- −$4,481
- − Property taxes
- −$1,349
- − Insurance
- −$400
- − Repairs & maintenance
- −$1,419
- − Management
- −$1,419
- − Depreciation
- −$2,327
- Taxable income
- $6,347
- Est. tax owed @ 24.0%
- −$1,523
- After-tax cash flow
- $5,711/yr
For passive investors: Depreciation is non-cash, so a rental often shows a tax loss while cash-flowing — sheltering income. Rental losses are passive: they offset passive income freely, and up to $25,000/yr can offset ordinary (W-2) income if you actively participate and your MAGI is under $100k (phasing out to $0 by $150k); unused losses carry forward. On sale, claimed depreciation is recaptured at up to 25%, and gains may owe capital-gains tax (a 1031 exchange can defer both). Figures are a year-1 estimate at your 24.0% rate — not tax advice; consult a CPA.
Schools (NCES district)
- District
- Eagle Pass ISD
- NCES district ID
- 4817730
- Math proficiency
- 15% ▼ -41.00%
- Reading proficiency
- 28% ▼ -18.00%
- Median HH income
- $32,967
- Composite
- 17.48/100
- National rank
- #9057
- State rank
- #774 of 826 in TX
Livability — Eidson Road
- Score
- 56/100
- State rank
- #1298
- US rank
- #22544
Category grades
Schools grade is shown separately in the Schools card above.
Census & demographics
- Census place
- Eidson Road, TX
- County
- Maverick County · 57,434 people
- Metro
- Eagle Pass, TX
- Population (ZIP)
- 57,434
- Household income
- $49,954
- Rent vs Own
- Severe rent burden
- 822.0
Population outlook (Maverick County) Hauer SSP2
- Today (2025)
- 62,919 people
- By 2030
- 65,440 · +4.0%
- By 2040
- 70,229 · +11.6%
- By 2050
- 74,218 · +18.0%
- By 2075
- 80,765 · +28.4%
- By 2100
- 76,268 · +21.2%
Race, ethnicity, and origin ACS 2023
- Neighborhood character
- Predominantly Hispanic (95%)
- Race & ethnicity
- Hispanic / Latino 95% Two or more races 53% White 3% Native American 2%
- Hispanic origin (detail)
- Mexican 91% Puerto Rican 1%
- Foreign-born
- 30% · Canada
- Languages at home
- 11% English-only · Spanish 88%
Political lean MEDSL · Maverick
- 2024 margin
- R (+18.5) · D 40.5% · R 59.0%
- 2008→2024 swing
- -75.5pp toward R · 2008: 57.0pp · 2024: -18.5pp
- All cycles
- 2024: R+18.5 2020: D+9.4 2016: D+55.8 2012: D+58.0 2008: D+57.0
Not yet ingested
- Civics
- —
Market trends
- HPI YoY
- ▼ -65.62%
- Current HPI
- 172.9298
- Rent YoY
- —
- Metro
- Eagle Pass, TX
- State GDP YoY
- ▲ 3.95%
- F500 in state
- 110
Industry mix (Fortune 500 HQ in TX)
| Industry | F500 HQs | Revenue |
|---|---|---|
| Energy | 16 | $1,198B |
|
||
| Technology | 5 | $198B |
|
||
| Engineering / Construction | 4 | $72B |
|
||
| Energy Services | 3 | $60B |
|
||
| Utilities | 3 | $41B |
|
||
| Healthcare | 2 | $330B |
|
||
Price history
-11.1% since first listed5 events — show timeline
- 2026-05-13 Listed $80,000 LERA
- 2024-07-31 Listing Removed — LERA
- 2024-06-20 Sold (Public Records) — Public Records
- 2022-07-04 Listed $90,000 LERA
- 2010-01-04 Sold (Public Records) — Public Records
Property tax history
+5.4%/yrLatest (2025): $1,349 · -1.3% YoY. Source: county tax records.
Cash-flow waterfall
monthlySold comps — $/sqft
last 12 mo · ≤1 miLoading sold comps…