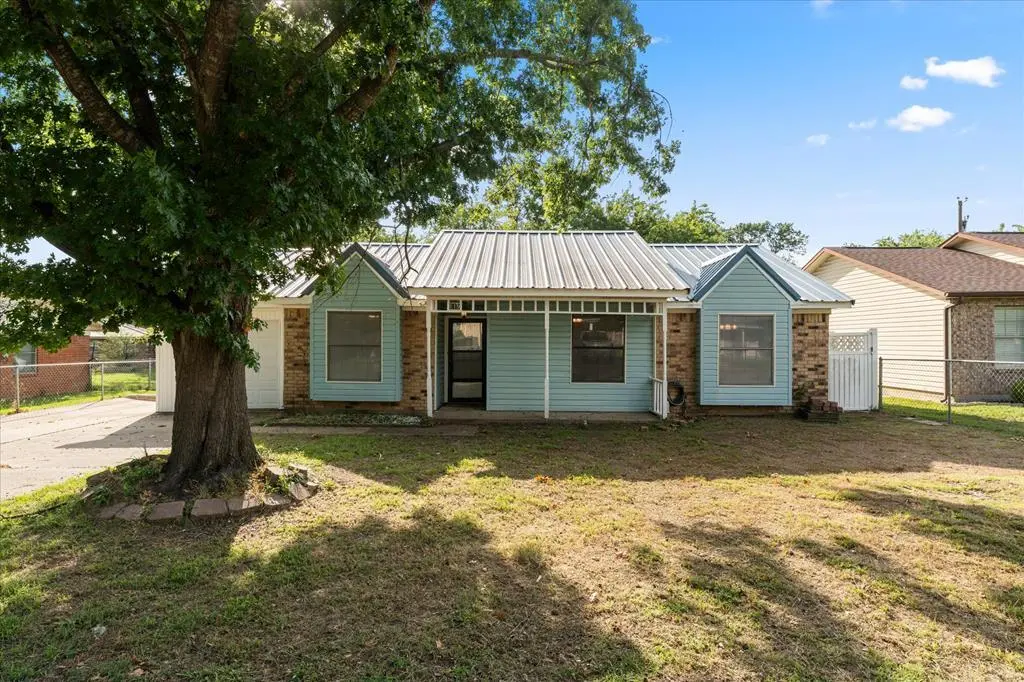
119 Mcanally Dr · Mabank, TX
Flood risk 1/10 · Minimal
- FEMA flood zone
- X (unshaded)
- Chance of flooding over 30 yrs
- 0.0%
- Est. flood insurance / yr
- $507 – $1,088
Fire risk 3/10 · Minor
- Est. fire insurance / yr
- $1,222 – $2,270
Heat risk 7/10 · Major
- Hot days now (above 110°F)
- 7 days/yr
- Hot days in 30 yrs
- 26 days/yr
Wind risk 6/10 · Moderate
- Chance of severe wind over 30 yrs
- 56.0%
Air-quality risk 2/10 · Minimal
- Unhealthy air days now
- 0 days/yr
- Unhealthy air days in 30 yrs
- 1 days/yr
Risk factors via First Street. Map © Google.
Why this score? — see what drove the B grade
The composite is a weighted blend of 9 inputs, each scored 0–100. Each bar is that input's sub-score; the figure is the points it added to the 100-point composite (weight × sub-score).
- Cash flow +23.9/30.0
- ARV discount +10.7/15.0
- Appreciation +10.0/10.0
- DSCR +7.7/10.0
- 1% rule +6.1/10.0
- Rent growth +4.5/5.0
- Schools +3.8/10.0
- Livability +3.5/5.0
- Condition / age +2.5/5.0
$159,000
🖨 Deal sheet 📄 Offer letter ✓ Due diligence
Listing remarks MLS
ABSOLUTELY WONDERFUL BRICK HOME IN MABANK. HAS 3 BEDROOMS WITH JACK AND JILL BATH LEADING TO 2 BEDROOMS AND HALL. HOME IS WELL LAID OUT WITH NICE DESIGN. HIGH CEILING IN LIVING WITH FIREPLACE. PRETTY KITCHEN WITH GRANITE COUNTERTOPS, SEPARATE UTILITY ROOM, GREAT COVERED PATIO OVERLOOKING PRIVACY FENCED BACKYARD. 1 CAR GARAGE, STEEL ROOF, LARGE TREE IN FRONT. WOULD MAKE A GREAT PRIMARY HOME OR RENTAL.
Key facts
- High ceiling
- Jack and jill bath
- Brick home
Tags
Property features AI
Finance
- Other: Listing accepts Cash, Conventional, FHA, and VA financing; Possession negotiable
- HOA & community: No association
Exterior
- Parking: Attached garage (1 car); 1 covered parking space
- Security: Smoke detector(s)
- Utilities: City water; City sewer; Electric service
- Home design: Single-family residence; Residential property; Built in 1986; One story; Not attached to other units; Subdivision: Third Add
- Construction: Metal roof; Other construction materials; Slab foundation; Year built 1986
- Exterior features: Few trees on the lot; Other exterior features; Other fencing
Interior
- Kitchen: Dishwasher; Disposal; Electric oven; Electric range; Microwave
- Bedrooms: 3 bedrooms (primary bedroom on main level)
- Bathrooms: 2 bathrooms (1 full, 1 half)
- Interior features: One-level layout; Living area approximately 1188; Ceiling fans; Other interior features; Smoke detector(s)
- Laundry & utility: Washer hookup; Electric dryer hookup
Neighborhood map
What this means for you Summary
Snapshot
- This is a 3-bed/2.0-bath single-family listed at $159k.
Deal economics
- At list price, monthly cash flow is $309 ($4k/yr) — positive.
- The deal already cash-flows at list — no discount required.
- Meets the 1% rule at list price ($2k rent vs $159k).
- Cap rate 8.6% vs local median 3.1% in Mabank — top-decile yield for the area; either an underpriced asset or a hidden risk that comps aren't pricing in. Stress-test before assuming the spread holds.
Location & tenants
- Location reads 69/100 on livability (#446 in TX) — a middle-class / working-renter tenant base. Strengths: cost of living A+, housing A+, crime B+; Watch: amenities F, commute F, employment D-.
- Mabank ISD (town): math 47% / reading 44% proficiency, ranked #273 of 826 in TX (top 33%) — families likely to look elsewhere, expect single-tenant / working-renter base with shorter leases.
- Market conditions: Rents rising fast (+8.1%/yr); 214 active listings in the ZIP; 5 comparable units currently listed for rent nearby; rentals lingering (median 44d on market — plan ~5-8 weeks vacancy on turnover, expect pricing pressure); 60% of comp listings sitting > 30 days — soft ceiling on asking rent; 1,747 units permitted in Kaufman County in 2024 (180 in 5+ unit buildings).
- This rent runs 37% of the median local income ($57k/yr) — at the standard rent-burdened threshold; future hikes will face affordability resistance.
Forward outlook
- In year one you build about $17k of equity ($1k loan paydown + $16k appreciation (10.0% local appreciation)).
- Kaufman County population projected at +43% by 2050 — long-run rental-demand tailwind backs the buy-and-hold thesis.
- At projected returns (10.0% appreciation + 8.0% rent growth), your $45k cash investment doubles in ~3 years — after that, you're playing with house money.
- By year 3, paydown + projected appreciation supports a ~$43k cash-out refi (75% LTV) — recoverable capital for the next deal without selling this one.
Negotiation context
- Only 8 days on market — expect competitive offers; lowballing is unlikely to land.
- 2 sale attempts with the ask held roughly flat each time — persistent listings suggest the price (not the market) is what's stuck; bring a comps-based counter.
Risks & watch-outs
- Climate carrying-cost: major wind risk, 56% chance of damaging wind over 30y; extreme-heat days projected 7→26/yr by 2055 (HVAC capex compounding) — expect insurance premiums to compound above CPI over the hold.
Questions for the listing agent
- Is there a deadline driving the sale (1031 exchange, divorce, estate, relocation)? That informs how much negotiation room exists.
- What's the average days-on-market for RENTAL listings here right now (not sales)? A rising rental-DOM trend means longer vacancies and softer asking-rent achievability than the comps imply.
- What's the recent tenant-quality profile in this submarket — average credit score on applications, eviction rate, late-payment / NSF rate, and stable-employment percentage? A property-management company in the area should have these aggregated.
- How much new for-sale + rental construction is in the pipeline within 1–3 miles? Heavy new supply typically softens prices + rents 12–24 months out; constrained supply supports both.
Investment metrics
- 1% rule
- 1.11% ✓
- Cap rate
- 8.62%
- Cash-on-cash
- 8.32%
- DSCR
- 1.37
- GRM
- 7.5
CMA / ARV
- ARV (on-the-fly)
- $171,072
- Comps found
- 12
Show comp detail 12 sales within ~0.75 mi
| Address | Dist | Beds/Ba | Sqft | Sold | Price | $/sf | Match |
|---|---|---|---|---|---|---|---|
| 115 Mcanally Dr | 0.03mi | 3/1.5 | 1,288 (+8%) | 2mo | $160,000 | $124 | 81 |
| 116 Mcanally Dr | 0.07mi | 3/1.5 | 1,316 (+11%) | 6mo | $189,000 | $144 | 72 |
| 19491 E Market | 0.41mi | 3/2.0 | 1,077 (-9%) | 2mo | $199,900 | $186 | 64 |
| 19515 E Market | 0.38mi | 3/2.0 | 1,316 (+11%) | 1mo | $208,000 | $158 | 64 |
| 106 Mcanally Dr | 0.06mi | 4/1.5 (+1) | 1,316 (+11%) | 11mo | $194,500 | $148 | 64 |
| 408 E Kaufman St | 0.43mi | 3/1.5 | 1,200 (+1%) | 18mo | $120,000 | $100 | 61 |
| 618 E Kempner St | 0.16mi | 3/2.0 | 1,328 (+12%) | 20mo | $249,000 | $188 | 57 |
| 205 N Canton St | 0.24mi | 4/3.0 (+1) | 1,321 (+11%) | 11mo | $265,000 | $201 | 52 |
| 119 S Kemp St | 0.23mi | 2/1.0 (-1) | 1,016 (-14%) | 5mo | $140,000 | $138 | 52 |
| 220 E Glenwood St | 0.59mi | 3/2.0 | 1,345 (+13%) | 6mo | $190,000 | $141 | 46 |
| 108 E Eubank St | 0.59mi | 2/1.0 (-1) | 1,295 (+9%) | 8mo | $100,000 | $77 | 42 |
| 106 E Jeter St | 0.62mi | 2/1.0 (-1) | 1,026 (-14%) | 17mo | $79,900 | $78 | 25 |
Match score weights: distance 35% · size 25% · config 20% · recency 20%. Top-matched comps best support the ARV.
Projected returns pro-forma
10.0% appreciation · 8.0% rent growth · sell at horizon
- IRR
- 32.5%
- Equity multiple
- 3.60×
- Total profit
- $115,591
- Equity at exit
- $143,240
- IRR
- 29.7%
- Equity multiple
- 8.82×
- Total profit
- $348,050
- Equity at exit
- $308,902
Cash invested: $44,520 (down + closing). Projections, not guarantees.
Landlord ↔ Tenant lean methodology
- Overall (STATE)
- 87 Strongly Landlord-Friendly
- State Texas
- 87 Strongly Landlord-Friendly · R+5
- County
- — inherits STATE
- City
- — inherits STATE
ZIP-level market 75147
- Home prices YoY
- 4.6%
- Rents YoY
- 8.1%
- Active inventory
- 214
- Price-to-rent
- 7.5×
Monthly cashflow live
- Estimated rent
- $1,763 high interval (Pro) →
- Mortgage (P&I)
- −$834
- Tax from tax record
- −$184 /mo · $2,207/yr
- Insurance
- −$66
- HOA
- −$0
- Vacancy / Maint / Mgmt
- −$370
- Net cashflow
- $309
Break-even live
UW: 25.0% down · 7.5% · 30yr · 1.5% tax · 5.0% vac · 8.0% maint · 8.0% mgmt
Financing live
Cash to close
- Down payment
- $39,750
- Closing costs
- $4,770
- Reserves months
- —
- Total cash needed
- —
Loan-product check · same deal, 3 products live
Conventional
25% down · 7.5% · 30yr
- Down + closing
- —
- Monthly P&I
- —
- Monthly cashflow
- —
- DSCR
- —
- Eligible?
- —
Personal DTI + credit; lowest rate.
DSCR
20% down · 8.5% · 30yr
- Down + closing
- —
- Monthly P&I
- —
- Monthly cashflow
- —
- DSCR
- —
- Eligible?
- —
No personal income docs; deal must DSCR.
Hard money
10% down · 12.0% · 12mo
- Down + closing
- —
- Monthly P&I
- —
- Monthly cashflow
- —
- DSCR
- —
- Eligible?
- —
Short-term bridge; refi at stabilization.
Rent comps 5 comps
| Address | Beds | Baths | Sqft | Rent | $/sqft | DOM | Units | Dist |
|---|---|---|---|---|---|---|---|---|
| 429 Shorty St Mabank, TX | 3.0 | 2.0 | 1405 | $1,499 | $1.07 | 44d | 1 | 0.57mi |
| 414 Shorty St Mabank, TX | 3.0 | 2.0 | 1405 | $1,564 | $1.11 | 44d | 1 | 0.63mi |
| 813 S Sutton St Mabank, TX | 3.0 | 2.0 | 1197 | $1,399 | $1.17 | 44d | 1 | 0.64mi |
| 18409 County Road 4001 Mabank, TX | 3.0–4.0 | 2.0 | 1750 | $1,725 | $0.99 | 1d | 16 | 1.21mi |
| 2503 Jax St Mabank, TX | 3.0 | 2.0 | 1079 | $1,695 | $1.57 | 22d | 1 | 1.48mi |
Listing history 8 events
-
2026-06-19days on market $159,000 Active 8 DOM
-
2026-06-18days on market $159,000 Active 7 DOM
-
2026-06-17days on market $159,000 Active 6 DOM
-
2026-06-16days on market $159,000 Active 5 DOM
-
2026-06-15days on market $159,000 Active 4 DOM
-
2026-06-14days on market $159,000 Active 2 DOM
-
2026-06-12remarks 403-char remark
-
2026-06-12$159,000 Active 1 DOM
ⓘ Source: listings_history table (triggers on properties + properties_extension) + one-shot
backfill from property_details.listing_events for pre-trigger history.
Tax reassessment forecast TX · Resets to sale price
- Current annual tax
- $2,207 · $184/mo
- Projected year-2 tax
- $2,910 · $242/mo
- Expected delta
- +$703/yr (+$59/mo · 31.8%)
ⓘ Screening estimate from a state-policy table — verify with the county assessor before closing.
Climate risk First Street
- Flood 1/10 Low FEMA zone X (unshaded) · 0% chance over 30 yrs
- Wildfire 3/10 Moderate
- Heat 7/10 Severe 7 d/yr ≥110°F today · 26 d/yr by 30 yrs out
- Wind 6/10 Major 56% chance of damaging wind over 30 yrs
- Air quality 2/10 Low 0 unhealthy d/yr today · 1 by 30 yrs out
Nearby sold comps map
Loading sold comps map…
Walkable amenities ~0.75 mi
Loading nearby amenities…
Taxation est. · year 1
- Rental income
- $21,155
- − Mortgage interest
- −$8,906
- − Property taxes
- −$2,207
- − Insurance
- −$795
- − Repairs & maintenance
- −$1,692
- − Management
- −$1,692
- − Depreciation
- −$4,625
- Taxable income
- $1,236
- Est. tax owed @ 24.0%
- −$297
- After-tax cash flow
- $3,408/yr
For passive investors: Depreciation is non-cash, so a rental often shows a tax loss while cash-flowing — sheltering income. Rental losses are passive: they offset passive income freely, and up to $25,000/yr can offset ordinary (W-2) income if you actively participate and your MAGI is under $100k (phasing out to $0 by $150k); unused losses carry forward. On sale, claimed depreciation is recaptured at up to 25%, and gains may owe capital-gains tax (a 1031 exchange can defer both). Figures are a year-1 estimate at your 24.0% rate — not tax advice; consult a CPA.
Schools (NCES district)
- District
- Mabank ISD
- NCES district ID
- 4828680
- Math proficiency
- 47% ▼ -19.00%
- Reading proficiency
- 44% ▼ -11.00%
- Median HH income
- $40,321
- Composite
- 38.15/100
- National rank
- #4267
- State rank
- #273 of 826 in TX
Livability — Mabank
- Score
- 69/100
- State rank
- #446
- US rank
- #9068
Category grades
Schools grade is shown separately in the Schools card above.
Census & demographics
- Census place
- Mabank, TX
- County
- Van Zandt County · 9,177 people
- Metro
- Dallas-Fort Worth-Arlington, TX
- Population (ZIP)
- 9,177
- Household income
- $56,940
- Rent vs Own
- Severe rent burden
- 279.0
Population outlook (Kaufman County) Hauer SSP2
- Today (2025)
- 138,716 people
- By 2030
- 150,815 · +8.7%
- By 2040
- 174,877 · +26.1%
- By 2050
- 198,020 · +42.8%
- By 2075
- 251,908 · +81.6%
- By 2100
- 285,325 · +105.7%
Race, ethnicity, and origin ACS 2023
- Neighborhood character
- Predominantly White (86%)
- Race & ethnicity
- White 86% Hispanic / Latino 10% Two or more races 8% Black 2%
- Hispanic origin (detail)
- Mexican 10%
- Common ancestry
- Lithuanian 2% Serbian 2% Romanian 1%
- Foreign-born
- 2% · Canada
- Languages at home
- 95% English-only · Spanish 4%
Political lean MEDSL · Kaufman
- 2024 margin
- Strong R (+27.9) · D 35.6% · R 63.5%
- 2008→2024 swing
- +7.9pp toward D · 2008: -35.8pp · 2024: -27.9pp
- All cycles
- 2024: R+27.9 2020: R+33.9 2016: R+47.0 2012: R+44.4 2008: R+35.8
Not yet ingested
- Civics
- —
Market trends
- HPI YoY
- ▲ 11.14%
- Current HPI
- 254.32
- Rent YoY
- ▲ 8.13%
- Metro
- Dallas-Fort Worth-Arlington, TX
- State GDP YoY
- ▲ 3.95%
- F500 in state
- 110
Industry mix (Fortune 500 HQ in TX)
| Industry | F500 HQs | Revenue |
|---|---|---|
| Energy | 16 | $1,198B |
|
||
| Technology | 5 | $198B |
|
||
| Engineering / Construction | 4 | $72B |
|
||
| Energy Services | 3 | $60B |
|
||
| Utilities | 3 | $41B |
|
||
| Healthcare | 2 | $330B |
|
||
Price history
+0.0% since first listed2 events — show timeline
- 2026-06-11 Listed $159,000 HCBOR
- 2026-06-11 Listed $159,000 NTREIS
Property tax history
+1.8%/yrLatest (2025): $2,207 · -9.9% YoY. Source: county tax records.
Cash-flow waterfall
monthlySold comps — $/sqft
last 12 mo · ≤1 miLoading sold comps…