234 Rosie Ave · Pataskala, OH
Flood risk 1/10 · Minimal
- FEMA flood zone
- X (unshaded)
- Chance of flooding over 30 yrs
- 0.0%
- Est. flood insurance / yr
- $507 – $1,088
Fire risk 1/10 · Minimal
- Est. fire insurance / yr
- $713 – $1,323
Heat risk 3/10 · Minor
- Hot days now (above 98°F)
- 7 days/yr
- Hot days in 30 yrs
- 19 days/yr
Wind risk 2/10 · Minimal
- Chance of severe wind over 30 yrs
- 1.0%
Air-quality risk 2/10 · Minimal
- Unhealthy air days now
- 1 days/yr
- Unhealthy air days in 30 yrs
- 2 days/yr
Risk factors via First Street. Map © Google.
Why this score? — see what drove the C+ grade
The composite is a weighted blend of 9 inputs, each scored 0–100. Each bar is that input's sub-score; the figure is the points it added to the 100-point composite (weight × sub-score).
- Cash flow +30.0/30.0
- 1% rule +10.0/10.0
- DSCR +10.0/10.0
- Schools +3.9/10.0
- Livability +3.8/5.0
- Rent growth +2.5/5.0
- Condition / age +2.2/5.0
- ARV discount +0.0/15.0
- Appreciation +0.0/10.0
$99,900
🖨 Deal sheet 📄 Offer letter ✓ Due diligence
Listing remarks MLS
Welcome home to this beautifully maintained 3-bedroom, 2 full bath, large corner lot located in the desirable Summit Estates community. Offering comfort, convenience, and affordability, this home is perfect for anyone looking for easy living in a welcoming neighborhood.
Key facts
- Built 2006
- Listed 104 days
Neighborhood map
What this means for you Summary
Snapshot
- This is a 3-bed/2.0-bath single-family listed at $100k. Condition is rated fair.
Deal economics
- At list price, monthly cash flow is $1k ($14k/yr) — positive.
- The deal already cash-flows at list — no discount required.
- Meets the 1% rule at list price ($2k rent vs $100k).
- Recommended offer: $91k (9.0% below list) — sets the bar for market timing.
- Cap rate 20.0% vs local median 3.3% in Pataskala — top-decile yield for the area; either an underpriced asset or a hidden risk that comps aren't pricing in. Stress-test before assuming the spread holds.
Location & tenants
- Location reads 76/100 on livability (#226 in OH, #3,534 nationally) — a middle-class / working-renter tenant base. Strengths: cost of living A+, housing A+, employment A; Watch: amenities F, commute F.
- Licking Heights Local (rural): math 37% / reading 50% proficiency, ranked #493 of 656 in OH (top 75%) — families likely to look elsewhere, expect single-tenant / working-renter base with shorter leases.
- Market conditions: 160 active listings in the ZIP; 1 comparable units currently listed for rent nearby; solid renter incomes; 159 units permitted in Licking County in 2024 (0 in 5+ unit buildings).
Forward outlook
- Local home prices are declining (-3.0%/yr); year-one equity from $691 of loan paydown is wiped out by about $3k of value loss. Plan a longer hold.
- At projected returns (-3.0% appreciation + 3.0% rent growth), your $28k cash investment doubles in ~3 years — after that, you're playing with house money.
Negotiation context
- It's been on market 104 days — a 9% lower offer ($91k) is reasonable based on typical stale-listing flexibility.
Questions for the listing agent
- It's been on market 104 days. Have you received any prior offers? Is the seller open to a 9% concession, seller financing, or rate buy-down credit?
- Have any recent inspections been done? Can we get a copy of the seller's disclosures and any deferred-maintenance estimates?
- Why hasn't it sold? Are there any deal-killer items the seller is aware of (foundation, flood, title, zoning, code violations)?
- Is there a deadline driving the sale (1031 exchange, divorce, estate, relocation)? That informs how much negotiation room exists.
- Schools are B-rated — typically a magnet for longer-tenancy family renters. What's the average tenant stay here, and is there a school-zone premium baked into asking?
- What's the average days-on-market for RENTAL listings here right now (not sales)? A rising rental-DOM trend means longer vacancies and softer asking-rent achievability than the comps imply.
- What's the recent tenant-quality profile in this submarket — average credit score on applications, eviction rate, late-payment / NSF rate, and stable-employment percentage? A property-management company in the area should have these aggregated.
- How much new for-sale + rental construction is in the pipeline within 1–3 miles? Heavy new supply typically softens prices + rents 12–24 months out; constrained supply supports both.
Investment metrics
- 1% rule
- 2.32% ✓
- Cap rate
- 19.98%
- Cash-on-cash
- 48.90%
- DSCR
- 3.18
- GRM
- 3.6
CMA / ARV
- ARV (median comp)
- $85,135
- List price
- $99,900
- Delta
- 17.34%
- Verdict
- OVERPRICED
- Comps
- 20 within 1.0 mi
Show comp detail 12 sales within ~0.75 mi
| Address | Dist | Beds/Ba | Sqft | Sold | Price | $/sf | Match |
|---|---|---|---|---|---|---|---|
| 508 Michael Rd | 0.09mi | 3/2.0 | 1,216 (0%) | 9mo | $53,900 | $44 | 88 |
| 211 Rona Blvd | 0.16mi | 3/2.0 | 1,216 (0%) | 6mo | $55,000 | $45 | 87 |
| 226 Rosie Ave | 0.05mi | 3/2.0 | 1,188 (-2%) | 9mo | $40,000 | $34 | 86 |
| 209 Rona Blvd | 0.17mi | 3/2.0 | 1,188 (-2%) | 5mo | $105,000 | $88 | 84 |
| 239 Rosie Ave SW | 0.03mi | 2/2.0 (-1) | 1,134 (-7%) | 1mo | $95,000 | $84 | 82 |
| 608 Randall Rd | 0.13mi | 3/2.0 | 1,216 (0%) | 18mo | $50,000 | $41 | 79 |
| 112 Richard Dr | 0.11mi | 3/2.0 | 1,248 (+3%) | 19mo | $125,000 | $100 | 74 |
| 201 Rona Blvd | 0.20mi | 3/2.0 | 1,295 (+6%) | 8mo | $98,500 | $76 | 73 |
| 215 Rona Blvd | 0.14mi | 3/2.0 | 1,296 (+7%) | 13mo | $45,500 | $35 | 72 |
| 242 Rosie Ave | 0.04mi | 2/2.0 (-1) | 1,350 (+11%) | 14mo | $132,400 | $98 | 64 |
| 111 Richard Dr | 0.09mi | 3/2.0 | 1,039 (-15%) | 21mo | $90,000 | $87 | 54 |
| 13545 Cleveland Rd SW | 0.34mi | 4/2.0 (+1) | 1,368 (+12%) | 16mo | $255,000 | $186 | 45 |
Match score weights: distance 35% · size 25% · config 20% · recency 20%. Top-matched comps best support the ARV.
Projected returns pro-forma
-3.0% appreciation · 3.0% rent growth · sell at horizon
- IRR
- 46.5%
- Equity multiple
- 3.02×
- Total profit
- $56,445
- Equity at exit
- $14,895
- IRR
- 52.2%
- Equity multiple
- 6.10×
- Total profit
- $142,776
- Equity at exit
- $8,638
Cash invested: $27,972 (down + closing). Projections, not guarantees.
Landlord ↔ Tenant lean methodology
- Overall (STATE)
- 73 Landlord-Friendly
- State Ohio
- 73 Landlord-Friendly · R+6
- County
- — inherits STATE
- City
- — inherits STATE
ZIP-level market 43062
- Active inventory
- 160
- Price-to-rent
- 3.6×
Monthly cashflow live
- Estimated rent
- $2,317 medium interval (Pro) →
- Mortgage (P&I)
- −$524
- Tax est. 1.5%
- −$125 /mo · $1,498/yr
- Insurance
- −$42
- HOA
- −$0
- Vacancy / Maint / Mgmt
- −$487
- Net cashflow
- $1,140
Break-even live
UW: 25.0% down · 7.5% · 30yr · 1.5% tax · 5.0% vac · 8.0% maint · 8.0% mgmt
Financing live
Cash to close
- Down payment
- $24,975
- Closing costs
- $2,997
- Reserves months
- —
- Total cash needed
- —
Loan-product check · same deal, 3 products live
Conventional
25% down · 7.5% · 30yr
- Down + closing
- —
- Monthly P&I
- —
- Monthly cashflow
- —
- DSCR
- —
- Eligible?
- —
Personal DTI + credit; lowest rate.
DSCR
20% down · 8.5% · 30yr
- Down + closing
- —
- Monthly P&I
- —
- Monthly cashflow
- —
- DSCR
- —
- Eligible?
- —
No personal income docs; deal must DSCR.
Hard money
10% down · 12.0% · 12mo
- Down + closing
- —
- Monthly P&I
- —
- Monthly cashflow
- —
- DSCR
- —
- Eligible?
- —
Short-term bridge; refi at stabilization.
Rent comps 1 comps
| Address | Beds | Baths | Sqft | Rent | $/sqft | DOM | Units | Dist |
|---|---|---|---|---|---|---|---|---|
| 230 Monarch Dr Pataskala, OH | 3.0 | 2.0 | 1328 | $2,186 | $1.65 | 23d | 1 | 0.85mi |
Listing history 14 events
-
2026-06-18days on market $99,900 Active 104 DOM
-
2026-06-17days on market $99,900 Active 103 DOM
-
2026-06-16days on market $99,900 Active 102 DOM
-
2026-06-15days on market $99,900 Active 101 DOM
-
2026-06-13days on market $99,900 Active 99 DOM
-
2026-06-13days on market $99,900 Active 98 DOM
-
2026-06-09days on market $99,900 Active 95 DOM
-
2026-06-08days on market $99,900 Active 94 DOM
-
2026-06-07days on market $99,900 Active 93 DOM
-
2026-06-03days on market $99,900 Active 89 DOM
-
2026-06-02days on market $99,900 Active 88 DOM
-
2026-06-01days on market $99,900 Active 87 DOM
-
2026-05-31days on market $99,900 Active 86 DOM
-
2026-03-06$99,900 Active 270-char remark
Show marketing remark (270 chars)
Welcome home to this beautifully maintained 3-bedroom, 2 full bath, large corner lot located in the desirable Summit Estates community. Offering comfort, convenience, and affordability, this home is perfect for anyone looking for easy living in a welcoming neighborhood.
ⓘ Source: listings_history table (triggers on properties + properties_extension) + one-shot
backfill from property_details.listing_events for pre-trigger history.
Climate risk First Street
- Flood 1/10 Low FEMA zone X (unshaded) · 0% chance over 30 yrs
- Wildfire 1/10 Low
- Heat 3/10 Moderate 7 d/yr ≥98°F today · 19 d/yr by 30 yrs out
- Wind 2/10 Low 100% chance of damaging wind over 30 yrs
- Air quality 2/10 Low 1 unhealthy d/yr today · 2 by 30 yrs out
Nearby sold comps map
Loading sold comps map…
Walkable amenities ~0.75 mi
Loading nearby amenities…
Taxation est. · year 1
- Rental income
- $27,801
- − Mortgage interest
- −$5,596
- − Property taxes
- −$1,498
- − Insurance
- −$500
- − Repairs & maintenance
- −$2,224
- − Management
- −$2,224
- − Depreciation
- −$2,906
- Taxable income
- $12,853
- Est. tax owed @ 24.0%
- −$3,085
- After-tax cash flow
- $10,594/yr
For passive investors: Depreciation is non-cash, so a rental often shows a tax loss while cash-flowing — sheltering income. Rental losses are passive: they offset passive income freely, and up to $25,000/yr can offset ordinary (W-2) income if you actively participate and your MAGI is under $100k (phasing out to $0 by $150k); unused losses carry forward. On sale, claimed depreciation is recaptured at up to 25%, and gains may owe capital-gains tax (a 1031 exchange can defer both). Figures are a year-1 estimate at your 24.0% rate — not tax advice; consult a CPA.
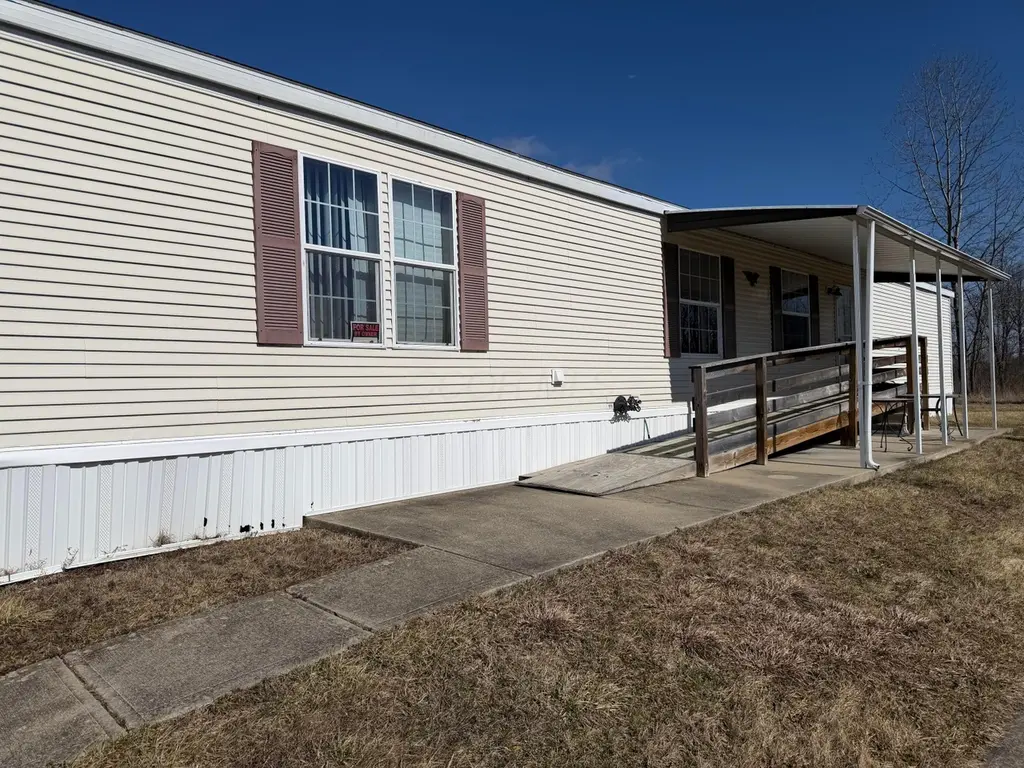
Condition & rehab AI · 1 photo
This home requires moderate renovations to improve its exterior, interior, and landscaping, significantly enhancing its resale and rental value.
Repairs flagged
- Major exterior siding — Significant wear and tear
- Major concrete slab — Worn and uneven
- Major interior walls — Painted walls show significant wear
Value-add opportunities
- Both repair exterior siding — Enhances curb appeal and property value
- Both repair concrete slab — Stabilizes the foundation and improves usability
- Both paint interior walls — Fresh paint improves aesthetics and value
Renovation cost estimate screening
| Repair item | Severity | Est. cost |
|---|---|---|
| exterior siding · Significant wear and tear | Major | $15,000–50,000 |
| concrete slab · Worn and uneven | Major | $15,000–50,000 |
| interior walls · Painted walls show significant wear | Major | $15,000–50,000 |
| Total estimated repair cost · 3 items | $45,000–150,000 |
Value-add ROI direction
- Both repair exterior siding — Enhances curb appeal and property value ↑
- Both repair concrete slab — Stabilizes the foundation and improves usability ↑
- Both paint interior walls — Fresh paint improves aesthetics and value ↑
ⓘ Cost ranges are severity-bucket heuristics (US national rule-of-thumb). Get contractor quotes + a written scope before underwriting a rehab budget.
Schools (NCES district)
- District
- Licking Heights Local
- NCES district ID
- 3904800
- Math proficiency
- 37% ▼ -27.00%
- Reading proficiency
- 50% ▼ -14.00%
- Median HH income
- $68,105
- Composite
- 39.08/100
- National rank
- #4050
- State rank
- #493 of 656 in OH
Livability — Pataskala
- Score
- 76/100
- State rank
- #226
- US rank
- #3534
Category grades
Schools grade is shown separately in the Schools card above.
Census & demographics
- Census place
- Pataskala, OH
- County
- Licking County · 109,194 people
- City population
- 32,037
- Metro
- Columbus, OH
- Population (ZIP)
- 32,037
- Household income
- $105,968
- Rent vs Own
- Severe rent burden
- 316.0
Population outlook (Licking County) Hauer SSP2
- Today (2025)
- 178,210 people
- By 2030
- 180,917 · +1.5%
- By 2040
- 183,885 · +3.2%
- By 2050
- 182,985 · +2.7%
- By 2075
- 178,377 · +0.1%
- By 2100
- 161,075 · -9.6%
Race, ethnicity, and origin ACS 2023
- Neighborhood character
- Predominantly White (79%)
- Race & ethnicity
- White 79% Asian 8% Two or more races 6% Black 5% Hispanic / Latino 4%
- Common ancestry
- Slovak 3% Romanian 2% Scotch-Irish 2%
- Foreign-born
- 9% · India, Canada
- Languages at home
- 88% English-only · Other Indo-European 7% Spanish 2% Arabic 1%
Political lean MEDSL · Licking
- 2024 margin
- Solid R (+30.0) · D 34.5% · R 64.6%
- 2008→2024 swing
- -14.2pp toward R · 2008: -15.8pp · 2024: -30.0pp
- All cycles
- 2024: R+30.0 2020: R+28.1 2016: R+28.9 2012: R+14.7 2008: R+15.8
Not yet ingested
- Civics
- —
Market trends
- HPI YoY
- ▼ -255.15%
- Current HPI
- 236.5135
- Rent YoY
- —
- Metro
- Columbus, OH
- State GDP YoY
- ▲ 1.98%
- F500 in state
- 48
Industry mix (Fortune 500 HQ in OH)
| Industry | F500 HQs | Revenue |
|---|---|---|
| Insurance | 3 | $145B |
|
||
| Industrial Machinery | 3 | $49B |
|
||
| Financial Services | 3 | $24B |
|
||
| Consumer Goods | 2 | $93B |
|
||
| Aerospace / Defense | 2 | $47B |
|
||
| Utilities | 2 | $33B |
|
||
Price history
1 event — show timeline
- 2026-03-06 Listed $99,900 CBRMLS
Cash-flow waterfall
monthlySold comps — $/sqft
last 12 mo · ≤1 miLoading sold comps…