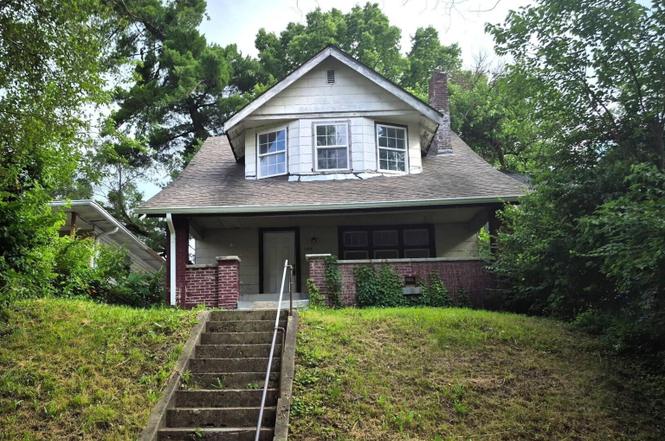
1315 W 34th St · Indianapolis city (balance), IN
Flood risk 1/10 · Minimal
- FEMA flood zone
- X (unshaded)
- Chance of flooding over 30 yrs
- 0.0%
- Est. flood insurance / yr
- $473 – $860
Fire risk 1/10 · Minimal
- Est. fire insurance / yr
- $717 – $1,331
Heat risk 3/10 · Minor
- Hot days now (above 102°F)
- 7 days/yr
- Hot days in 30 yrs
- 19 days/yr
Wind risk 2/10 · Minimal
- Chance of severe wind over 30 yrs
- 0.0%
Air-quality risk 4/10 · Minor
- Unhealthy air days now
- 5 days/yr
- Unhealthy air days in 30 yrs
- 7 days/yr
Risk factors via First Street. Map © Google.
Why this score? — see what drove the D+ grade
The composite is a weighted blend of 9 inputs, each scored 0–100. Each bar is that input's sub-score; the figure is the points it added to the 100-point composite (weight × sub-score).
- Cash flow +19.1/30.0
- ARV discount +6.2/15.0
- DSCR +6.0/10.0
- 1% rule +5.8/10.0
- Rent growth +4.1/5.0
- Livability +2.5/5.0
- Condition / age +2.5/5.0
- Schools +1.4/10.0
- Appreciation +0.0/10.0
$147,000
🖨 Deal sheet 📄 Offer letter ✓ Due diligence
Listing remarks
Calling all investors and renovators! This 3 bedroom, 1 bath home is full of potential and ready for your personal touch. The main level features both a living room and a separate den, providing flexible living and entertaining spaces. Outside, enjoy a generously sized backyard with endless possibilities for outdoor living or future improvements. Conveniently located just minutes from downtown, this property offers easy access to shopping, dining, entertainment, and major roadways. Don't miss this opportunity to add value and make this property your next investment project!
Key facts
- Separate den
- 5,793 sq ft lot
- Built 1932
Tags
Property features AI
Exterior
- Utilities: Public water; Municipal sewer connected; Solid waste service available
- Home design: Single-family residence; One and one half stories
- Construction: Brick and wood siding exterior; Block foundation
- Exterior features: Lot under 1/4 acre (approx. 0.13 acre)
Interior
- Kitchen: Kitchen (16x15)
- Bedrooms: Three bedrooms on upper level
- Bathrooms: One full bathroom (upper level)
- Heating & cooling: No heating specified; No cooling specified
- Interior features: Eat-in kitchen; Basement
- Laundry & utility: Main level laundry (10x7)
Neighborhood map
What this means for you Summary
Snapshot
- This is a 3-bed/1.0-bath single-family listed at $147k.
Deal economics
- At list price, monthly cash flow is $156 ($2k/yr) — positive.
- The deal already cash-flows at list — no discount required.
- Meets the 1% rule at list price ($2k rent vs $147k).
- Cap rate 7.6% vs local median 4.4% in Indianapolis city (balance) — top-decile yield for the area; either an underpriced asset or a hidden risk that comps aren't pricing in. Stress-test before assuming the spread holds.
Location & tenants
- Location reads: area grade D — affects rentability + tenant quality, not the cash-flow math above.
- Indianapolis Public Schools (urban): math 14% / reading 20% proficiency, ranked #286 of 301 in IN (top 95%) — low school quality limits family demand, transient renter base, plan for 1-2y turnover; 77% free/reduced lunch — lower-income household profile, screen leases tightly.
- Market conditions: Rents rising fast (+6.4%/yr); 279 active listings in the ZIP; 40 comparable units currently listed for rent nearby; rentals at typical pace (median 24d on market — plan ~3-4 weeks tenant-placement turnaround); 1,906 units permitted in Marion County in 2024 (621 in 5+ unit buildings).
- This rent runs 32% of the median local income ($60k/yr) — at the standard rent-burdened threshold; future hikes will face affordability resistance.
Forward outlook
- Local home prices are declining (-3.0%/yr); year-one equity from $1k of loan paydown is wiped out by about $4k of value loss. Plan a longer hold.
- Marion County population projected at +18% by 2050 — long-run rental-demand tailwind backs the buy-and-hold thesis.
- At projected returns (-3.0% appreciation + 6.4% rent growth), your $41k cash investment doubles in ~10 years — after that, you're playing with house money.
Negotiation context
- Only 1 days on market — expect competitive offers; lowballing is unlikely to land.
- 10 sale attempts since 12y ago with the ask held roughly flat each time — persistent listings suggest the price (not the market) is what's stuck; bring a comps-based counter.
- Current owner paid $42k; list at $147k implies a 246% gain — meaningful room to come down on a strong offer.
Risks & watch-outs
- Watch-outs: built in 1932 — expect roof / HVAC / electrical / plumbing capex.
Questions for the listing agent
- Built in 1932 — when were the roof, HVAC, electrical panel, plumbing, and water heater last replaced?
- Is there a deadline driving the sale (1031 exchange, divorce, estate, relocation)? That informs how much negotiation room exists.
- The area grade is low — what's the realistic commute time and amenity access for the typical tenant pool here? Any planned neighborhood developments (good or bad) we should know about?
- What's the average days-on-market for RENTAL listings here right now (not sales)? A rising rental-DOM trend means longer vacancies and softer asking-rent achievability than the comps imply.
- What's the recent tenant-quality profile in this submarket — average credit score on applications, eviction rate, late-payment / NSF rate, and stable-employment percentage? A property-management company in the area should have these aggregated.
- How much new for-sale + rental construction is in the pipeline within 1–3 miles? Heavy new supply typically softens prices + rents 12–24 months out; constrained supply supports both.
Investment metrics
- 1% rule
- 1.08% ✓
- Cap rate
- 7.57%
- Cash-on-cash
- 4.56%
- DSCR
- 1.20
- GRM
- 7.7
CMA / ARV
- ARV (on-the-fly)
- $142,760
- Comps found
- 12
Show comp detail 12 sales within ~0.75 mi
| Address | Dist | Beds/Ba | Sqft | Sold | Price | $/sf | Match |
|---|---|---|---|---|---|---|---|
| 1205 W 32nd St | 0.20mi | 3/1.0 | 1,686 (-2%) | 0mo | $122,500 | $73 | 87 |
| 1307 Congress Ave | 0.22mi | 3/2.0 | 1,655 (-4%) | 2mo | $200,000 | $121 | 78 |
| 1453 W 34th St | 0.16mi | 3/1.0 | 1,528 (-11%) | 1mo | $150,000 | $98 | 73 |
| 3105 N White River Parkway East Dr | 0.36mi | 3/3.0 | 1,715 (-0%) | 3mo | $230,000 | $134 | 72 |
| 1340 W 32nd St | 0.13mi | 2/1.0 (-1) | 1,878 (+9%) | 5mo | $79,900 | $43 | 70 |
| 962 W 35th St | 0.43mi | 2/1.0 (-1) | 1,768 (+3%) | 1mo | $97,900 | $55 | 69 |
| 1149 W 36th St | 0.25mi | 2/1.0 (-1) | 1,605 (-7%) | 4mo | $134,000 | $83 | 69 |
| 3052 Skylar Ln | 0.41mi | 2/1.5 (-1) | 1,674 (-3%) | 2mo | $145,729 | $87 | 68 |
| 1226 W 29th St | 0.47mi | 2/1.0 (-1) | 1,616 (-6%) | 1mo | $127,900 | $79 | 62 |
| 950 W 28th St | 0.73mi | 3/2.5 | 1,713 (-0%) | 1mo | $320,000 | $187 | 58 |
| 1030 W 37th St | 0.42mi | 2/1.0 (-1) | 1,888 (+10%) | 3mo | $145,000 | $77 | 56 |
| 1346 W 27th St | 0.65mi | 3/2.0 | 1,932 (+12%) | 4mo | $150,000 | $78 | 41 |
Match score weights: distance 35% · size 25% · config 20% · recency 20%. Top-matched comps best support the ARV.
Projected returns pro-forma
-3.0% appreciation · 6.43% rent growth · sell at horizon
- IRR
- -5.1%
- Equity multiple
- 0.80×
- Total profit
- $-8,146
- Equity at exit
- $21,918
- IRR
- 8.4%
- Equity multiple
- 1.75×
- Total profit
- $30,881
- Equity at exit
- $12,710
Cash invested: $41,160 (down + closing). Projections, not guarantees.
Landlord ↔ Tenant lean methodology
- Overall (STATE)
- 90 Strongly Landlord-Friendly
- State Indiana
- 90 Strongly Landlord-Friendly · R+11
- County
- — inherits STATE
- City
- — inherits STATE
ZIP-level market 46208
- Rents YoY
- 6.4%
- Active inventory
- 279
- Price-to-rent
- 7.7×
Monthly cashflow live
- Estimated rent
- $1,582 high interval (Pro) →
- Mortgage (P&I)
- −$771
- Tax from tax record
- −$261 /mo · $3,131/yr
- Insurance
- −$61
- HOA
- −$0
- Vacancy / Maint / Mgmt
- −$332
- Net cashflow
- $156
Break-even live
UW: 25.0% down · 7.5% · 30yr · 1.5% tax · 5.0% vac · 8.0% maint · 8.0% mgmt
Financing live
Cash to close
- Down payment
- $36,750
- Closing costs
- $4,410
- Reserves months
- —
- Total cash needed
- —
Loan-product check · same deal, 3 products live
Conventional
25% down · 7.5% · 30yr
- Down + closing
- —
- Monthly P&I
- —
- Monthly cashflow
- —
- DSCR
- —
- Eligible?
- —
Personal DTI + credit; lowest rate.
DSCR
20% down · 8.5% · 30yr
- Down + closing
- —
- Monthly P&I
- —
- Monthly cashflow
- —
- DSCR
- —
- Eligible?
- —
No personal income docs; deal must DSCR.
Hard money
10% down · 12.0% · 12mo
- Down + closing
- —
- Monthly P&I
- —
- Monthly cashflow
- —
- DSCR
- —
- Eligible?
- —
Short-term bridge; refi at stabilization.
Rent comps 40 comps
| Address | Beds | Baths | Sqft | Rent | $/sqft | DOM | Units | Dist |
|---|---|---|---|---|---|---|---|---|
| 1331 W 34th St Indianapolis, IN | 2.0 | 1.0 | 2160 | $1,399 | $0.65 | 23d | 1 | 0.02mi |
| 1331 W 34th St Indianapolis, IN | 4.0 | 2.0 | 2160 | $1,800 | $0.83 | 14d | 1 | 0.02mi |
| 1054 W 31st St Unit A Indianapolis, IN | 2.0 | 1.0 | 1200 | $1,500 | $1.25 | 43d | 1 | 0.41mi |
| 962 W 35th St Indianapolis, IN | 2.0 | 1.0 | 1768 | $1,195 | $0.68 | 3d | 1 | 0.43mi |
| 3217 Rader St Indianapolis, IN | 3.0 | 1.0 | 1200 | $1,299 | $1.08 | 43d | 1 | 0.44mi |
| 3057 Armory Dr Indianapolis, IN | 2.0 | 1.5 | 1674 | $1,495 | $0.89 | 7d | 1 | 0.44mi |
| 3057 Armory Dr Indianapolis, IN | 2.0 | 2.0 | 1674 | $1,695 | $1.01 | 43d | 1 | 0.44mi |
| 1227 W 29th St Indianapolis, IN | 3.0 | 1.5 | 1056 | $1,250 | $1.18 | 23d | 1 | 0.49mi |
| 926 W 32nd St Indianapolis, IN | 3.0 | 2.0 | 1050 | $1,295 | $1.23 | 7d | 1 | 0.52mi |
| 826 W 29th St Indianapolis, IN | 3.0 | 2.0 | 1200 | $1,595 | $1.33 | 43d | 1 | 0.78mi |
| 824 W 29th St Indianapolis, IN | 3.0 | 2.0 | 1200 | $1,595 | $1.33 | 43d | 1 | 0.80mi |
| 648 W 30th St Indianapolis, IN | 3.0 | 2.0 | 1300 | $1,500 | $1.15 | 23d | 1 | 0.81mi |
| 1244 Edgemont Ave Indianapolis, IN | 2.0 | 1.0 | 1092 | $1,275 | $1.17 | 43d | 1 | 0.90mi |
| 1343 Edgemont Ave Indianapolis, IN | 4.0 | 2.0 | 1545 | $2,095 | $1.36 | 43d | 1 | 0.92mi |
| 3017 Ethel Ave Indianapolis, IN | 3.0 | 1.5 | 1079 | $1,400 | $1.30 | 23d | 1 | 0.96mi |
| 560 Udell St Indianapolis, IN | 3.0 | 1.5 | 1176 | $1,190 | $1.01 | 23d | 1 | 0.99mi |
| 538 W 29th St Indianapolis, IN | 3.0 | 1.0 | 1132 | $1,349 | $1.19 | 23d | 1 | 0.99mi |
| 2248 N Harding St Indianapolis, IN | 2.0 | 1.0 | 1100 | $899 | $0.82 | 23d | 1 | 1.11mi |
| 1367 W Pruitt St Indianapolis, IN | 3.0 | 1.0 | 1088 | $1,450 | $1.33 | 43d | 1 | 1.14mi |
| 3031 Boulevard Pl Indianapolis, IN | 3.0 | 1.5 | 1395 | $1,450 | $1.04 | 17d | 1 | 1.22mi |
| 3160 Graceland Ave Indianapolis, IN | 4.0 | 2.0 | 1936 | $2,000 | $1.03 | 23d | 1 | 1.23mi |
| 2146 Gent Ave Indianapolis, IN | 3.0 | 2.0 | 1952 | $2,000 | $1.02 | 21d | 1 | 1.28mi |
| 445 W 25th St Indianapolis, IN | 4.0 | 2.0 | 1500 | $1,900 | $1.27 | 43d | 1 | 1.31mi |
| 2602 Mansion Dr Indianapolis, IN | 2.0–3.0 | 2.0 | 1850 | $1,675 | $0.91 | 7d | 6 | 1.31mi |
| 608 Bernard Ave Indianapolis, IN | 3.0 | 2.0 | 1056 | $1,475 | $1.40 | 3d | 1 | 1.32mi |
| 3413 N Capitol Ave Indianapolis, IN | 3.0 | 1.0 | 1176 | $1,249 | $1.06 | 10d | 1 | 1.33mi |
| 3415 N Capitol Ave Indianapolis, IN | 3.0 | 1.0 | 1176 | $1,249 | $1.06 | 23d | 1 | 1.33mi |
| 143 W 35th St Indianapolis, IN | 3.0 | 1.0 | 1235 | $1,175 | $0.95 | 7d | 1 | 1.36mi |
| 3622 N Capitol Ave Indianapolis, IN | 3.0 | 1.0 | 1300 | $1,300 | $1.00 | 7d | 1 | 1.37mi |
| 1135 W 21st St Indianapolis, IN | 3.0 | 2.0 | 1296 | $1,495 | $1.15 | 23d | 1 | 1.38mi |
| 1133 W 21st St Indianapolis, IN | 3.0 | 2.0 | 1296 | $1,495 | $1.15 | 23d | 1 | 1.38mi |
| 320 W 39th St Indianapolis, IN | 4.0 | 2.0 | 1216 | $2,200 | $1.81 | 7d | 1 | 1.38mi |
| 3502 N Kenwood Ave Indianapolis, IN | 3.0 | 2.0 | 1094 | $1,220 | $1.12 | 43d | 1 | 1.39mi |
| 3109 N Centennial St Indianapolis, IN | 4.0 | 2.0 | 1664 | $1,495 | $0.90 | 43d | 1 | 1.42mi |
| 2825 N Kessler Boulevard Dr Indianapolis, IN | 3.0 | 1.5 | 1228 | $1,701 | $1.39 | 23d | 1 | 1.43mi |
| 4117 Byram Ave Indianapolis, IN | 4.0 | 2.0 | 1540 | $1,930 | $1.25 | 43d | 1 | 1.43mi |
| 3827 Graceland Ave Indianapolis, IN | 4.0 | 2.0 | 2195 | $1,595 | $0.73 | 43d | 1 | 1.44mi |
| 3621 N Kenwood Ave Indianapolis, IN | 3.0 | 1.5 | 1521 | $1,599 | $1.05 | 3d | 1 | 1.45mi |
| 319 W 40th St Indianapolis, IN | 3.0 | 1.0 | 1176 | $1,295 | $1.10 | 14d | 1 | 1.46mi |
| 3457 N Illinois St Indianapolis, IN | 3.0 | 2.0 | 1230 | $1,145 | $0.93 | 23d | 1 | 1.47mi |
Listing history 2 events
-
2026-06-18remarks 580-char remark
-
2026-06-18$147,000 Active 1 DOM
ⓘ Source: listings_history table (triggers on properties + properties_extension) + one-shot
backfill from property_details.listing_events for pre-trigger history.
Tax reassessment forecast IN · Partial reset (capped growth)
- Current annual tax
- $3,131 · $261/mo
- Projected year-2 tax
- $3,131 · $261/mo
- Expected delta
- $0/yr ($0/mo · -0.0%)
ⓘ Screening estimate from a state-policy table — verify with the county assessor before closing.
Climate risk First Street
- Flood 1/10 Low FEMA zone X (unshaded) · 0% chance over 30 yrs
- Wildfire 1/10 Low
- Heat 3/10 Moderate 7 d/yr ≥102°F today · 19 d/yr by 30 yrs out
- Wind 2/10 Low 0% chance of damaging wind over 30 yrs
- Air quality 4/10 Moderate 5 unhealthy d/yr today · 7 by 30 yrs out
Nearby sold comps map
Loading sold comps map…
Walkable amenities ~0.75 mi
Loading nearby amenities…
Taxation est. · year 1
- Rental income
- $18,979
- − Mortgage interest
- −$8,234
- − Property taxes
- −$3,131
- − Insurance
- −$735
- − Repairs & maintenance
- −$1,518
- − Management
- −$1,518
- − Depreciation
- −$4,276
- Taxable loss
- −$435
- Est. tax savings @ 24.0%
- +$104
- After-tax cash flow
- $1,981/yr
For passive investors: Depreciation is non-cash, so a rental often shows a tax loss while cash-flowing — sheltering income. Rental losses are passive: they offset passive income freely, and up to $25,000/yr can offset ordinary (W-2) income if you actively participate and your MAGI is under $100k (phasing out to $0 by $150k); unused losses carry forward. On sale, claimed depreciation is recaptured at up to 25%, and gains may owe capital-gains tax (a 1031 exchange can defer both). Figures are a year-1 estimate at your 24.0% rate — not tax advice; consult a CPA.
Schools (NCES district)
- District
- Indianapolis Public Schools
- NCES district ID
- 1804770
- Math proficiency
- 14% ▼ -7.00%
- Reading proficiency
- 20% ▼ -3.00%
- Median HH income
- $32,034
- Composite
- 13.69/100
- National rank
- #9499
- State rank
- #286 of 301 in IN
Livability — Indianapolis city (balance)
No livability data for this city. (Only ~50 U.S. cities are tracked.)
Census & demographics
- Census place
- Indianapolis city (balance), IN
- County
- Marion County · 998,460 people
- City population
- 881,119
- Metro
- Indianapolis-Carmel-Anderson, IN
- Population (ZIP)
- 22,379
- Household income
- $60,062
- Rent vs Own
- Severe rent burden
- 978.0
Population outlook (Marion County) Hauer SSP2
- Today (2025)
- 1,025,572 people
- By 2030
- 1,065,727 · +3.9%
- By 2040
- 1,141,577 · +11.3%
- By 2050
- 1,208,920 · +17.9%
- By 2075
- 1,367,288 · +33.3%
- By 2100
- 1,438,201 · +40.2%
Race, ethnicity, and origin ACS 2023
- Neighborhood character
- Diverse neighborhood (Simpson 0.62)
- Race & ethnicity
- White 46% Black 40% Hispanic / Latino 8% Two or more races 6% Asian 2%
- Hispanic origin (detail)
- Mexican 4%
- Common ancestry
- Romanian 2% Slovak 2% Italian 1%
- Foreign-born
- 4% · Canada
- Languages at home
- 93% English-only · Spanish 5% French/Haitian/Cajun 1% Other Indo-European 1%
Political lean MEDSL · Marion
- 2024 margin
- Strong D (+27.7) · D 63.0% · R 35.3% · Other 1.7%
- 2008→2024 swing
- -0.7pp no change · 2008: 28.4pp · 2024: 27.7pp
- All cycles
- 2024: D+27.7 2020: D+29.1 2016: D+22.8 2012: D+22.2 2008: D+28.4
Not yet ingested
- Civics
- —
Market trends
- HPI YoY
- ▼ -324.63%
- Current HPI
- 319.7725
- Rent YoY
- ▲ 6.43%
- Metro
- Indianapolis-Carmel-Anderson, IN
- State GDP YoY
- ▲ 2.90%
- F500 in state
- 18
Industry mix (Fortune 500 HQ in IN)
| Industry | F500 HQs | Revenue |
|---|---|---|
| Industrial Machinery | 2 | $37B |
|
||
| Healthcare | 1 | $177B |
|
||
| Pharmaceuticals | 1 | $45B |
|
||
| Metals / Steel | 1 | $18B |
|
||
| Agriculture | 1 | $17B |
|
||
| Packaging | 1 | $12B |
|
||
Price history
+488.0% since first listed23 events — show timeline
- 2026-06-18 Listed $147,000 MIBOR as Distributed by MLS Grid
- 2025-02-20 Listing Removed — MIBOR as Distributed by MLS Grid
- 2024-10-31 Listed $134,900 MIBOR as Distributed by MLS Grid
- 2024-08-15 Listing Removed — MIBOR as Distributed by MLS Grid
- 2024-03-05 Listed $125,000 MIBOR as Distributed by MLS Grid
- 2023-09-30 Rental Removed $1,250 APPFOLIO
- 2023-08-31 Listed for Rent $1,250 APPFOLIO
- 2022-12-07 Listing Removed — MIBOR as Distributed by MLS Grid
- 2022-11-01 Relisted — MIBOR as Distributed by MLS Grid
- 2022-10-18 Pending — MIBOR as Distributed by MLS Grid
- 2022-10-14 Listed $65,000 MIBOR as Distributed by MLS Grid
- 2021-05-14 Sold (MLS) $42,500 MIBOR as Distributed by MLS Grid
- 2021-04-27 Pending — MIBOR as Distributed by MLS Grid
- 2021-02-25 Relisted — MIBOR as Distributed by MLS Grid
- 2021-02-15 Pending — MIBOR as Distributed by MLS Grid
- 2021-02-08 Listed $50,000 MIBOR as Distributed by MLS Grid
- 2016-08-31 Pending — MIBOR as Distributed by MLS Grid
- 2016-08-31 Listed $10,000 MIBOR as Distributed by MLS Grid
- 2016-08-26 Sold (MLS) $10,000 MIBOR as Distributed by MLS Grid
- 2015-12-06 Listing Removed — MIBOR as Distributed by MLS Grid
- 2015-09-22 Price Changed $15,000 MIBOR as Distributed by MLS Grid
- 2015-05-07 Price Changed $19,000 MIBOR as Distributed by MLS Grid
- 2014-09-30 Listed $25,000 MIBOR as Distributed by MLS Grid
Property tax history
+22.1%/yrLatest (2025): $3,131 · +14.2% YoY. Source: county tax records.
Cash-flow waterfall
monthlySold comps — $/sqft
last 12 mo · ≤1 miLoading sold comps…