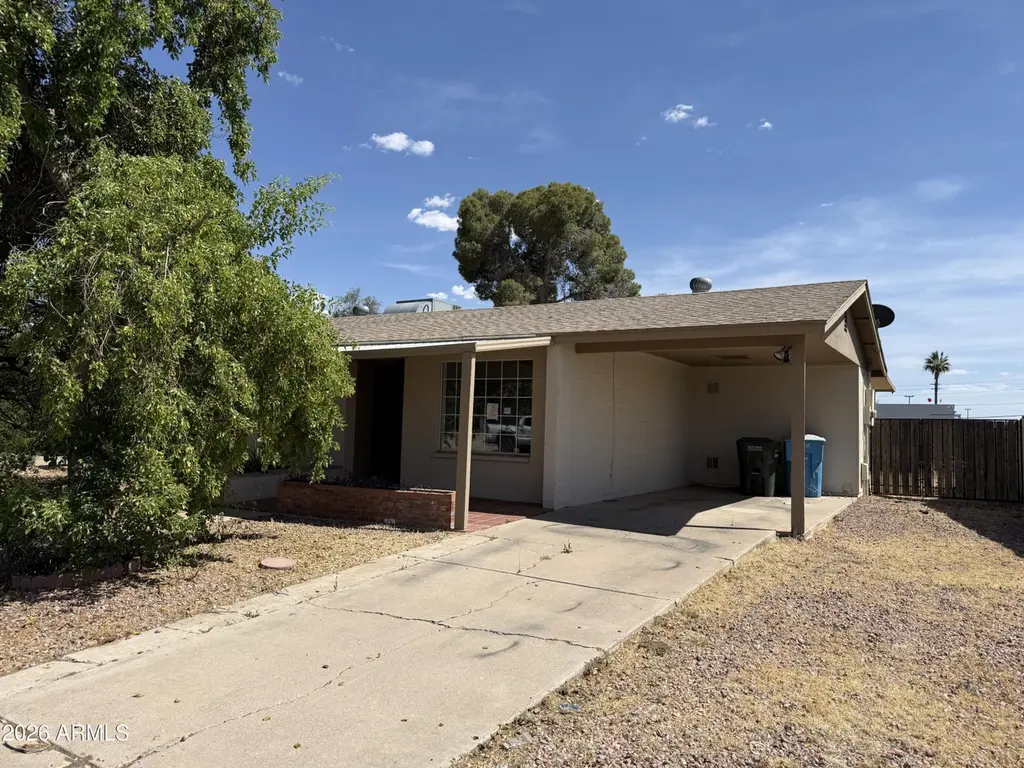
2119 W Danbury Rd · Phoenix, AZ
Flood risk 1/10 · Minimal
- FEMA flood zone
- X (shaded)
- Chance of flooding over 30 yrs
- 0.0%
- Est. flood insurance / yr
- $507 – $1,088
Fire risk 1/10 · Minimal
- Est. fire insurance / yr
- $610 – $1,132
Heat risk 9/10 · Severe
- Hot days now (above 111°F)
- 7 days/yr
- Hot days in 30 yrs
- 19 days/yr
Wind risk 1/10 · Minimal
- Chance of severe wind over 30 yrs
- —
Air-quality risk 3/10 · Minor
- Unhealthy air days now
- 3 days/yr
- Unhealthy air days in 30 yrs
- 4 days/yr
Risk factors via First Street. Map © Google.
Why this score? — see what drove the D grade
The composite is a weighted blend of 9 inputs, each scored 0–100. Each bar is that input's sub-score; the figure is the points it added to the 100-point composite (weight × sub-score).
- ARV discount +15.0/15.0
- Cash flow +9.3/30.0
- Schools +4.7/10.0
- Livability +3.8/5.0
- DSCR +2.6/10.0
- Condition / age +2.5/5.0
- Rent growth +1.7/5.0
- 1% rule +1.6/10.0
- Appreciation +0.0/10.0
$225,000
🖨 Deal sheet 📄 Offer letter ✓ Due diligence
Listing remarks MLS
Come see this beautiful single family home that offers a covered patio and large backyard with massive trees. Move in ready home features a remodeled bathroom and an eat in kitchen. The home has large windows and a sliding door that lets in tons of natural light. Come and see this fantastic home today!
Key facts
- No hoa
- 5,998 sq ft lot
- 2 parking spots
Tags
Property features AI
Finance
- Financial info: Current financing: FHA
- HOA & community: No association fees; Near bus stop
Exterior
- Parking: 1 open parking space; 1 covered space; RV gate; 1 carport space
- Utilities: City water; Public sewer
- Home design: Single-family residence; Fee simple ownership
- Construction: Painted block construction; Block fencing; Composition roof
- Exterior features: Gravel/stone front yard; Grass in back yard; City-maintained road
Interior
- Kitchen: Built-in microwave; Refrigerator; Dishwasher
- Bedrooms: Up to 3 bedrooms possible
- Flooring: Laminate flooring; Tile flooring
- Bathrooms: 1 full bathroom (total)
- Heating & cooling: Natural gas heating; Central air conditioning
- Interior features: High-speed internet; Eat-in kitchen; No interior steps; Master bedroom with 3/4 bath; Dual-pane windows
- Laundry & utility: Laundry inside with washer/dryer hookups
Neighborhood map
What this means for you Summary
Snapshot
- This is a 3-bed/1.0-bath single-family listed at $225k.
Deal economics
- At list price, monthly cash flow is $-166 ($-2k/yr) — negative.
- To cash-flow at today's rent, offer at most $196k (13.0% below list).
- To meet the 1% rule (rent ≥ 1% of price), the offer needs to be $149k (33.8% below list).
- Recommended offer: $149k (33.8% below list) — sets the bar for 1% rule.
- Cap rate 5.4% vs local median 3.3% in Phoenix — top-decile yield for the area; either an underpriced asset or a hidden risk that comps aren't pricing in. Stress-test before assuming the spread holds.
Location & tenants
- Location reads 75/100 on livability (#16 in AZ, #3,924 nationally) — a middle-class / working-renter tenant base. Strengths: amenities A+, commute A+, housing A+; Watch: health & safety C-, crime F.
- Deer Valley Unified District (4246) (urban): math 50% / reading 55% proficiency, ranked #33 of 249 in AZ (top 13%) — acceptable for families but not a draw, mixed tenant base, ~2y average lease.
- Zoned schools: Village Meadows Elementary School (math 37% / reading 37%, grade F, #438 of 1,109 statewide, top 41%, 444 students, 75% FRL); Deer Valley Middle School (math 20% / reading 30%, grade F, #105 of 218 statewide, top 49%, 537 students, 65% FRL); Barry Goldwater High School (math 24% / reading 29%, grade F, #147 of 381 statewide, top 38%, 1,641 students, 52% FRL) — zoned schools average 64% FRL vs 21% district-wide (43 pts higher); higher-poverty schools than district average — tighter screening recommended.
- Zoned-school proficiency averages 30% at this address vs 52% district-wide (-23 pts) — the specific schools serving this property underperform the Deer Valley Unified District (4246) average; the district grade overstates school quality for this exact location.
- Market conditions: Rents falling (-3.4%/yr); 138 active listings in the ZIP; 28 comparable units currently listed for rent nearby; rentals leasing fast (median 13d on market — plan ~1-2 weeks tenant-placement turnaround); solid renter incomes; 36,011 units permitted in Maricopa County in 2024 (12,801 in 5+ unit buildings).
Forward outlook
- Local home prices are declining (-3.0%/yr); year-one equity from $2k of loan paydown is wiped out by about $7k of value loss. Plan a longer hold.
- Maricopa County population projected at +38% by 2050 — long-run rental-demand tailwind backs the buy-and-hold thesis.
Negotiation context
- Only 2 days on market — expect competitive offers; lowballing is unlikely to land.
- 9 sale attempts since 20y ago with the ask held roughly flat each time — persistent listings suggest the price (not the market) is what's stuck; bring a comps-based counter.
Risks & watch-outs
- Climate carrying-cost: extreme-heat days projected 7→19/yr by 2055 (HVAC capex compounding) — expect insurance premiums to compound above CPI over the hold.
Questions for the listing agent
- What do current leases actually rent for vs. the listed asking? Can we see a recent rent roll and the last 12 months of T-12 income?
- Built in 1972 — when were the roof, HVAC, electrical panel, plumbing, and water heater last replaced?
- Is there a deadline driving the sale (1031 exchange, divorce, estate, relocation)? That informs how much negotiation room exists.
- Crime grade is F in this area — have there been break-ins, vandalism, or insurance claims at this property in the last 3 years? What carrier currently insures it and at what premium?
- The area grade is low — what's the realistic commute time and amenity access for the typical tenant pool here? Any planned neighborhood developments (good or bad) we should know about?
- What's the average days-on-market for RENTAL listings here right now (not sales)? A rising rental-DOM trend means longer vacancies and softer asking-rent achievability than the comps imply.
- What's the recent tenant-quality profile in this submarket — average credit score on applications, eviction rate, late-payment / NSF rate, and stable-employment percentage? A property-management company in the area should have these aggregated.
- How much new for-sale + rental construction is in the pipeline within 1–3 miles? Heavy new supply typically softens prices + rents 12–24 months out; constrained supply supports both.
Investment metrics
- 1% rule
- 0.66% ✗
- Cap rate
- 5.41%
- Cash-on-cash
- -3.16%
- DSCR
- 0.86
- GRM
- 12.6
CMA / ARV
- ARV (median comp)
- $374,172
- List price
- $225,000
- Delta
- -39.87%
- Verdict
- UNDERPRICED
- Comps
- 20 within 1.0 mi
Projected returns pro-forma
-3.0% appreciation · 0.0% rent growth · sell at horizon
- IRR
- -24.5%
- Equity multiple
- 0.18×
- Total profit
- $-51,489
- Equity at exit
- $33,548
- IRR
- -29.8%
- Equity multiple
- -0.20×
- Total profit
- $-75,743
- Equity at exit
- $19,454
Cash invested: $63,000 (down + closing). Projections, not guarantees.
Landlord ↔ Tenant lean methodology
- Overall (STATE)
- 87 Strongly Landlord-Friendly
- State Arizona
- 87 Strongly Landlord-Friendly · R+3
- County
- — inherits STATE
- City
- — inherits STATE
ZIP-level market 85023
- Rents YoY
- -3.4%
- Active inventory
- 138
- Price-to-rent
- 12.6×
Monthly cashflow live
- Estimated rent
- $1,491 high interval (Pro) →
- Mortgage (P&I)
- −$1,180
- Tax from tax record
- −$70 /mo · $835/yr
- Insurance
- −$94
- HOA
- −$0
- Vacancy / Maint / Mgmt
- −$313
- Net cashflow
- $-166
Break-even live
UW: 25.0% down · 7.5% · 30yr · 1.5% tax · 5.0% vac · 8.0% maint · 8.0% mgmt
Financing live
Cash to close
- Down payment
- $56,250
- Closing costs
- $6,750
- Reserves months
- —
- Total cash needed
- —
Loan-product check · same deal, 3 products live
Conventional
25% down · 7.5% · 30yr
- Down + closing
- —
- Monthly P&I
- —
- Monthly cashflow
- —
- DSCR
- —
- Eligible?
- —
Personal DTI + credit; lowest rate.
DSCR
20% down · 8.5% · 30yr
- Down + closing
- —
- Monthly P&I
- —
- Monthly cashflow
- —
- DSCR
- —
- Eligible?
- —
No personal income docs; deal must DSCR.
Hard money
10% down · 12.0% · 12mo
- Down + closing
- —
- Monthly P&I
- —
- Monthly cashflow
- —
- DSCR
- —
- Eligible?
- —
Short-term bridge; refi at stabilization.
Rent comps 28 comps
| Address | Beds | Baths | Sqft | Rent | $/sqft | DOM | Units | Dist |
|---|---|---|---|---|---|---|---|---|
| 17609 N 19th Ave Unit 204 Phoenix, AZ | 2.0 | 2.0 | 935 | $1,199 | $1.28 | 43d | 1 | 0.54mi |
| 17609 N 19th Ave Apt 107 Phoenix, AZ | 2.0 | 2.0 | 935 | $1,325 | $1.42 | 2d | 1 | 0.56mi |
| 17609 N 19th Ave Unit 209 Phoenix, AZ | 2.0 | 2.0 | 935 | $1,099 | $1.18 | 24d | 1 | 0.57mi |
| 17239 N 19th Ave Phoenix, AZ | 1.0–2.0 | 1.0–2.0 | 801 | $1,221 | $1.52 | 1d | 32 | 0.57mi |
| 17425 N 19th Ave Phoenix, AZ | 1.0–2.0 | 1.0–2.0 | 776 | $1,327 | $1.71 | 2d | 40 | 0.58mi |
| 17228 N 16th Dr #4 Phoenix, AZ | 2.0 | 2.0 | 980 | $1,500 | $1.53 | 20d | 1 | 0.74mi |
| 17840 N Black Canyon Hwy Phoenix, AZ | 1.0–2.0 | 1.0–2.0 | 880 | $1,655 | $1.88 | 2d | 19 | 0.75mi |
| 18250 N 25th Ave Phoenix, AZ | 1.0–3.0 | 1.0–2.0 | 992 | $2,015 | $2.03 | 2d | 17 | 0.81mi |
| 2554 W Kathleen Rd Phoenix, AZ | 2.0 | 2.0 | 882 | $1,900 | $2.15 | 1d | 1 | 0.90mi |
| 2039 W Union Hills Dr Unit 15-204 Phoenix, AZ | 2.0 | 1.0 | 1000 | $1,245 | $1.25 | 15d | 1 | 0.91mi |
| 2039 W Union Hills Dr Unit 39-117 Phoenix, AZ | 2.0 | 1.0 | 1000 | $1,000 | $1.00 | 7d | 1 | 0.91mi |
| 2039 W Union Hills Dr Unit 39-143 Phoenix, AZ | 2.0 | 2.0 | 1100 | $1,345 | $1.22 | 7d | 1 | 0.91mi |
| 2039 W Union Hills Dr Unit 15-001 Phoenix, AZ | 2.0 | 2.0 | 1100 | $1,345 | $1.22 | 15d | 1 | 0.91mi |
| 15449 N 25th Ave Phoenix, AZ | 1.0–2.0 | 1.0–2.0 | 791 | $1,599 | $2.02 | 1d | 11 | 1.01mi |
| 2020 W Union Hills Dr #254 Phoenix, AZ | 2.0 | 2.0 | 1049 | $1,650 | $1.57 | 43d | 1 | 1.03mi |
| 15620 N 25th Ave Phoenix, AZ | 1.0–2.0 | 1.0–2.0 | 732 | $1,300 | $1.78 | 1d | 27 | 1.03mi |
| 1118 W Helena Dr Phoenix, AZ | 2.0 | 1.0 | 960 | $2,200 | $2.29 | 43d | 1 | 1.07mi |
| 2506 W Caribbean Ln #10 Phoenix, AZ | 2.0 | 2.0 | 1055 | $1,375 | $1.30 | 14d | 1 | 1.20mi |
| 17031 N 11th Ave Phoenix, AZ | 2.0 | 1.0–2.0 | 771 | $1,437 | $1.86 | 2d | 25 | 1.21mi |
| 18811 N 19th Ave Phoenix, AZ | 1.0–2.0 | 1.0–2.0 | 885 | $1,525 | $1.72 | 2d | 2 | 1.25mi |
| 3202 W Bell Rd Phoenix, AZ | 1.0–2.0 | 1.0–2.0 | 719 | $1,299 | $1.81 | 1d | 34 | 1.27mi |
| 3144 W Charleston Ave Phoenix, AZ | 3.0 | 2.0 | 1085 | $1,845 | $1.70 | 16d | 1 | 1.31mi |
| 17216 N 33rd Ave Phoenix, AZ | 1.0–2.0 | 1.0–2.0 | 741 | $1,525 | $2.06 | 2d | 20 | 1.40mi |
| 17211 N 35th Ave Phoenix, AZ | 1.0–2.0 | 1.0–2.0 | 827 | $1,500 | $1.81 | 18d | 2 | 1.44mi |
| 2932 W Caribbean Ln Phoenix, AZ | 3.0 | 2.0 | 1035 | $1,749 | $1.69 | 16d | 1 | 1.44mi |
| 3420 W Danbury Dr Phoenix, AZ | 1.0–2.0 | 1.0–2.0 | 810 | $1,485 | $1.83 | 12d | 2 | 1.48mi |
| 3420 W Danbury Dr Phoenix, AZ | 1.0–2.0 | 1.0–2.0 | 810 | $1,485 | $1.83 | 24d | 2 | 1.48mi |
| 3434 W Danbury Dr Unit A114 Phoenix, AZ | 2.0 | 2.0 | 896 | $1,485 | $1.66 | 24d | 1 | 1.49mi |
Listing history 29 events
-
2026-05-08status Pending 737-char remark
-
2026-05-05$225,000 Active 737-char remark
-
2025-02-17historical
-
2025-01-27$374,900 Active
-
2022-10-04soldstatus $300,000 Closed
Show marketing remark (303 chars)
Come see this beautiful single family home that offers a covered patio and large backyard with massive trees. Move in ready home features a remodeled bathroom and an eat in kitchen. The home has large windows and a sliding door that lets in tons of natural light. Come and see this fantastic home today!
-
2022-10-04soldstatus $300,000
Show marketing remark (303 chars)
Come see this beautiful single family home that offers a covered patio and large backyard with massive trees. Move in ready home features a remodeled bathroom and an eat in kitchen. The home has large windows and a sliding door that lets in tons of natural light. Come and see this fantastic home today!
-
2022-10-01status Pending
Show marketing remark (303 chars)
Come see this beautiful single family home that offers a covered patio and large backyard with massive trees. Move in ready home features a remodeled bathroom and an eat in kitchen. The home has large windows and a sliding door that lets in tons of natural light. Come and see this fantastic home today!
-
2022-10-01$314,000 Active
Show marketing remark (303 chars)
Come see this beautiful single family home that offers a covered patio and large backyard with massive trees. Move in ready home features a remodeled bathroom and an eat in kitchen. The home has large windows and a sliding door that lets in tons of natural light. Come and see this fantastic home today!
-
2022-09-28soldstatus $300,000 Closed
Show marketing remark (303 chars)
Come see this beautiful single family home that offers a covered patio and large backyard with massive trees. Move in ready home features a remodeled bathroom and an eat in kitchen. The home has large windows and a sliding door that lets in tons of natural light. Come and see this fantastic home today!
-
2022-09-06status Pending
Show marketing remark (303 chars)
Come see this beautiful single family home that offers a covered patio and large backyard with massive trees. Move in ready home features a remodeled bathroom and an eat in kitchen. The home has large windows and a sliding door that lets in tons of natural light. Come and see this fantastic home today!
-
2022-09-02price $314,000
Show marketing remark (303 chars)
Come see this beautiful single family home that offers a covered patio and large backyard with massive trees. Move in ready home features a remodeled bathroom and an eat in kitchen. The home has large windows and a sliding door that lets in tons of natural light. Come and see this fantastic home today!
-
2022-08-25status Active
Show marketing remark (303 chars)
Come see this beautiful single family home that offers a covered patio and large backyard with massive trees. Move in ready home features a remodeled bathroom and an eat in kitchen. The home has large windows and a sliding door that lets in tons of natural light. Come and see this fantastic home today!
-
2022-08-23status Pending
Show marketing remark (303 chars)
Come see this beautiful single family home that offers a covered patio and large backyard with massive trees. Move in ready home features a remodeled bathroom and an eat in kitchen. The home has large windows and a sliding door that lets in tons of natural light. Come and see this fantastic home today!
-
2022-08-17$315,000 Active
Show marketing remark (303 chars)
Come see this beautiful single family home that offers a covered patio and large backyard with massive trees. Move in ready home features a remodeled bathroom and an eat in kitchen. The home has large windows and a sliding door that lets in tons of natural light. Come and see this fantastic home today!
-
2016-09-20soldstatus $143,500 Closed
-
2016-09-20soldstatus $143,500
-
2016-08-11status Pending
-
2016-08-10$139,900 Active
-
2009-01-12historical
-
2008-12-08$125,000
-
2008-09-22soldstatus $70,000
-
2008-08-06historical
-
2008-08-01$69,500
-
2006-04-28soldstatus $193,000
-
2006-04-28soldstatus $193,000
-
2006-04-20historical
-
2006-02-01$192,000
-
1977-08-08soldstatus $23,900
-
1973-04-25soldstatus $18,000
ⓘ Source: listings_history table (triggers on properties + properties_extension) + one-shot
backfill from property_details.listing_events for pre-trigger history.
Tax reassessment forecast AZ · Resets to sale price
- Current annual tax
- $835 · $70/mo
- Projected year-2 tax
- $1,485 · $124/mo
- Expected delta
- +$650/yr (+$54/mo · 77.9%)
ⓘ Screening estimate from a state-policy table — verify with the county assessor before closing.
Climate risk First Street
- Flood 1/10 Low FEMA zone X (shaded) · 0% chance over 30 yrs
- Wildfire 1/10 Low
- Heat 9/10 Extreme 7 d/yr ≥111°F today · 19 d/yr by 30 yrs out
- Wind 1/10 Low
- Air quality 3/10 Moderate 3 unhealthy d/yr today · 4 by 30 yrs out
Nearby sold comps map
Loading sold comps map…
Walkable amenities ~0.75 mi
Loading nearby amenities…
Taxation est. · year 1
- Rental income
- $17,887
- − Mortgage interest
- −$12,603
- − Property taxes
- −$835
- − Insurance
- −$1,125
- − Repairs & maintenance
- −$1,431
- − Management
- −$1,431
- − Depreciation
- −$6,545
- Taxable loss
- −$6,084
- Est. tax savings @ 24.0%
- +$1,460
- After-tax cash flow
- $-528/yr
For passive investors: Depreciation is non-cash, so a rental often shows a tax loss while cash-flowing — sheltering income. Rental losses are passive: they offset passive income freely, and up to $25,000/yr can offset ordinary (W-2) income if you actively participate and your MAGI is under $100k (phasing out to $0 by $150k); unused losses carry forward. On sale, claimed depreciation is recaptured at up to 25%, and gains may owe capital-gains tax (a 1031 exchange can defer both). Figures are a year-1 estimate at your 24.0% rate — not tax advice; consult a CPA.
Schools (NCES district)
- District
- Deer Valley Unified District (4246)
- NCES district ID
- 0407750
- Math proficiency
- 50% ▼ -9.00%
- Reading proficiency
- 55% ▼ -6.00%
- Median HH income
- $72,516
- Composite
- 47.0/100
- National rank
- #2346
- State rank
- #33 of 249 in AZ
Livability — Phoenix
- Score
- 75/100
- State rank
- #16
- US rank
- #3924
Category grades
Schools grade is shown separately in the Schools card above.
Census & demographics
- Census place
- Phoenix, AZ
- County
- Maricopa County · 4,537,380 people
- City population
- 1,500,198
- Metro
- Phoenix-Mesa-Chandler, AZ
- Population (ZIP)
- 35,034
- Household income
- $77,369
- Rent vs Own
- Severe rent burden
- 1539.0
Population outlook (Maricopa County) Hauer SSP2
- Today (2025)
- 4,979,203 people
- By 2030
- 5,378,229 · +8.0%
- By 2040
- 6,156,598 · +23.6%
- By 2050
- 6,872,376 · +38.0%
- By 2075
- 8,401,270 · +68.7%
- By 2100
- 9,247,439 · +85.7%
Race, ethnicity, and origin ACS 2023
- Neighborhood character
- Diverse neighborhood (Simpson 0.61)
- Race & ethnicity
- White 56% Hispanic / Latino 26% Two or more races 11% Black 7% Asian 6% Native American 2%
- Hispanic origin (detail)
- Mexican 22%
- Common ancestry
- Romanian 3% Italian 3% Portuguese 2%
- Foreign-born
- 17% · Canada, Jamaica, Vietnam
- Languages at home
- 73% English-only · Spanish 18% Other Indo-European 3% Other Asian/Pacific 2%
Political lean MEDSL · Maricopa
- 2024 margin
- Toss-up / Even · D 47.7% · R 51.2% · Other 1.1%
- 2008→2024 swing
- +7.1pp toward D · 2008: -10.6pp · 2024: -3.5pp
- All cycles
- 2024: R+3.5 2020: D+2.2 2016: R+3.5 2012: R+12.0 2008: R+10.6
Not yet ingested
- Civics
- —
Market trends
- HPI YoY
- ▼ -348.79%
- Current HPI
- 311.8587
- Rent YoY
- ▼ -3.35%
- Metro
- Phoenix-Mesa-Chandler, AZ
- State GDP YoY
- ▲ 4.54%
- F500 in state
- 20
Industry mix (Fortune 500 HQ in AZ)
| Industry | F500 HQs | Revenue |
|---|---|---|
| Technology | 2 | $13B |
|
||
| Mining / Metals | 1 | $23B |
|
||
| Environmental Services | 1 | $16B |
|
||
| Metals / Steel | 1 | $14B |
|
||
| Technology Distribution | 1 | $9B |
|
||
| Homebuilding | 1 | $8B |
|
||
Price history
+1150.0% since first listed29 events — show timeline
- 2026-05-08 Pending — ARMLS
- 2026-05-05 Listed $225,000 ARMLS
- 2025-02-17 Listing Removed — ARMLS
- 2025-01-27 Listed $374,900 ARMLS
- 2022-10-04 Sold (Public Records) $300,000 Public Records
- 2022-10-04 Sold (MLS) $300,000 ARMLS
- 2022-10-01 Pending — ARMLS
- 2022-10-01 Listed $314,000 ARMLS
- 2022-09-28 Sold (MLS) $300,000 ARMLS
- 2022-09-06 Pending — ARMLS
- 2022-09-02 Price Changed $314,000 ARMLS
- 2022-08-25 Relisted — ARMLS
- 2022-08-23 Pending — ARMLS
- 2022-08-17 Listed $315,000 ARMLS
- 2016-09-20 Sold (Public Records) $143,500 Public Records
- 2016-09-20 Sold (MLS) $143,500 ARMLS
- 2016-08-11 Pending — ARMLS
- 2016-08-10 Listed $139,900 ARMLS
- 2009-01-12 Listing Removed — ARMLS
- 2008-12-08 Listed $125,000 ARMLS
- 2008-09-22 Sold (MLS) $70,000 ARMLS
- 2008-08-06 Listing Removed — ARMLS
- 2008-08-01 Listed $69,500 ARMLS
- 2006-04-28 Sold (Public Records) $193,000 Public Records
- 2006-04-28 Sold (MLS) $193,000 ARMLS
- 2006-04-20 Listing Removed — ARMLS
- 2006-02-01 Listed $192,000 ARMLS
- 1977-08-08 Sold (Public Records) $23,900 Public Records
- 1973-04-25 Sold (Public Records) $18,000 Public Records
Property tax history
-0.7%/yrLatest (2025): $835 · +1.0% YoY. Source: county tax records.
Cash-flow waterfall
monthlySold comps — $/sqft
last 12 mo · ≤1 miLoading sold comps…