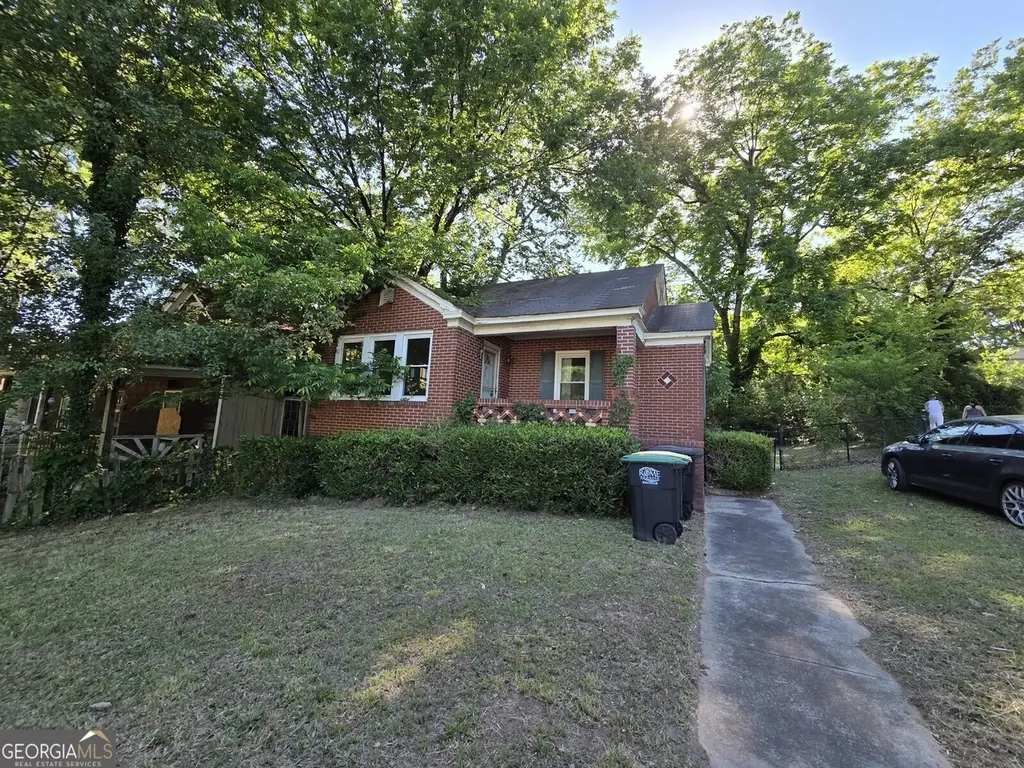
103 Pine St NE · Rome, GA
Flood risk 1/10 · Minimal
- FEMA flood zone
- X (unshaded)
- Chance of flooding over 30 yrs
- 0.0%
- Est. flood insurance / yr
- $507 – $1,088
Fire risk 4/10 · Minor
- Est. fire insurance / yr
- $963 – $1,789
Heat risk 6/10 · Moderate
- Hot days now (above 104°F)
- 7 days/yr
- Hot days in 30 yrs
- 19 days/yr
Wind risk 4/10 · Minor
- Chance of severe wind over 30 yrs
- 18.0%
Air-quality risk 3/10 · Minor
- Unhealthy air days now
- 3 days/yr
- Unhealthy air days in 30 yrs
- 3 days/yr
Risk factors via First Street. Map © Google.
Why this score? — see what drove the B+ grade
The composite is a weighted blend of 9 inputs, each scored 0–100. Each bar is that input's sub-score; the figure is the points it added to the 100-point composite (weight × sub-score).
- Cash flow +30.0/30.0
- ARV discount +14.9/15.0
- 1% rule +10.0/10.0
- DSCR +10.0/10.0
- Rent growth +4.1/5.0
- Livability +3.2/5.0
- Condition / age +2.5/5.0
- Schools +2.3/10.0
- Appreciation +0.0/10.0
$64,900
🖨 Deal sheet 📄 Offer letter ✓ Due diligence
Listing remarks MLS
Charming brick bungalow in the heart of Rome full of character and potential! 103 Pine Street offers spacious living areas, arched entryways, updated flooring in parts of the home, and timeless brick construction. This property does need significant repairs and updates and is being sold as-is, making it a great opportunity for an investor or buyer ready to bring their vision to life. Conveniently located near downtown Rome, shopping, dining, and more. Endless potential to restore and make it your own.
Key facts
- Brick bungalow
- Updated flooring
- Arched entryways
Tags
Property features AI
Finance
- Other: Directions: Please use GPS for directions
- HOA & community: Community sidewalks
Exterior
- Parking: Two total parking spaces; Driveway parking; Level driveway; Kitchen-level access to parking; Open parking available
- Utilities: Public water; Public sewer; Electric service available; Natural gas available; Cable available; Phone service available
- Home design: One-story home; Fee simple ownership; Resale property
- Construction: Brick and cement siding exterior; Composition roof; Slab foundation; Other body type
- Exterior features: Private entrance; Private yard; Deck; Front porch; Patio; Asphalt road frontage; City street access; Sidewalks in community
Interior
- Kitchen: Eat-in kitchen; Cabinets; Solid surface counters; Dishwasher; Gas range
- Bedrooms: Two main-level bedrooms; Split bedroom floor plan
- Flooring: Hardwood flooring
- Bathrooms: One full bathroom; Master bath with tub/shower combo; One main-level bathroom
- Heating & cooling: Forced air heating; Central air conditioning; Ceiling fan(s); Electric cooling components
- Interior features: High-speed internet available; Walk-in closet(s); Wood window frames; No shared/common walls
- Laundry & utility: Laundry in hall on main level
Neighborhood map
What this means for you Summary
Snapshot
- This is a 2-bed/1.0-bath single-family listed at $65k.
Deal economics
- At list price, monthly cash flow is $562 ($7k/yr) — positive.
- The deal already cash-flows at list — no discount required.
- Meets the 1% rule at list price ($1k rent vs $65k).
- Cap rate 16.7% vs local median 3.3% in Rome — top-decile yield for the area; either an underpriced asset or a hidden risk that comps aren't pricing in. Stress-test before assuming the spread holds.
Location & tenants
- Location reads 64/100 on livability (#266 in GA) — a middle-class / working-renter tenant base. Strengths: cost of living A+, housing A+, health & safety A+; Watch: crime F, amenities F, commute F.
- Rome City (urban): math 27% / reading 29% proficiency, ranked #112 of 174 in GA (top 64%) — low school quality limits family demand, transient renter base, plan for 1-2y turnover; 71% free/reduced lunch — lower-income household profile, screen leases tightly.
- Zoned schools: Main Elementary School (math 9% / reading 10%, grade F, #1,122 of 1,228 statewide, top 91%, 419 students, 97% FRL); Rome Middle School (math 32% / reading 35%, grade F, #206 of 470 statewide, top 45%, 966 students, 55% FRL); Rome High School (math 12% / reading 15%, grade F, #325 of 424 statewide, top 78%, 2,095 students, 66% FRL) — zoned schools at 73% FRL track the district average.
- Market conditions: Rents rising fast (+6.3%/yr); 411 active listings in the ZIP; 7 comparable units currently listed for rent nearby; rentals lingering (median 44d on market — plan ~5-8 weeks vacancy on turnover, expect pricing pressure); 100% of comp listings sitting > 30 days — soft ceiling on asking rent; 355 units permitted in Floyd County in 2024 (0 in 5+ unit buildings).
Forward outlook
- Local home prices are declining (-3.0%/yr); year-one equity from $449 of loan paydown is wiped out by about $2k of value loss. Plan a longer hold.
- Floyd County population projected to shrink 6% by 2050 — rents likely to lag national; underwrite the cash flow, not the appreciation.
- At projected returns (-3.0% appreciation + 6.3% rent growth), your $18k cash investment doubles in ~3 years — after that, you're playing with house money.
Negotiation context
- Only 4 days on market — expect competitive offers; lowballing is unlikely to land.
- 2 sale attempts with the ask held roughly flat each time — persistent listings suggest the price (not the market) is what's stuck; bring a comps-based counter.
- Current owner paid $24k; list at $65k implies a 165% gain — meaningful room to come down on a strong offer.
Risks & watch-outs
- Watch-outs: built in 1938 — expect roof / HVAC / electrical / plumbing capex.
- Climate carrying-cost: extreme-heat days projected 7→19/yr by 2055 (HVAC capex compounding) — expect insurance premiums to compound above CPI over the hold.
Questions for the listing agent
- Built in 1938 — when were the roof, HVAC, electrical panel, plumbing, and water heater last replaced?
- Is there a deadline driving the sale (1031 exchange, divorce, estate, relocation)? That informs how much negotiation room exists.
- Schools are F-rated, which usually means shorter tenancies and higher turnover. Who's the typical renter profile here, and what's been the actual vacancy rate?
- Crime grade is F in this area — have there been break-ins, vandalism, or insurance claims at this property in the last 3 years? What carrier currently insures it and at what premium?
- What's the average days-on-market for RENTAL listings here right now (not sales)? A rising rental-DOM trend means longer vacancies and softer asking-rent achievability than the comps imply.
- What's the recent tenant-quality profile in this submarket — average credit score on applications, eviction rate, late-payment / NSF rate, and stable-employment percentage? A property-management company in the area should have these aggregated.
- How much new for-sale + rental construction is in the pipeline within 1–3 miles? Heavy new supply typically softens prices + rents 12–24 months out; constrained supply supports both.
Investment metrics
- 1% rule
- 2.00% ✓
- Cap rate
- 16.68%
- Cash-on-cash
- 37.10%
- DSCR
- 2.65
- GRM
- 4.2
CMA / ARV
- ARV (on-the-fly)
- $77,604
- Comps found
- 9
Show comp detail 9 sales within ~0.75 mi
| Address | Dist | Beds/Ba | Sqft | Sold | Price | $/sf | Match |
|---|---|---|---|---|---|---|---|
| 5 Roseway Cir NE | 0.10mi | 3/1.0 (+1) | 936 (+5%) | 4mo | $58,000 | $62 | 78 |
| 103 Howell St NE | 0.09mi | 2/1.0 | 990 (+11%) | 5mo | $86,500 | $87 | 74 |
| 205 Howell St NE | 0.13mi | 3/1.0 (+1) | 936 (+5%) | 15mo | $60,000 | $64 | 68 |
| 4 Roseway Cir NE | 0.11mi | 3/1.0 (+1) | 1,014 (+14%) | 9mo | $158,500 | $156 | 60 |
| 114 Perkins St NE | 0.60mi | 3/1.0 (+1) | 936 (+5%) | 14mo | $165,000 | $176 | 47 |
| 304 Reynolds St NE | 0.69mi | 2/1.0 | 936 (+5%) | 23mo | $162,500 | $174 | 40 |
| 411 Superba Ave NE | 0.69mi | 2/1.5 | 966 (+8%) | 15mo | $185,000 | $192 | 40 |
| 207 Stonewall St NE | 0.73mi | 2/1.0 | 792 (-11%) | 12mo | $25,000 | $32 | 37 |
| 301 Reynolds St NE | 0.67mi | 2/2.0 | 1,010 (+13%) | 16mo | $73,500 | $73 | 30 |
Match score weights: distance 35% · size 25% · config 20% · recency 20%. Top-matched comps best support the ARV.
Projected returns pro-forma
-3.0% appreciation · 6.28% rent growth · sell at horizon
- IRR
- 36.7%
- Equity multiple
- 2.63×
- Total profit
- $29,711
- Equity at exit
- $9,677
- IRR
- 45.0%
- Equity multiple
- 6.03×
- Total profit
- $91,457
- Equity at exit
- $5,611
Cash invested: $18,172 (down + closing). Projections, not guarantees.
Landlord ↔ Tenant lean methodology
- Overall (STATE)
- 90 Strongly Landlord-Friendly
- State Georgia
- 90 Strongly Landlord-Friendly · R+3
- County
- — inherits STATE
- City
- — inherits STATE
ZIP-level market 30161
- Rents YoY
- 6.3%
- Active inventory
- 411
- Price-to-rent
- 4.2×
Monthly cashflow live
- Estimated rent
- $1,296 high interval (Pro) →
- Mortgage (P&I)
- −$340
- Tax from tax record
- −$95 /mo · $1,138/yr
- Insurance
- −$27
- HOA
- −$0
- Vacancy / Maint / Mgmt
- −$272
- Net cashflow
- $562
Break-even live
UW: 25.0% down · 7.5% · 30yr · 1.5% tax · 5.0% vac · 8.0% maint · 8.0% mgmt
Financing live
Cash to close
- Down payment
- $16,225
- Closing costs
- $1,947
- Reserves months
- —
- Total cash needed
- —
Loan-product check · same deal, 3 products live
Conventional
25% down · 7.5% · 30yr
- Down + closing
- —
- Monthly P&I
- —
- Monthly cashflow
- —
- DSCR
- —
- Eligible?
- —
Personal DTI + credit; lowest rate.
DSCR
20% down · 8.5% · 30yr
- Down + closing
- —
- Monthly P&I
- —
- Monthly cashflow
- —
- DSCR
- —
- Eligible?
- —
No personal income docs; deal must DSCR.
Hard money
10% down · 12.0% · 12mo
- Down + closing
- —
- Monthly P&I
- —
- Monthly cashflow
- —
- DSCR
- —
- Eligible?
- —
Short-term bridge; refi at stabilization.
Rent comps 7 comps
| Address | Beds | Baths | Sqft | Rent | $/sqft | DOM | Units | Dist |
|---|---|---|---|---|---|---|---|---|
| 1 Roseway Cir NE Rome, GA | 2.0 | 1.0 | 875 | $1,200 | $1.37 | 43d | 1 | 0.06mi |
| 207 Reynolds St NE Unit 4D Rome, GA | 1.0 | 1.0 | 550 | $1,000 | $1.82 | 43d | 1 | 0.64mi |
| 19 Poplar St NE Unit Na Rome, GA | 2.0 | 1.0 | 1020 | $1,550 | $1.52 | 43d | 1 | 0.86mi |
| 525 W 13th St NE Rome, GA | 2.0–3.0 | 2.0 | 1059 | $1,349 | $1.27 | 43d | 12 | 0.97mi |
| 2310 Village Blvd SE Rome, GA | 1.0 | 1.5 | 929 | $1,750 | $1.88 | 44d | 1 | 1.02mi |
| 340 W 3rd St Rome, GA | 2.0 | 1.0–2.0 | 804 | $2,225 | $2.77 | 43d | 27 | 1.05mi |
| 400 McDonald St NW Rome, GA | 1.0 | 1.0 | 950 | $1,400 | $1.47 | 43d | 1 | 1.22mi |
Listing history 3 events
-
2026-05-24$64,900 Active
Show marketing remark (506 chars)
Charming brick bungalow in the heart of Rome full of character and potential! 103 Pine Street offers spacious living areas, arched entryways, updated flooring in parts of the home, and timeless brick construction. This property does need significant repairs and updates and is being sold as-is, making it a great opportunity for an investor or buyer ready to bring their vision to life. Conveniently located near downtown Rome, shopping, dining, and more. Endless potential to restore and make it your own.
-
2026-05-24$64,900 New 506-char remark
Show marketing remark (506 chars)
Charming brick bungalow in the heart of Rome full of character and potential! 103 Pine Street offers spacious living areas, arched entryways, updated flooring in parts of the home, and timeless brick construction. This property does need significant repairs and updates and is being sold as-is, making it a great opportunity for an investor or buyer ready to bring their vision to life. Conveniently located near downtown Rome, shopping, dining, and more. Endless potential to restore and make it your own.
-
1998-08-31soldstatus $24,500
ⓘ Source: listings_history table (triggers on properties + properties_extension) + one-shot
backfill from property_details.listing_events for pre-trigger history.
Tax reassessment forecast GA · Resets to sale price
- Current annual tax
- $1,138 · $95/mo
- Projected year-2 tax
- $1,138 · $95/mo
- Expected delta
- $0/yr ($0/mo · 0.0%)
ⓘ Screening estimate from a state-policy table — verify with the county assessor before closing.
Climate risk First Street
- Flood 1/10 Low FEMA zone X (unshaded) · 0% chance over 30 yrs
- Wildfire 4/10 Moderate
- Heat 6/10 Major 7 d/yr ≥104°F today · 19 d/yr by 30 yrs out
- Wind 4/10 Moderate 18% chance of damaging wind over 30 yrs
- Air quality 3/10 Moderate 3 unhealthy d/yr today · 3 by 30 yrs out
Nearby sold comps map
Loading sold comps map…
Walkable amenities ~0.75 mi
Loading nearby amenities…
Taxation est. · year 1
- Rental income
- $15,555
- − Mortgage interest
- −$3,635
- − Property taxes
- −$1,138
- − Insurance
- −$324
- − Repairs & maintenance
- −$1,244
- − Management
- −$1,244
- − Depreciation
- −$1,888
- Taxable income
- $6,080
- Est. tax owed @ 24.0%
- −$1,459
- After-tax cash flow
- $5,282/yr
For passive investors: Depreciation is non-cash, so a rental often shows a tax loss while cash-flowing — sheltering income. Rental losses are passive: they offset passive income freely, and up to $25,000/yr can offset ordinary (W-2) income if you actively participate and your MAGI is under $100k (phasing out to $0 by $150k); unused losses carry forward. On sale, claimed depreciation is recaptured at up to 25%, and gains may owe capital-gains tax (a 1031 exchange can defer both). Figures are a year-1 estimate at your 24.0% rate — not tax advice; consult a CPA.
Schools (NCES district)
- District
- Rome City
- NCES district ID
- 1304440
- Math proficiency
- 27% ▼ -14.00%
- Reading proficiency
- 29% ▼ -4.00%
- Median HH income
- $34,889
- Composite
- 23.1/100
- National rank
- #7963
- State rank
- #112 of 174 in GA
Livability — Rome
- Score
- 64/100
- State rank
- #266
- US rank
- #14459
Category grades
Schools grade is shown separately in the Schools card above.
Census & demographics
- Census place
- Rome, GA
- County
- Floyd County · 77,706 people
- City population
- 77,706
- Metro
- Rome, GA
- Population (ZIP)
- 34,705
- Household income
- $61,667
- Rent vs Own
- Severe rent burden
- 1104.0
Population outlook (Floyd County) Hauer SSP2
- Today (2025)
- 96,321 people
- By 2030
- 95,532 · -0.8%
- By 2040
- 93,332 · -3.1%
- By 2050
- 90,850 · -5.7%
- By 2075
- 84,989 · -11.8%
- By 2100
- 76,097 · -21.0%
Race, ethnicity, and origin ACS 2023
- Neighborhood character
- Predominantly White (68%)
- Race & ethnicity
- White 68% Black 20% Hispanic / Latino 7% Two or more races 6% Asian 1%
- Hispanic origin (detail)
- Mexican 2%
- Common ancestry
- Slovak 3% Serbian 2% Italian 2%
- Foreign-born
- 5% · Canada
- Languages at home
- 91% English-only · Spanish 5% Other Indo-European 1%
Political lean MEDSL · Floyd
- 2024 margin
- Solid R (+42.0) · D 28.8% · R 70.7%
- 2008→2024 swing
- -5.6pp toward R · 2008: -36.4pp · 2024: -42.0pp
- All cycles
- 2024: R+42.0 2020: R+41.1 2016: R+43.5 2012: R+39.9 2008: R+36.4
Not yet ingested
- Civics
- —
Market trends
- HPI YoY
- ▼ -186.06%
- Current HPI
- 257.8168
- Rent YoY
- ▲ 6.28%
- Metro
- Rome, GA
- State GDP YoY
- ▲ 2.66%
- F500 in state
- 28
Industry mix (Fortune 500 HQ in GA)
| Industry | F500 HQs | Revenue |
|---|---|---|
| Paper / Packaging | 2 | $29B |
|
||
| Retail | 1 | $160B |
|
||
| Transportation / Logistics | 1 | $91B |
|
||
| Airlines | 1 | $62B |
|
||
| Consumer Goods | 1 | $47B |
|
||
| Utilities | 1 | $25B |
|
||
Price history
+164.9% since first listed3 events — show timeline
- 2026-05-24 Listed $64,900 GAMLS
- 2026-05-24 Listed $64,900 FMLS
- 1998-08-31 Sold (Public Records) $24,500 Public Records
Property tax history
+11.4%/yrLatest (2025): $1,138 · +9.7% YoY. Source: county tax records.
Cash-flow waterfall
monthlySold comps — $/sqft
last 12 mo · ≤1 miLoading sold comps…