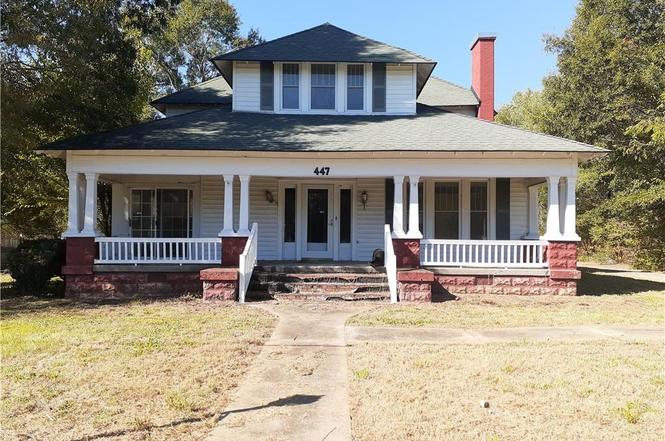
447 Cascade Ave · Eden, NC
Flood risk 1/10 · Minimal
- FEMA flood zone
- X (unshaded)
- Chance of flooding over 30 yrs
- 0.0%
- Est. flood insurance / yr
- $507 – $1,088
Fire risk 4/10 · Minor
- Est. fire insurance / yr
- $906 – $1,684
Heat risk 6/10 · Moderate
- Hot days now (above 104°F)
- 7 days/yr
- Hot days in 30 yrs
- 18 days/yr
Wind risk 4/10 · Minor
- Chance of severe wind over 30 yrs
- 7.0%
Air-quality risk 2/10 · Minimal
- Unhealthy air days now
- 1 days/yr
- Unhealthy air days in 30 yrs
- 2 days/yr
Risk factors via First Street. Map © Google.
Why this score? — see what drove the C- grade
The composite is a weighted blend of 9 inputs, each scored 0–100. Each bar is that input's sub-score; the figure is the points it added to the 100-point composite (weight × sub-score).
- Cash flow +21.5/30.0
- ARV discount +7.5/15.0
- DSCR +6.9/10.0
- 1% rule +5.4/10.0
- Livability +3.4/5.0
- Schools +3.3/10.0
- Rent growth +2.5/5.0
- Condition / age +2.5/5.0
- Appreciation +0.0/10.0
$137,700
🖨 Deal sheet 📄 Offer letter ✓ Due diligence
Listing remarks
Spacious home in Eden featuring 4 bedrooms, 2.5 bathrooms, & TWO kitchens. Functional layout w/ flexible living spaces. Check HUD Website PRIOR to Showing Property. If Property is no Longer Showing you Will NOT be Able to Submit an Offer. May be delays in the Status Changes on MLS. FHA Case#387-124193 10 days Eligible Bidders-Owner Occupants, Nonprofits, Government Agencies only. Visit Hudhomestore. gov for Condition Report, environmental concerns, bidding, & required addenda, FHA Insurability Code, Property Cond Report, Lead Based Paint, List Disclosure. All info believed accurate but to be verified by buyer. Subject to Appraisal, Seller makes no representations or warranties as
Key facts
- Two kitchens
- Functional layout
- 0.86 acre lot
Tags
Property features AI
Finance
- Other: Public maintained road; Lot number 22 on approximately 0.86 acre (buyer to confirm with survey)
- HOA & community: No homeowners association
Exterior
- Parking: Driveway (see remarks)
- Utilities: Public water; Septic tank (see remarks); Electric water heater
- Home design: Residential stick/site-built house; Two levels; Built in 1915; Existing structure
- Construction: Vinyl siding; Construction details: see remarks; Cellar (basement: cellar)
- Exterior features: Exterior features: see remarks; No pool; Storage structure on property; Five fireplaces (see remarks)
Interior
- Kitchen: Dishwasher; Free-standing range
- Bedrooms: Primary on main
- Flooring: Carpet; Wood; See remarks
- Bathrooms: 2 full bathrooms; 1 half bathroom
- Heating & cooling: Forced air heating (natural gas); Central air conditioning; Other cooling
- Interior features: Primary bedroom located on the main level; Interior features: see remarks
- Laundry & utility: Washer hookup; Dryer connection; Electric water heater
Neighborhood map
What this means for you Summary
Snapshot
- This is a 4-bed/1.0-bath single-family listed at $138k.
Deal economics
- At list price, monthly cash flow is $208 ($2k/yr) — positive.
- The deal already cash-flows at list — no discount required.
- Meets the 1% rule at list price ($1k rent vs $138k).
- Recommended offer: $121k (12.0% below list) — sets the bar for market timing.
- Cap rate 8.1% vs local median 4.3% in Eden — top-decile yield for the area; either an underpriced asset or a hidden risk that comps aren't pricing in. Stress-test before assuming the spread holds.
Location & tenants
- Location reads 67/100 on livability (#224 in NC) — a middle-class / working-renter tenant base. Strengths: cost of living A+, housing A+, health & safety A+; Watch: crime D-, amenities F, commute F.
- Rockingham County Schools (rural): math 38% / reading 40% proficiency, ranked #120 of 178 in NC (top 67%) — families likely to look elsewhere, expect single-tenant / working-renter base with shorter leases.
- Zoned schools: Lincoln Elementary (math 37% / reading 42%, grade F, #694 of 1,410 statewide, top 53%, 308 students, 68% FRL); J E Holmes Middle (math 31% / reading 37%, grade F, #294 of 475 statewide, top 63%, 627 students, 99% FRL); John M Morehead High (math 22% / reading 47%, grade F, #427 of 535 statewide, top 81%, 814 students, 64% FRL) — zoned schools average 77% FRL vs 52% district-wide (25 pts higher); higher-poverty schools than district average — tighter screening recommended.
- Market conditions: 208 active listings in the ZIP; 344 units permitted in Rockingham County in 2024 (0 in 5+ unit buildings).
- This rent runs 33% of the median local income ($53k/yr) — at the standard rent-burdened threshold; future hikes will face affordability resistance.
Forward outlook
- Local home prices are declining (-3.0%/yr); year-one equity from $952 of loan paydown is wiped out by about $4k of value loss. Plan a longer hold.
- Rockingham County population projected at -22% by 2050 — secular population decline; favor cash flow + early exit over multi-decade hold.
Negotiation context
- It's been on market 143 days — a 12% lower offer ($121k) is reasonable based on typical stale-listing flexibility.
Risks & watch-outs
- Watch-outs: built in 1915 — expect roof / HVAC / electrical / plumbing capex.
- Climate carrying-cost: extreme-heat days projected 7→18/yr by 2055 (HVAC capex compounding) — expect insurance premiums to compound above CPI over the hold.
Questions for the listing agent
- It's been on market 143 days. Have you received any prior offers? Is the seller open to a 12% concession, seller financing, or rate buy-down credit?
- Built in 1915 — when were the roof, HVAC, electrical panel, plumbing, and water heater last replaced?
- Why hasn't it sold? Are there any deal-killer items the seller is aware of (foundation, flood, title, zoning, code violations)?
- Is there a deadline driving the sale (1031 exchange, divorce, estate, relocation)? That informs how much negotiation room exists.
- Schools are F-rated, which usually means shorter tenancies and higher turnover. Who's the typical renter profile here, and what's been the actual vacancy rate?
- Crime grade is D in this area — have there been break-ins, vandalism, or insurance claims at this property in the last 3 years? What carrier currently insures it and at what premium?
- What's the average days-on-market for RENTAL listings here right now (not sales)? A rising rental-DOM trend means longer vacancies and softer asking-rent achievability than the comps imply.
- What's the recent tenant-quality profile in this submarket — average credit score on applications, eviction rate, late-payment / NSF rate, and stable-employment percentage? A property-management company in the area should have these aggregated.
- How much new for-sale + rental construction is in the pipeline within 1–3 miles? Heavy new supply typically softens prices + rents 12–24 months out; constrained supply supports both.
Investment metrics
- 1% rule
- 1.04% ✓
- Cap rate
- 8.10%
- Cash-on-cash
- 6.47%
- DSCR
- 1.29
- GRM
- 8.0
CMA / ARV
- ARV (on-the-fly)
- $1,388,088
- Comps found
- 2
Show comp detail 2 sales within ~0.75 mi
| Address | Dist | Beds/Ba | Sqft | Sold | Price | $/sf | Match |
|---|---|---|---|---|---|---|---|
| 447 Cascade Ave | 0.00mi | 4/2.5 | 2,942 (-1%) | 0mo | $1,377,000 | $468 | 92 |
| 1814 Mill Ave | 0.51mi | 3/2.5 (-1) | 2,589 (-13%) | 9mo | $257,500 | $99 | 36 |
Match score weights: distance 35% · size 25% · config 20% · recency 20%. Top-matched comps best support the ARV.
Projected returns pro-forma
-3.0% appreciation · 3.0% rent growth · sell at horizon
- IRR
- -6.3%
- Equity multiple
- 0.76×
- Total profit
- $-9,068
- Equity at exit
- $20,532
- IRR
- 3.3%
- Equity multiple
- 1.24×
- Total profit
- $9,173
- Equity at exit
- $11,906
Cash invested: $38,556 (down + closing). Projections, not guarantees.
Landlord ↔ Tenant lean methodology
- Overall (STATE)
- 85 Strongly Landlord-Friendly
- State North Carolina
- 85 Strongly Landlord-Friendly · R+3
- County
- — inherits STATE
- City
- — inherits STATE
ZIP-level market 27288
- Home prices YoY
- -26.5%
- Active inventory
- 208
- Price-to-rent
- 8.0×
Monthly cashflow live
- Estimated rent
- $1,433 medium interval (Pro) →
- Mortgage (P&I)
- −$722
- Tax from tax record
- −$145 /mo · $1,736/yr
- Insurance
- −$57
- HOA
- −$0
- Vacancy / Maint / Mgmt
- −$301
- Net cashflow
- $208
Break-even live
UW: 25.0% down · 7.5% · 30yr · 1.5% tax · 5.0% vac · 8.0% maint · 8.0% mgmt
Financing live
Cash to close
- Down payment
- $34,425
- Closing costs
- $4,131
- Reserves months
- —
- Total cash needed
- —
Loan-product check · same deal, 3 products live
Conventional
25% down · 7.5% · 30yr
- Down + closing
- —
- Monthly P&I
- —
- Monthly cashflow
- —
- DSCR
- —
- Eligible?
- —
Personal DTI + credit; lowest rate.
DSCR
20% down · 8.5% · 30yr
- Down + closing
- —
- Monthly P&I
- —
- Monthly cashflow
- —
- DSCR
- —
- Eligible?
- —
No personal income docs; deal must DSCR.
Hard money
10% down · 12.0% · 12mo
- Down + closing
- —
- Monthly P&I
- —
- Monthly cashflow
- —
- DSCR
- —
- Eligible?
- —
Short-term bridge; refi at stabilization.
Listing history 4 events
-
2026-05-08status Pending
-
2026-04-27price $137,700
-
2026-01-30price $153,000
-
2025-12-16$170,000 Active
ⓘ Source: listings_history table (triggers on properties + properties_extension) + one-shot
backfill from property_details.listing_events for pre-trigger history.
Tax reassessment forecast NC · Resets to sale price
- Current annual tax
- $1,736 · $145/mo
- Projected year-2 tax
- $1,736 · $145/mo
- Expected delta
- $0/yr ($0/mo · 0.0%)
ⓘ Screening estimate from a state-policy table — verify with the county assessor before closing.
Climate risk First Street
- Flood 1/10 Low FEMA zone X (unshaded) · 0% chance over 30 yrs
- Wildfire 4/10 Moderate
- Heat 6/10 Major 7 d/yr ≥104°F today · 18 d/yr by 30 yrs out
- Wind 4/10 Moderate 7% chance of damaging wind over 30 yrs
- Air quality 2/10 Low 1 unhealthy d/yr today · 2 by 30 yrs out
Nearby sold comps map
Loading sold comps map…
Walkable amenities ~0.75 mi
Loading nearby amenities…
Taxation est. · year 1
- Rental income
- $17,196
- − Mortgage interest
- −$7,713
- − Property taxes
- −$1,736
- − Insurance
- −$688
- − Repairs & maintenance
- −$1,376
- − Management
- −$1,376
- − Depreciation
- −$4,006
- Taxable income
- $301
- Est. tax owed @ 24.0%
- −$72
- After-tax cash flow
- $2,423/yr
For passive investors: Depreciation is non-cash, so a rental often shows a tax loss while cash-flowing — sheltering income. Rental losses are passive: they offset passive income freely, and up to $25,000/yr can offset ordinary (W-2) income if you actively participate and your MAGI is under $100k (phasing out to $0 by $150k); unused losses carry forward. On sale, claimed depreciation is recaptured at up to 25%, and gains may owe capital-gains tax (a 1031 exchange can defer both). Figures are a year-1 estimate at your 24.0% rate — not tax advice; consult a CPA.
Schools (NCES district)
- District
- Rockingham County Schools
- NCES district ID
- 3703990
- Math proficiency
- 38% ▼ -2.00%
- Reading proficiency
- 40% ▲ 1.00%
- Median HH income
- $38,914
- Composite
- 32.6/100
- National rank
- #5673
- State rank
- #120 of 178 in NC
Livability — Eden
- Score
- 67/100
- State rank
- #224
- US rank
- #10535
Category grades
Schools grade is shown separately in the Schools card above.
Census & demographics
- County
- Rockingham County · 22,926 people
- City population
- 22,926
- Metro
- Greensboro-High Point, NC
- Population (ZIP)
- 22,926
- Household income
- $52,594
- Rent vs Own
- Severe rent burden
- 860.0
Population outlook (Rockingham County) Hauer SSP2
- Today (2025)
- 87,103 people
- By 2030
- 83,763 · -3.8%
- By 2040
- 76,082 · -12.7%
- By 2050
- 68,106 · -21.8%
- By 2075
- 52,531 · -39.7%
- By 2100
- 39,871 · -54.2%
Race, ethnicity, and origin ACS 2023
- Neighborhood character
- Predominantly White (67%)
- Race & ethnicity
- White 67% Black 23% Hispanic / Latino 6% Two or more races 5% Native American 1%
- Hispanic origin (detail)
- Mexican 4%
- Common ancestry
- Serbian 2% Slovak 2% Lithuanian 1%
- Foreign-born
- 3% · Canada
- Languages at home
- 94% English-only · Spanish 5% German/W. Germanic 1%
Political lean MEDSL · Rockingham
- 2024 margin
- Solid R (+35.9) · D 31.7% · R 67.6%
- 2008→2024 swing
- -19.9pp toward R · 2008: -16.0pp · 2024: -35.9pp
- All cycles
- 2024: R+35.9 2020: R+32.0 2016: R+30.0 2012: R+21.3 2008: R+16.0
Not yet ingested
- Civics
- —
Market trends
- HPI YoY
- ▼ -66.28%
- Current HPI
- 183.5709
- Rent YoY
- —
- Metro
- Greensboro-High Point, NC
- State GDP YoY
- ▲ 3.28%
- F500 in state
- 26
Industry mix (Fortune 500 HQ in NC)
| Industry | F500 HQs | Revenue |
|---|---|---|
| Financial Services | 2 | $213B |
|
||
| Retail | 2 | $95B |
|
||
| Industrial Conglomerate | 1 | $38B |
|
||
| Metals / Steel | 1 | $35B |
|
||
| Utilities | 1 | $30B |
|
||
| Industrial Machinery | 1 | $19B |
|
||
Price history
-19.0% since first listed4 events — show timeline
- 2026-05-08 Pending — Triad MLS
- 2026-04-27 Price Changed $137,700 Triad MLS
- 2026-01-30 Price Changed $153,000 Triad MLS
- 2025-12-16 Listed $170,000 Triad MLS
Property tax history
+8.0%/yrLatest (2025): $1,736 · +0.8% YoY. Source: county tax records.
Cash-flow waterfall
monthlySold comps — $/sqft
last 12 mo · ≤1 miLoading sold comps…