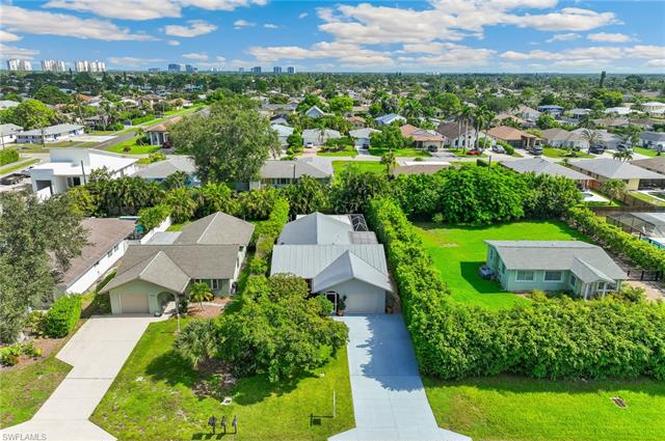
715 96th Ave N · Naples Park, FL
Flood risk 6/10 · Moderate
- FEMA flood zone
- X (shaded)
- Chance of flooding over 30 yrs
- 0.53%
- Est. flood insurance / yr
- $507 – $1,088
Fire risk 1/10 · Minimal
- Est. fire insurance / yr
- $947 – $1,759
Heat risk 10/10 · Severe
- Hot days now (above 107°F)
- 7 days/yr
- Hot days in 30 yrs
- 31 days/yr
Wind risk 10/10 · Severe
- Chance of severe wind over 30 yrs
- 99.0%
Air-quality risk 2/10 · Minimal
- Unhealthy air days now
- 1 days/yr
- Unhealthy air days in 30 yrs
- 1 days/yr
Risk factors via First Street. Map © Google.
Why this score? — see what drove the C- grade
The composite is a weighted blend of 9 inputs, each scored 0–100. Each bar is that input's sub-score; the figure is the points it added to the 100-point composite (weight × sub-score).
- Cash flow +19.1/30.0
- ARV discount +7.5/15.0
- DSCR +6.0/10.0
- 1% rule +5.1/10.0
- Schools +5.0/10.0
- Rent growth +4.7/5.0
- Livability +3.2/5.0
- Condition / age +2.5/5.0
- Appreciation +0.0/10.0
$667,500
🖨 Deal sheet (PDF) 📄 Offer letter ✓ Due diligence
Listing remarks
One or more photo(s) has been virtually staged, AI generated or rendered. One or more photo(s) has been virtually staged, AI generated or rendered. America’s top-rated beaches set the stage for this gem in the Naples Park community, delivering the ultimate coastal lifestyle. Ideally located on the highly desirable southern end of Naples Park within the 7th and 6th corridor, this meticulously maintained, south-facing 3-bedroom, 2-bath home offers 2,421 total square feet, a metal roof, Pella windows, hurricane shutters, a garage, and an extra-long driveway with parking for up to six vehicles. Inside, you’ll find a spacious living area and beautifully remodeled kitchen and baths fe
Key facts
- Screened sunroom
- Remodeled kitchen
- Hurricane shutters
Tags
Property features AI
Finance
- Other: Lot is deeded; Lot is regular with irrigation and landscaped view; Lot dimensions reported by Property Appraiser Office; Approximately 0.15 acres
- HOA & community: No HOA maintenance; Community offers beach access and internet access; Non-gated community
Exterior
- Parking: Covered parking; Paved driveway; Attached garage with 1 garage space; Auto garage door
- Security: Monitored alarm; Security system; Smoke detectors
- Utilities: Central water; Central sewer; Cable available
- Home design: Single-family residence; 1 story / ranch; Rear exposure facing north; Residential property in Naples Park
- Construction: Concrete block construction; Stucco exterior finish; Metal roof; Built in 1978
- Exterior features: Deck; Decorative shutters; Fence; Fruit trees; Patio; Storage; Water display; Screened lanai/porch
Interior
- Kitchen: Dishwasher; Disposal; Microwave; Range; Self-cleaning oven; Refrigerator/ice maker; Built-in desk
- Bedrooms: 3 bedrooms; Master bedroom on ground level
- Flooring: Laminate; Tile; Wood
- Bathrooms: 2 full bathrooms; Master bath with shower only
- Heating & cooling: Central electric heat; Central electric air conditioning; Ceiling fans
- Interior features: Built-in cabinets; Cable prewire; French doors; Laundry tub; Pull-down attic stairs; Smoke detectors; Window coverings; Built-in desk in kitchen; Dining area open to living; Eat-in kitchen; Guest bath; Guest room; Screened lanai/porch; Partially furnished; Split bedroom floor plan
- Laundry & utility: Washer; Dryer; Washer/Dryer hookup; Laundry in garage
Neighborhood map
What this means for you Summary
Snapshot
- This is a 3-bed/2.0-bath single-family listed at $668k.
Deal economics
- At list price, monthly cash flow is $713 ($9k/yr) — positive.
- The deal already cash-flows at list — no discount required.
- Meets the 1% rule at list price ($7k rent vs $668k).
- Recommended offer: $587k (12.0% below list) — sets the bar for market timing.
Location & tenants
- Location reads 64/100 on livability (#696 in FL) — a middle-class / working-renter tenant base. Strengths: crime A+, housing A-, employment B+; Watch: health & safety D, amenities F, commute F.
- Collier (suburban): math 60% / reading 56% proficiency, ranked #16 of 73 in FL (top 22%) — acceptable for families but not a draw, mixed tenant base, ~2y average lease.
- Zoned schools: Naples Park Elementary School (math 67% / reading 57%, grade B, #608 of 2,144 statewide, top 29%, 395 students, 48% FRL).
- Market conditions: Rents rising fast (+8.7%/yr); 679 active listings in the ZIP; 40 comparable units currently listed for rent nearby; rentals at typical pace (median 25d on market — plan ~3-4 weeks tenant-placement turnaround); high-income renter base; 3,520 units permitted in Collier County in 2024 (959 in 5+ unit buildings).
- At $6,742/mo this rent would consume 68% of the median local household income ($119k/yr) (locally 237% of renters already pay >50% of income on rent) — very limited rent-growth headroom before tenants either downsize or default.
Forward outlook
- Local home prices are declining (-3.0%/yr); year-one equity from $5k of loan paydown is wiped out by about $20k of value loss. Plan a longer hold.
- Collier County population projected at +30% by 2050 — long-run rental-demand tailwind backs the buy-and-hold thesis.
- At projected returns (-3.0% appreciation + 8.0% rent growth), your $187k cash investment doubles in ~10 years — after that, you're playing with house money.
Negotiation context
- It's been on market 439 days — a 12% lower offer ($587k) is reasonable based on typical stale-listing flexibility.
- 3 sale attempts; this cycle's ask has dropped $132k (16%) from the opening price — seller is motivated, your offer sets the floor, not the list.
- Current owner paid $87k; list at $668k implies a 667% gain — meaningful room to come down on a strong offer.
Risks & watch-outs
- Climate carrying-cost: major flood risk; severe wind risk, 99% chance of damaging wind over 30y; extreme-heat days projected 7→31/yr by 2055 (HVAC capex compounding) — expect insurance premiums to compound above CPI over the hold.
Questions for the listing agent
- It's been on market 439 days. Have you received any prior offers? Is the seller open to a 12% concession, seller financing, or rate buy-down credit?
- Built in 1978 — when were the roof, HVAC, electrical panel, plumbing, and water heater last replaced?
- Why hasn't it sold? Are there any deal-killer items the seller is aware of (foundation, flood, title, zoning, code violations)?
- Is there a deadline driving the sale (1031 exchange, divorce, estate, relocation)? That informs how much negotiation room exists.
- Schools are F-rated, which usually means shorter tenancies and higher turnover. Who's the typical renter profile here, and what's been the actual vacancy rate?
- What's the average days-on-market for RENTAL listings here right now (not sales)? A rising rental-DOM trend means longer vacancies and softer asking-rent achievability than the comps imply.
- What's the recent tenant-quality profile in this submarket — average credit score on applications, eviction rate, late-payment / NSF rate, and stable-employment percentage? A property-management company in the area should have these aggregated.
- How much new for-sale + rental construction is in the pipeline within 1–3 miles? Heavy new supply typically softens prices + rents 12–24 months out; constrained supply supports both.
Investment metrics
- 1% rule
- 1.01% ✓
- Cap rate
- 7.57%
- Cash-on-cash
- 4.58%
- DSCR
- 1.20
- GRM
- 8.3
CMA / ARV
No comps found within radius.
Projected returns pro-forma
-3.0% appreciation · 8.0% rent growth · sell at horizon
- IRR
- -3.7%
- Equity multiple
- 0.86×
- Total profit
- $-27,033
- Equity at exit
- $99,526
- IRR
- 11.0%
- Equity multiple
- 2.06×
- Total profit
- $197,490
- Equity at exit
- $57,713
Cash invested: $186,900 (down + closing). Projections, not guarantees.
Landlord ↔ Tenant lean methodology
- Overall (STATE)
- 87 Strongly Landlord-Friendly
- State Florida
- 87 Strongly Landlord-Friendly · R+3
- County
- — inherits STATE
- City
- — inherits STATE
ZIP-level market 34108
- Rents YoY
- 8.7%
- Active inventory
- 679
- Price-to-rent
- 8.3×
Monthly cashflow live
- Estimated rent
- $6,742 high interval (Pro) →
- Mortgage (P&I)
- −$3,500
- Tax est. 1.5%
- −$834 /mo · $10,012/yr
- Insurance
- −$278
- HOA
- −$0
- Vacancy / Maint / Mgmt
- −$1,416
- Net cashflow
- $713
Break-even live
Sensitivity live
| Price | -10% $1,174 | -5% $943 | +0% $713 | +5% $482 | +10% $252 |
|---|---|---|---|---|---|
| Rent | -10% $180 | -5% $447 | +0% $713 | +5% $979 | +10% $1,245 |
| Rate | -1.0pp $1,049 | -0.5pp $883 | base $713 | +0.5pp $540 | +1.0pp $364 |
UW: 25.0% down · 7.5% · 30yr · 1.5% tax · 5.0% vac · 8.0% maint · 8.0% mgmt
Financing live
Cash to close
- Down payment
- $166,875
- Closing costs
- $20,025
- Reserves months
- —
- Total cash needed
- —
Loan-product check · same deal, 3 products live
Conventional
25% down · 7.5% · 30yr
- Down + closing
- —
- Monthly P&I
- —
- Monthly cashflow
- —
- DSCR
- —
- Eligible?
- —
Personal DTI + credit; lowest rate.
DSCR
20% down · 8.5% · 30yr
- Down + closing
- —
- Monthly P&I
- —
- Monthly cashflow
- —
- DSCR
- —
- Eligible?
- —
No personal income docs; deal must DSCR.
Hard money
10% down · 12.0% · 12mo
- Down + closing
- —
- Monthly P&I
- —
- Monthly cashflow
- —
- DSCR
- —
- Eligible?
- —
Short-term bridge; refi at stabilization.
Rent comps 40 comps
| Address | Beds | Baths | Sqft | Rent | $/sqft | DOM | Units | Dist |
|---|---|---|---|---|---|---|---|---|
| 717 95th Ave N Unit 1 Naples, FL | 2.0 | 1.0 | 1500 | $2,100 | $1.40 | 24d | 1 | 0.07mi |
| 682 95th Ave N Naples, FL | 3.0 | 2.0 | 1600 | $12,500 | $7.81 | 24d | 1 | 0.11mi |
| 684 98th Ave N Naples, FL | 3.0 | 2.0 | 1702 | $4,500 | $2.64 | 14d | 1 | 0.11mi |
| 648 96th Ave N Naples, FL | 3.0 | 2.0 | 1768 | $12,000 | $6.79 | 24d | 1 | 0.14mi |
| 757 95th Ave N Naples, FL | 2.0 | 2.0 | 1100 | $2,150 | $1.95 | 24d | 1 | 0.14mi |
| 671 94th Ave N Naples, FL | 3.0 | 2.0 | 1464 | $6,800 | $4.64 | 24d | 1 | 0.14mi |
| 645 95th Ave N Unit 1 Naples, FL | 3.0 | 2.0 | 957 | $2,750 | $2.87 | 14d | 1 | 0.16mi |
| 768 96th Ave N Naples, FL | 3.0 | 2.0 | 1735 | $11,500 | $6.63 | 24d | 1 | 0.17mi |
| 736 94th Ave N Naples, FL | 3.0 | 2.0 | 1820 | $3,500 | $1.92 | 24d | 1 | 0.17mi |
| 630 95th Ave N Unit S Naples, FL | 3.0 | 2.0 | 1411 | $5,500 | $3.90 | 24d | 1 | 0.20mi |
| 630 95th Ave N Unit A Naples, FL | 3.0 | 2.0 | 1411 | $2,995 | $2.12 | 24d | 1 | 0.20mi |
| 625 97th Ave N Naples, FL | 3.0 | 2.0 | 1496 | $3,800 | $2.54 | 24d | 1 | 0.21mi |
| 690 100th Ave N Naples, FL | 3.0 | 2.0 | 1800 | $12,500 | $6.94 | 24d | 1 | 0.22mi |
| 793 97th Ave N Naples, FL | 3.0 | 2.0 | 1700 | $10,500 | $6.18 | 24d | 1 | 0.23mi |
| 794 95th Ave N Naples, FL | 3.0 | 2.0 | 1805 | $6,500 | $3.60 | 24d | 1 | 0.24mi |
| 791 94th Ave N Naples, FL | 3.0 | 2.0 | 1400 | $9,000 | $6.43 | 24d | 1 | 0.24mi |
| 650 93rd Ave N Unit 1073498P Naples, FL | 3.0 | 2.0 | 1442 | $5,136 | $3.56 | 14d | 1 | 0.25mi |
| 660 100th Ave N Unit 1404250P Naples, FL | 3.0 | 2.0 | 1571 | $6,068 | $3.86 | 14d | 1 | 0.25mi |
| 799 94th Ave N Naples, FL | 3.0 | 2.0 | 1674 | $5,000 | $2.99 | 24d | 1 | 0.26mi |
| 671 100th Ave N Naples, FL | 3.0 | 2.0 | 1164 | $5,500 | $4.73 | 24d | 1 | 0.27mi |
| 751 100th Ave N Naples, FL | 2.0 | 1.0 | 912 | $4,000 | $4.39 | 24d | 1 | 0.28mi |
| 772 100th Ave N Naples, FL | 3.0 | 2.0 | 1712 | $3,200 | $1.87 | 24d | 1 | 0.28mi |
| 663 100th Ave N Naples, FL | 2.0 | 1.0 | 1000 | $2,650 | $2.65 | 24d | 1 | 0.28mi |
| 801 99th Ave N Naples, FL | 2.0 | 2.0 | 1781 | $3,500 | $1.97 | 24d | 1 | 0.31mi |
| 737 91st Ave N Naples, FL | 3.0 | 2.0 | 1566 | $12,750 | $8.14 | 24d | 1 | 0.32mi |
| 595 93rd Ave N Naples, FL | 2.0 | 2.0 | 1374 | $5,000 | $3.64 | 24d | 1 | 0.32mi |
| 749 91st Ave N Naples, FL | 3.0 | 3.0 | 1417 | $3,750 | $2.65 | 14d | 1 | 0.33mi |
| 757 101st Ave N Naples, FL | 3.0 | 2.0 | 1366 | $3,900 | $2.86 | 24d | 1 | 0.34mi |
| 857 Reef Point Cir Naples, FL | 2.0 | 2.0 | 1359 | $7,500 | $5.52 | 24d | 1 | 0.34mi |
| 829 Reef Point Cir Unit 46 Naples, FL | 2.0 | 2.0 | 1359 | $7,500 | $5.52 | 24d | 1 | 0.35mi |
| 562 96th Ave N Unit 1534821P Naples, FL | 3.0 | 2.0 | 1819 | $9,869 | $5.43 | 24d | 1 | 0.36mi |
| 10022 8th St N Unit B Naples, FL | 2.0 | 2.0 | 1249 | $2,225 | $1.78 | 14d | 1 | 0.36mi |
| 10022 8th St N Unit 22 Naples, FL | 2.0 | 2.0 | 1250 | $2,250 | $1.80 | 24d | 1 | 0.36mi |
| 552 97th Ave N Naples, FL | 3.0 | 2.0 | 1612 | $3,890 | $2.41 | 24d | 1 | 0.38mi |
| 845 Reef Point Cir Naples, FL | 2.0 | 2.0 | 1359 | $4,200 | $3.09 | 24d | 1 | 0.39mi |
| 691 102nd Ave N Naples, FL | 3.0 | 2.0 | 1311 | $7,000 | $5.34 | 24d | 1 | 0.39mi |
| 856 98th Ave N Naples, FL | 3.0 | 2.0 | 1711 | $4,500 | $2.63 | 24d | 1 | 0.40mi |
| 522 Beachwalk Cir Naples, FL | 2.0 | 2.0 | 1359 | $6,000 | $4.42 | 24d | 1 | 0.40mi |
| 661 Windsurf Ln Unit A-202 Naples, FL | 2.0 | 2.0 | 1350 | $7,500 | $5.56 | 14d | 1 | 0.41mi |
| 822 Gulf Pavilion Dr #202 Naples, FL | 2.0 | 2.0 | 1275 | $6,500 | $5.10 | 24d | 1 | 0.42mi |
Listing history 25 events
-
2026-06-18days on market $667,500 Active 439 DOM
-
2026-06-17days on market $667,500 Active 438 DOM
-
2026-06-16days on market $667,500 Active 437 DOM
-
2026-06-15days on market $667,500 Active 436 DOM
-
2026-06-10days on market $667,500 Active 431 DOM
-
2026-06-09days on market $667,500 Active 430 DOM
-
2026-06-08days on market $667,500 Active 429 DOM
-
2026-06-07days on market $667,500 Active 428 DOM
-
2026-06-02days on market $667,500 Active 423 DOM
-
2026-06-01days on market $667,500 Active 422 DOM
-
2026-05-31days on market $667,500 Active 421 DOM
-
2026-05-30remarks 687-char remark
-
2026-05-30pricedays on market $667,500 Active 420 DOM
-
2026-04-07price $679,000
-
2026-03-12price $699,000
-
2026-02-27price $714,900
-
2026-01-15price $729,000
-
2026-01-05status Active
-
2025-12-22historical
-
2025-10-06status Active
-
2025-08-21historical
-
2025-07-08price $749,000
-
2025-03-30price $779,000
-
2025-02-05$799,000 Active
-
1995-08-07soldstatus $87,000
ⓘ Source: listings_history table (triggers on properties + properties_extension) + one-shot
backfill from property_details.listing_events for pre-trigger history.
Climate risk First Street
- Flood 6/10 Major FEMA zone X (shaded) · 53% chance over 30 yrs
- Wildfire 1/10 Low
- Heat 10/10 Extreme 7 d/yr ≥107°F today · 31 d/yr by 30 yrs out
- Wind 10/10 Extreme 99% chance of damaging wind over 30 yrs
- Air quality 2/10 Low 1 unhealthy d/yr today · 1 by 30 yrs out
Nearby sold comps map
Loading sold comps map…
Walkable amenities ~0.75 mi
Loading nearby amenities…
Taxation est. · year 1
- Rental income
- $80,898
- − Mortgage interest
- −$37,390
- − Property taxes
- −$10,012
- − Insurance
- −$3,338
- − Repairs & maintenance
- −$6,472
- − Management
- −$6,472
- − Depreciation
- −$19,418
- Taxable loss
- −$2,204
- Est. tax savings @ 24.0%
- +$529
- After-tax cash flow
- $9,083/yr
For passive investors: Depreciation is non-cash, so a rental often shows a tax loss while cash-flowing — sheltering income. Rental losses are passive: they offset passive income freely, and up to $25,000/yr can offset ordinary (W-2) income if you actively participate and your MAGI is under $100k (phasing out to $0 by $150k); unused losses carry forward. On sale, claimed depreciation is recaptured at up to 25%, and gains may owe capital-gains tax (a 1031 exchange can defer both). Figures are a year-1 estimate at your 24.0% rate — not tax advice; consult a CPA.
Schools (NCES district)
- District
- Collier
- NCES district ID
- 1200330
- Math proficiency
- 60% ▼ -4.00%
- Reading proficiency
- 56% ▼ -2.00%
- Median HH income
- $58,275
- Composite
- 50.23/100
- National rank
- #1892
- State rank
- #16 of 73 in FL
Livability — Naples Park
- Score
- 64/100
- State rank
- #696
- US rank
- #14564
Category grades
Schools grade is shown separately in the Schools card above.
Census & demographics
- Census place
- Naples Park, FL
- County
- Collier County · 396,295 people
- Metro
- Naples-Marco Island, FL
- Population (ZIP)
- 16,237
- Household income
- $119,212
- Rent vs Own
- Severe rent burden
- 237.0
Population outlook (Collier County) Hauer SSP2
- Today (2025)
- 420,858 people
- By 2030
- 450,054 · +6.9%
- By 2040
- 502,232 · +19.3%
- By 2050
- 544,932 · +29.5%
- By 2075
- 627,203 · +49.0%
- By 2100
- 659,015 · +56.6%
Race, ethnicity, and origin ACS 2023
- Neighborhood character
- Predominantly White (87%)
- Race & ethnicity
- White 87% Hispanic / Latino 8% Two or more races 7% Asian 1% Black 1%
- Hispanic origin (detail)
- Mexican 2% Cuban 3%
- Common ancestry
- Romanian 5% Lithuanian 3% Slovak 3%
- Foreign-born
- 16% · Canada, Dominican Republic, South Korea
- Languages at home
- 86% English-only · Spanish 6% Russian/Polish/Slavic 2% Other Indo-European 2%
Political lean MEDSL · Collier
- 2024 margin
- Solid R (+33.1) · D 33.1% · R 66.2%
- 2008→2024 swing
- -10.6pp toward R · 2008: -22.5pp · 2024: -33.1pp
- All cycles
- 2024: R+33.1 2020: R+24.7 2016: R+26.0 2012: R+30.1 2008: R+22.5
Not yet ingested
- Civics
- —
Market trends
- HPI YoY
- ▼ -587.97%
- Current HPI
- 275.1872
- Rent YoY
- ▲ 8.74%
- Metro
- Naples-Marco Island, FL
- State GDP YoY
- ▲ 3.28%
- F500 in state
- 36
Industry mix (Fortune 500 HQ in FL)
| Industry | F500 HQs | Revenue |
|---|---|---|
| Industrial Technology | 2 | $29B |
|
||
| Insurance | 2 | $17B |
|
||
| Retail | 1 | $60B |
|
||
| Technology Distribution | 1 | $58B |
|
||
| Homebuilding | 1 | $35B |
|
||
| Technology Manufacturing | 1 | $35B |
|
||
Price history
+680.5% since first listed12 events — show timeline
- 2026-04-07 Price Changed $679,000 NAPLESMLS
- 2026-03-12 Price Changed $699,000 NAPLESMLS
- 2026-02-27 Price Changed $714,900 NAPLESMLS
- 2026-01-15 Price Changed $729,000 NAPLESMLS
- 2026-01-05 Relisted — NAPLESMLS
- 2025-12-22 Listing Removed — NAPLESMLS
- 2025-10-06 Relisted — NAPLESMLS
- 2025-08-21 Listing Removed — NAPLESMLS
- 2025-07-08 Price Changed $749,000 NAPLESMLS
- 2025-03-30 Price Changed $779,000 NAPLESMLS
- 2025-02-05 Listed $799,000 NAPLESMLS
- 1995-08-07 Sold (Public Records) $87,000 Public Records
Property tax history
+3.2%/yrLatest (2025): $1,330 · +2.7% YoY. Source: county tax records.
Cash-flow waterfall
monthlySold comps — $/sqft
last 12 mo · ≤1 miLoading sold comps…