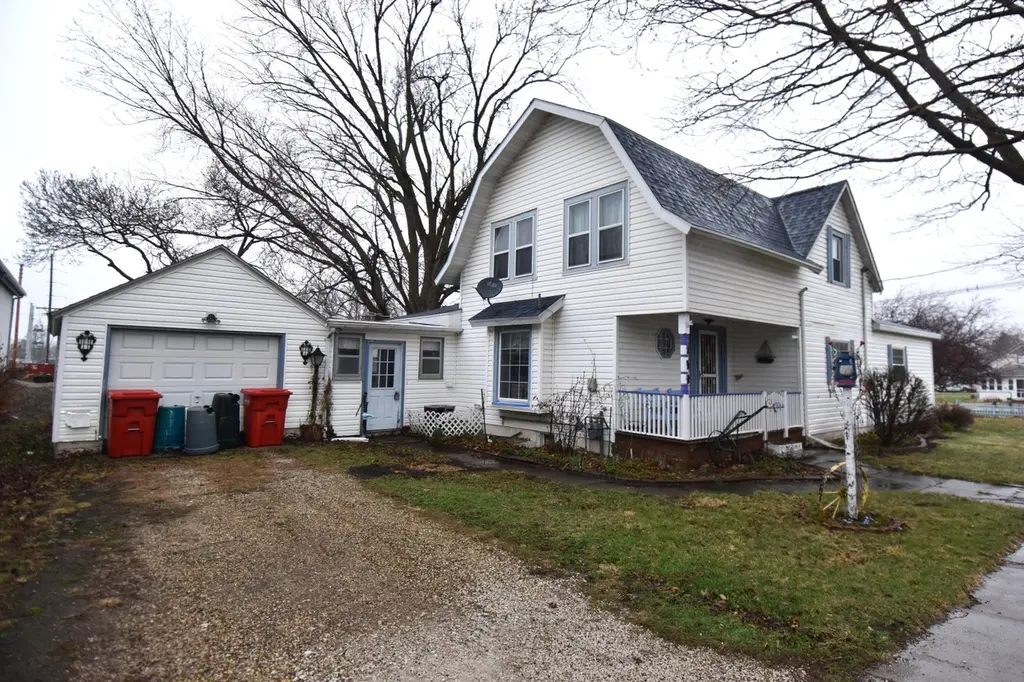
214 N 1st St · Ogden, IA
Flood risk 1/10 · Minimal
- FEMA flood zone
- X (unshaded)
- Chance of flooding over 30 yrs
- 0.0%
- Est. flood insurance / yr
- $473 – $860
Fire risk 1/10 · Minimal
- Est. fire insurance / yr
- $902 – $1,676
Heat risk 3/10 · Minor
- Hot days now (above 103°F)
- 7 days/yr
- Hot days in 30 yrs
- 15 days/yr
Wind risk 2/10 · Minimal
- Chance of severe wind over 30 yrs
- —
Air-quality risk 1/10 · Minimal
- Unhealthy air days now
- 0 days/yr
- Unhealthy air days in 30 yrs
- 0 days/yr
Risk factors via First Street. Map © Google.
Why this score? — see what drove the C grade
The composite is a weighted blend of 9 inputs, each scored 0–100. Each bar is that input's sub-score; the figure is the points it added to the 100-point composite (weight × sub-score).
- ARV discount +15.0/15.0
- Cash flow +12.1/30.0
- Appreciation +10.0/10.0
- Schools +6.5/10.0
- Livability +4.0/5.0
- 1% rule +3.7/10.0
- DSCR +3.6/10.0
- Rent growth +2.5/5.0
- Condition / age +2.5/5.0
$140,000
🖨 Deal sheet 📄 Offer letter ✓ Due diligence
Key facts
- Garage
- Built 1898
Neighborhood map
What this means for you Summary
Snapshot
- This is a 3-bed/1.0-bath single-family listed at $140k.
Deal economics
- At list price, monthly cash flow is $-31 ($-368/yr) — negative.
- To cash-flow at today's rent, offer at most $135k (3.9% below list).
- To meet the 1% rule (rent ≥ 1% of price), the offer needs to be $122k (12.5% below list).
- Recommended offer: $122k (12.5% below list) — sets the bar for 1% rule.
- Cap rate 6.0% vs local median 2.8% in Ogden — top-decile yield for the area; either an underpriced asset or a hidden risk that comps aren't pricing in. Stress-test before assuming the spread holds.
Location & tenants
- Location reads 81/100 on livability (#70 in IA, #1,530 nationally) — a professional / high-income tenant draw. Strengths: schools A+, crime A+, cost of living A+; Watch: employment D, amenities F, commute F.
- Ogden Community School District (rural): math 74% / reading 77% proficiency, ranked #61 of 289 in IA (top 21%) — strong family-tenant draw, lease renewals of 3-5y typical; only 20% free/reduced lunch — higher-income household profile.
- Market conditions: 31 active listings in the ZIP; 80 units permitted in Boone County in 2024 (16 in 5+ unit buildings).
Forward outlook
- In year one you build about $15k of equity ($968 loan paydown + $14k appreciation (10.0% local appreciation)).
- At projected returns (10.0% appreciation + 3.0% rent growth), your $39k cash investment doubles in ~3 years — after that, you're playing with house money.
- By year 3, paydown + projected appreciation supports a ~$38k cash-out refi (75% LTV) — recoverable capital for the next deal without selling this one.
Negotiation context
- Only 0 days on market — expect competitive offers; lowballing is unlikely to land.
Risks & watch-outs
- Watch-outs: built in 1898 — expect roof / HVAC / electrical / plumbing capex.
Questions for the listing agent
- What do current leases actually rent for vs. the listed asking? Can we see a recent rent roll and the last 12 months of T-12 income?
- Built in 1898 — when were the roof, HVAC, electrical panel, plumbing, and water heater last replaced?
- Is there a deadline driving the sale (1031 exchange, divorce, estate, relocation)? That informs how much negotiation room exists.
- Schools are A-rated — typically a magnet for longer-tenancy family renters. What's the average tenant stay here, and is there a school-zone premium baked into asking?
- What's the average days-on-market for RENTAL listings here right now (not sales)? A rising rental-DOM trend means longer vacancies and softer asking-rent achievability than the comps imply.
- What's the recent tenant-quality profile in this submarket — average credit score on applications, eviction rate, late-payment / NSF rate, and stable-employment percentage? A property-management company in the area should have these aggregated.
- How much new for-sale + rental construction is in the pipeline within 1–3 miles? Heavy new supply typically softens prices + rents 12–24 months out; constrained supply supports both.
Investment metrics
- 1% rule
- 0.87% ✗
- Cap rate
- 6.03%
- Cash-on-cash
- -0.94%
- DSCR
- 0.96
- GRM
- 9.5
CMA / ARV
- ARV (on-the-fly)
- $223,839
- Comps found
- 12
Show comp detail 12 sales within ~0.75 mi
| Address | Dist | Beds/Ba | Sqft | Sold | Price | $/sf | Match |
|---|---|---|---|---|---|---|---|
| 214 N 1st St | 0.00mi | 4/1.0 (+1) | 1,683 (0%) | 1mo | $135,000 | $80 | 94 |
| 201 SE 2nd St | 0.20mi | 2/2.0 (-1) | 1,544 (-8%) | 4mo | $205,000 | $133 | 64 |
| 702 W Locust St | 0.43mi | 3/2.0 | 1,804 (+7%) | 0mo | $72,000 | $40 | 64 |
| 714 W Sycamore St | 0.45mi | 4/2.0 (+1) | 1,704 (+1%) | 9mo | $186,665 | $110 | 60 |
| 219 S 1st St | 0.20mi | 4/2.0 (+1) | 1,536 (-9%) | 9mo | $220,000 | $143 | 60 |
| 107 SW 2nd St | 0.15mi | 4/2.0 (+1) | 1,880 (+12%) | 7mo | $59,900 | $32 | 59 |
| 107 SW 8th St | 0.50mi | 3/3.5 | 1,738 (+3%) | 10mo | $410,000 | $236 | 53 |
| 501 NW 3rd St | 0.21mi | 3/2.0 | 1,904 (+13%) | 14mo | $154,900 | $81 | 53 |
| 513 W Maple St | 0.32mi | 3/1.5 | 1,922 (+14%) | 12mo | $126,108 | $66 | 49 |
| 631 W Division St | 0.56mi | 4/2.0 (+1) | 1,562 (-7%) | 13mo | $267,000 | $171 | 42 |
| 502 Jones SW 2nd St St | 0.54mi | 3/2.5 | 1,492 (-11%) | 10mo | $262,000 | $176 | 42 |
| 534 SW 5th St | 0.64mi | 4/3.5 (+1) | 1,804 (+7%) | 11mo | $420,000 | $233 | 34 |
Match score weights: distance 35% · size 25% · config 20% · recency 20%. Top-matched comps best support the ARV.
Projected returns pro-forma
10.0% appreciation · 3.0% rent growth · sell at horizon
- IRR
- 23.6%
- Equity multiple
- 2.90×
- Total profit
- $74,333
- Equity at exit
- $126,123
- IRR
- 21.0%
- Equity multiple
- 6.63×
- Total profit
- $220,507
- Equity at exit
- $271,989
Cash invested: $39,200 (down + closing). Projections, not guarantees.
Landlord ↔ Tenant lean methodology
- Overall (STATE)
- 83 Strongly Landlord-Friendly
- State Iowa
- 83 Strongly Landlord-Friendly · R+6
- County
- — inherits STATE
- City
- — inherits STATE
ZIP-level market 50212
- Home prices YoY
- 5.1%
- Active inventory
- 31
- Price-to-rent
- 9.5×
Monthly cashflow live
- Estimated rent
- $1,225 medium interval (Pro) →
- Mortgage (P&I)
- −$734
- Tax from tax record
- −$206 /mo · $2,470/yr
- Insurance
- −$58
- HOA
- −$0
- Vacancy / Maint / Mgmt
- −$257
- Net cashflow
- $-31
Break-even live
UW: 25.0% down · 7.5% · 30yr · 1.5% tax · 5.0% vac · 8.0% maint · 8.0% mgmt
Financing live
Cash to close
- Down payment
- $35,000
- Closing costs
- $4,200
- Reserves months
- —
- Total cash needed
- —
Loan-product check · same deal, 3 products live
Conventional
25% down · 7.5% · 30yr
- Down + closing
- —
- Monthly P&I
- —
- Monthly cashflow
- —
- DSCR
- —
- Eligible?
- —
Personal DTI + credit; lowest rate.
DSCR
20% down · 8.5% · 30yr
- Down + closing
- —
- Monthly P&I
- —
- Monthly cashflow
- —
- DSCR
- —
- Eligible?
- —
No personal income docs; deal must DSCR.
Hard money
10% down · 12.0% · 12mo
- Down + closing
- —
- Monthly P&I
- —
- Monthly cashflow
- —
- DSCR
- —
- Eligible?
- —
Short-term bridge; refi at stabilization.
Listing history 3 events
-
2026-06-01$140,000 Pending
-
2026-04-10$140,000
-
2026-04-10historical
ⓘ Source: listings_history table (triggers on properties + properties_extension) + one-shot
backfill from property_details.listing_events for pre-trigger history.
Tax reassessment forecast IA · Partial reset (capped growth)
- Current annual tax
- $2,470 · $206/mo
- Projected year-2 tax
- $2,470 · $206/mo
- Expected delta
- $0/yr ($0/mo · 0.0%)
ⓘ Screening estimate from a state-policy table — verify with the county assessor before closing.
Climate risk First Street
- Flood 1/10 Low FEMA zone X (unshaded) · 0% chance over 30 yrs
- Wildfire 1/10 Low
- Heat 3/10 Moderate 7 d/yr ≥103°F today · 15 d/yr by 30 yrs out
- Wind 2/10 Low
- Air quality 1/10 Low 0 unhealthy d/yr today · 0 by 30 yrs out
Nearby sold comps map
Loading sold comps map…
Walkable amenities ~0.75 mi
Loading nearby amenities…
Taxation est. · year 1
- Rental income
- $14,699
- − Mortgage interest
- −$7,842
- − Property taxes
- −$2,470
- − Insurance
- −$700
- − Repairs & maintenance
- −$1,176
- − Management
- −$1,176
- − Depreciation
- −$4,073
- Taxable loss
- −$2,738
- Est. tax savings @ 24.0%
- +$657
- After-tax cash flow
- $289/yr
For passive investors: Depreciation is non-cash, so a rental often shows a tax loss while cash-flowing — sheltering income. Rental losses are passive: they offset passive income freely, and up to $25,000/yr can offset ordinary (W-2) income if you actively participate and your MAGI is under $100k (phasing out to $0 by $150k); unused losses carry forward. On sale, claimed depreciation is recaptured at up to 25%, and gains may owe capital-gains tax (a 1031 exchange can defer both). Figures are a year-1 estimate at your 24.0% rate — not tax advice; consult a CPA.
Schools (NCES district)
- District
- Ogden Community School District
- NCES district ID
- 1921660
- Math proficiency
- 74% ▼ -9.00%
- Reading proficiency
- 77% ▼ -7.00%
- Median HH income
- $56,714
- Composite
- 64.56/100
- National rank
- #536
- State rank
- #61 of 289 in IA
Livability — Ogden
- Score
- 81/100
- State rank
- #70
- US rank
- #1530
Category grades
Schools grade is shown separately in the Schools card above.
Census & demographics
- Census place
- Ogden, IA
- Population (ZIP)
- 3,109
Population outlook (Boone County) Hauer SSP2
- Today (2025)
- 27,674 people
- By 2030
- 28,058 · +1.4%
- By 2040
- 28,474 · +2.9%
- By 2050
- 28,383 · +2.6%
- By 2075
- 27,647 · -0.1%
- By 2100
- 25,485 · -7.9%
Race, ethnicity, and origin ACS 2023
- Neighborhood character
- Predominantly White (98%)
- Race & ethnicity
- White 98% Two or more races 1%
- Common ancestry
- Iranian 6% Portuguese 6% Italian 2%
- Foreign-born
- 1%
Political lean MEDSL · Boone
- 2024 margin
- Strong R (+21.5) · D 38.4% · R 59.9% · Other 1.6%
- 2008→2024 swing
- -29.2pp toward R · 2008: 7.6pp · 2024: -21.5pp
- All cycles
- 2024: R+21.5 2020: R+15.6 2016: R+13.9 2012: D+6.4 2008: D+7.6
Not yet ingested
- Civics
- —
Market trends
- HPI YoY
- ▲ 12.76%
- Current HPI
- 263.0
- Rent YoY
- —
- Metro
- —
- State GDP YoY
- ▲ 2.48%
- F500 in state
- 4
Industry mix (Fortune 500 HQ in IA)
| Industry | F500 HQs | Revenue |
|---|---|---|
| Financial Services | 1 | $16B |
|
||
| Retail / Convenience | 1 | $15B |
|
||
Price history
2 events — show timeline
- 2026-04-10 Listing Removed — DMMLS
- 2026-04-10 Listed $140,000 DMMLS
Property tax history
+9.8%/yrLatest (2025): $2,470 · +7.4% YoY. Source: county tax records.
Cash-flow waterfall
monthlySold comps — $/sqft
last 12 mo · ≤1 miLoading sold comps…