12650 Alta Vis · Magnolia, TX
Flood risk 1/10 · Minimal
- FEMA flood zone
- X (unshaded)
- Chance of flooding over 30 yrs
- 0.0%
- Est. flood insurance / yr
- $507 – $1,088
Fire risk 5/10 · Moderate
- Est. fire insurance / yr
- $1,222 – $2,270
Heat risk 8/10 · Major
- Hot days now (above 111°F)
- 7 days/yr
- Hot days in 30 yrs
- 24 days/yr
Wind risk 8/10 · Major
- Chance of severe wind over 30 yrs
- 99.0%
Air-quality risk 2/10 · Minimal
- Unhealthy air days now
- 2 days/yr
- Unhealthy air days in 30 yrs
- 2 days/yr
Risk factors via First Street. Map © Google.
Why this score? — see what drove the D grade
The composite is a weighted blend of 9 inputs, each scored 0–100. Each bar is that input's sub-score; the figure is the points it added to the 100-point composite (weight × sub-score).
- Appreciation +10.0/10.0
- ARV discount +8.8/15.0
- Cash flow +6.0/30.0
- Schools +3.9/10.0
- Livability +3.7/5.0
- 1% rule +2.7/10.0
- Rent growth +2.6/5.0
- Condition / age +2.5/5.0
- DSCR +0.4/10.0
$279,000
🖨 Deal sheet 📄 Offer letter ✓ Due diligence
Listing remarks MLS
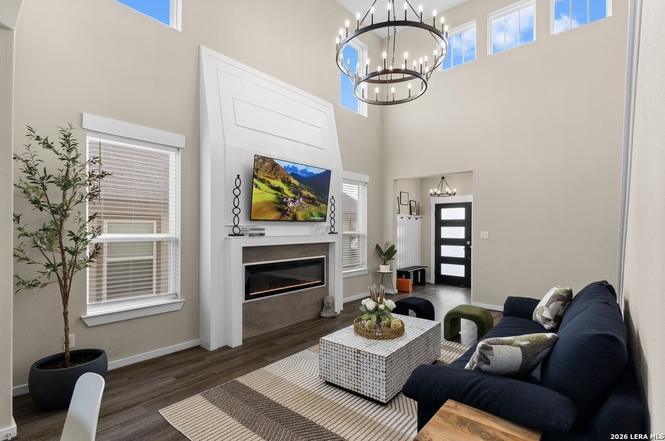
Welcome Home! This 3 bed and 2.5 bath home is practically brand new! Upon entering you are greeted with an open floor plan and high ceilings. The living room flows into the kitchen, making entertaining a breeze! Check out the view from the kitchen sink! No rear neighbors with beautiful hills to enjoy looking at. The primary bedroom is conveniently located on the first floor. Heading upstairs you will find a large loft/game room, great for any use! There is 2 additional bedrooms on the second floor with a shared bath. Located in highly acclaimed Magnolia ISD with quick access to shopping, dining and entertainment this location is perfect!
Key facts
- Upgraded lighting
- Granite countertops
- 5,140 sq ft lot
Tags
Property features AI
Exterior
- Parking: 2-car garage
- Utilities: Public water; Public sewer
- Home design: Pre-owned single-family home; Approximately 7 years old
- Construction: Cement fiber and siding exterior; Composition roof; Slab foundation
- Exterior features: Covered patio; Patio slab; Privacy fence
Interior
- Kitchen: Gas cooking; Stove/Range; Refrigerator; Dishwasher; Disposal; Kitchen island; Eat-in kitchen
- Bedrooms: Master bedroom on lower level with full bath (13 x 12); Bedroom 2 (11 x 12); Bedroom 3 (11 x 12)
- Flooring: Carpeting; Vinyl flooring
- Bathrooms: 2 full bathrooms, 1 half bathroom; Master bath with tub/shower combination (10 x 8)
- Heating & cooling: Central heating (electric); Central air conditioning
- Interior features: Ceiling fans; Chandelier; Central vacuum; Smoke alarm; Garage door opener; Open floor plan; High ceilings; Living/Dining room combination; Eat-in kitchen; Kitchen island; Laundry room
- Laundry & utility: Washer and dryer included; Washer connection; Dryer connection; Laundry on main level; Electric water heater
Neighborhood map
What this means for you Summary
Snapshot
- This is a 3-bed/2.5-bath single-family listed at $279k.
Deal economics
- At list price, monthly cash flow is $-529 ($-6k/yr) — negative.
- To cash-flow at today's rent, offer at most $185k (33.5% below list).
- To meet the 1% rule (rent ≥ 1% of price), the offer needs to be $214k (23.3% below list).
- Recommended offer: $185k (33.5% below list) — sets the bar for cash-flow.
Location & tenants
- Location reads 73/100 on livability (#222 in TX) — a middle-class / working-renter tenant base. Strengths: crime A+, cost of living A+, housing A+; Watch: schools D+, amenities F, commute F.
- Magnolia ISD (rural): math 42% / reading 45% proficiency, ranked #247 of 826 in TX (top 30%) — families likely to look elsewhere, expect single-tenant / working-renter base with shorter leases.
- Market conditions: Rents flat; 1604 active listings in the ZIP; 2 comparable units currently listed for rent nearby; high-income renter base; 13,259 units permitted in Montgomery County in 2024 (1,402 in 5+ unit buildings).
Forward outlook
- In year one you build about $30k of equity ($2k loan paydown + $28k appreciation (10.0% local appreciation)).
- Montgomery County population projected at +65% by 2050 — long-run rental-demand tailwind backs the buy-and-hold thesis.
- By year 2, paydown + projected appreciation supports a ~$48k cash-out refi (75% LTV) — recoverable capital for the next deal without selling this one.
Negotiation context
- Only 5 days on market — expect competitive offers; lowballing is unlikely to land.
- 7 sale attempts since 7y ago with the ask held roughly flat each time — persistent listings suggest the price (not the market) is what's stuck; bring a comps-based counter.
Risks & watch-outs
- Watch-outs: property tax is 2.8% of price.
- Climate carrying-cost: severe wind risk, 99% chance of damaging wind over 30y; moderate wildfire risk; extreme-heat days projected 7→24/yr by 2055 (HVAC capex compounding) — expect insurance premiums to compound above CPI over the hold.
Questions for the listing agent
- What do current leases actually rent for vs. the listed asking? Can we see a recent rent roll and the last 12 months of T-12 income?
- Property tax is high relative to price — has the assessment been appealed recently, and will the sale trigger a re-assessment?
- Is there a deadline driving the sale (1031 exchange, divorce, estate, relocation)? That informs how much negotiation room exists.
- Schools are D-rated, which usually means shorter tenancies and higher turnover. Who's the typical renter profile here, and what's been the actual vacancy rate?
- The area grade is low — what's the realistic commute time and amenity access for the typical tenant pool here? Any planned neighborhood developments (good or bad) we should know about?
- What's the average days-on-market for RENTAL listings here right now (not sales)? A rising rental-DOM trend means longer vacancies and softer asking-rent achievability than the comps imply.
- What's the recent tenant-quality profile in this submarket — average credit score on applications, eviction rate, late-payment / NSF rate, and stable-employment percentage? A property-management company in the area should have these aggregated.
- How much new for-sale + rental construction is in the pipeline within 1–3 miles? Heavy new supply typically softens prices + rents 12–24 months out; constrained supply supports both.
Investment metrics
- 1% rule
- 0.77% ✗
- Cap rate
- 4.02%
- Cash-on-cash
- -8.13%
- DSCR
- 0.64
- GRM
- 10.9
CMA / ARV
- ARV (on-the-fly)
- $287,064
- Comps found
- 12
Show comp detail 12 sales within ~0.75 mi
| Address | Dist | Beds/Ba | Sqft | Sold | Price | $/sf | Match |
|---|---|---|---|---|---|---|---|
| 12743 Dina Springs Ln | 0.03mi | 3/2.0 | 1,810 (+2%) | 1mo | $254,990 | $141 | 92 |
| 40639 Mostyn Lake Dr | 0.15mi | 4/2.0 (+1) | 1,748 (-1%) | 5mo | $282,990 | $162 | 80 |
| 40696 Pessi Rd | 0.18mi | 4/2.0 (+1) | 1,748 (-1%) | 6mo | $282,990 | $162 | 77 |
| 12739 Dina Springs Ln | 0.03mi | 3/2.0 | 1,606 (-9%) | 6mo | $267,990 | $167 | 76 |
| 12759 Dina Springs Ln | 0.05mi | 4/2.0 (+1) | 1,597 (-10%) | 1mo | $268,990 | $168 | 74 |
| 40716 Pessi Rd | 0.21mi | 4/2.5 (+1) | 1,889 (+7%) | 2mo | $268,990 | $142 | 73 |
| 12751 Dina Springs Ln | 0.04mi | 4/2.0 (+1) | 1,978 (+12%) | 0mo | $269,990 | $136 | 72 |
| 40494 Mostyn Lake Dr | 0.21mi | 3/2.0 | 1,640 (-7%) | 6mo | $269,000 | $164 | 71 |
| 12735 Dina Springs Ln | 0.03mi | 4/3.0 (+1) | 2,026 (+14%) | 3mo | $319,990 | $158 | 65 |
| 13082 Sarah Springs Way | 0.20mi | 3/2.0 | 1,518 (-14%) | 5mo | $244,990 | $161 | 60 |
| 40723 Mostyn Lake Dr | 0.26mi | 3/2.0 | 1,518 (-14%) | 6mo | $252,990 | $167 | 57 |
| 40756 Mostyn Lake Dr | 0.31mi | 4/3.5 (+1) | 2,035 (+15%) | 4mo | $309,000 | $152 | 48 |
Match score weights: distance 35% · size 25% · config 20% · recency 20%. Top-matched comps best support the ARV.
Projected returns pro-forma
10.0% appreciation · 0.32% rent growth · sell at horizon
- IRR
- 17.8%
- Equity multiple
- 2.44×
- Total profit
- $112,820
- Equity at exit
- $251,345
- IRR
- 16.2%
- Equity multiple
- 5.47×
- Total profit
- $348,974
- Equity at exit
- $542,036
Cash invested: $78,120 (down + closing). Projections, not guarantees.
Landlord ↔ Tenant lean methodology
- Overall (STATE)
- 87 Strongly Landlord-Friendly
- State Texas
- 87 Strongly Landlord-Friendly · R+5
- County
- — inherits STATE
- City
- — inherits STATE
ZIP-level market 77354
- Home prices YoY
- 2.4%
- Rents YoY
- 0.3%
- Active inventory
- 1604
- Price-to-rent
- 10.9×
Monthly cashflow live
- Estimated rent
- $2,140 medium interval (Pro) →
- Mortgage (P&I)
- −$1,463
- Tax from tax record
- −$641 /mo · $7,693/yr
- Insurance
- −$116
- HOA
- −$0
- Vacancy / Maint / Mgmt
- −$449
- Net cashflow
- $-529
Break-even live
UW: 25.0% down · 7.5% · 30yr · 1.5% tax · 5.0% vac · 8.0% maint · 8.0% mgmt
Financing live
Cash to close
- Down payment
- $69,750
- Closing costs
- $8,370
- Reserves months
- —
- Total cash needed
- —
Loan-product check · same deal, 3 products live
Conventional
25% down · 7.5% · 30yr
- Down + closing
- —
- Monthly P&I
- —
- Monthly cashflow
- —
- DSCR
- —
- Eligible?
- —
Personal DTI + credit; lowest rate.
DSCR
20% down · 8.5% · 30yr
- Down + closing
- —
- Monthly P&I
- —
- Monthly cashflow
- —
- DSCR
- —
- Eligible?
- —
No personal income docs; deal must DSCR.
Hard money
10% down · 12.0% · 12mo
- Down + closing
- —
- Monthly P&I
- —
- Monthly cashflow
- —
- DSCR
- —
- Eligible?
- —
Short-term bridge; refi at stabilization.
Rent comps 2 comps
| Address | Beds | Baths | Sqft | Rent | $/sqft | DOM | Units | Dist |
|---|---|---|---|---|---|---|---|---|
| 40700 Pessi Rd Magnolia, TX | 3.0 | 2.0 | 1240 | $2,100 | $1.69 | 43d | 1 | 0.19mi |
| 4225 Magnolia Village Dr Magnolia, TX | 1.0–2.0 | 1.0–2.0 | 994 | $1,992 | $2.00 | 1d | 31 | 1.17mi |
Listing history 9 events
-
2026-06-18days on market $279,000 Active 5 DOM
-
2026-06-17days on market $279,000 Active 4 DOM
-
2026-06-16days on market $279,000 Active 3 DOM
-
2026-06-15pricestatusdays on market $279,000 Active 2 DOM
-
2026-06-13days on market $275,000 Price Change 9 DOM
-
2026-06-09days on market $275,000 Price Change 5 DOM
-
2026-06-08days on market $275,000 Price Change 4 DOM
-
2026-06-07remarks 635-char remark
-
2026-06-07$275,000 Price Change 3 DOM
ⓘ Source: listings_history table (triggers on properties + properties_extension) + one-shot
backfill from property_details.listing_events for pre-trigger history.
Tax reassessment forecast TX · Resets to sale price
- Current annual tax
- $7,693 · $641/mo
- Projected year-2 tax
- $7,693 · $641/mo
- Expected delta
- $0/yr ($0/mo · 0.0%)
ⓘ Screening estimate from a state-policy table — verify with the county assessor before closing.
Climate risk First Street
- Flood 1/10 Low FEMA zone X (unshaded) · 0% chance over 30 yrs
- Wildfire 5/10 Major
- Heat 8/10 Severe 7 d/yr ≥111°F today · 24 d/yr by 30 yrs out
- Wind 8/10 Severe 99% chance of damaging wind over 30 yrs
- Air quality 2/10 Low 2 unhealthy d/yr today · 2 by 30 yrs out
Nearby sold comps map
Loading sold comps map…
Walkable amenities ~0.75 mi
Loading nearby amenities…
Taxation est. · year 1
- Rental income
- $25,685
- − Mortgage interest
- −$15,628
- − Property taxes
- −$7,693
- − Insurance
- −$1,395
- − Repairs & maintenance
- −$2,055
- − Management
- −$2,055
- − Depreciation
- −$8,116
- Taxable loss
- −$11,257
- Est. tax savings @ 24.0%
- +$2,702
- After-tax cash flow
- $-3,652/yr
For passive investors: Depreciation is non-cash, so a rental often shows a tax loss while cash-flowing — sheltering income. Rental losses are passive: they offset passive income freely, and up to $25,000/yr can offset ordinary (W-2) income if you actively participate and your MAGI is under $100k (phasing out to $0 by $150k); unused losses carry forward. On sale, claimed depreciation is recaptured at up to 25%, and gains may owe capital-gains tax (a 1031 exchange can defer both). Figures are a year-1 estimate at your 24.0% rate — not tax advice; consult a CPA.
Schools (NCES district)
- District
- Magnolia ISD
- NCES district ID
- 4828740
- Math proficiency
- 42% ▼ -7.00%
- Reading proficiency
- 45% ▼ -4.00%
- Median HH income
- $71,692
- Composite
- 39.46/100
- National rank
- #3958
- State rank
- #247 of 826 in TX
Livability — Magnolia
- Score
- 73/100
- State rank
- #222
- US rank
- #5442
Category grades
Schools grade is shown separately in the Schools card above.
Census & demographics
- County
- Montgomery County · 663,713 people
- City population
- 32,847
- Metro
- Houston-The Woodlands-Sugar Land, TX
- Population (ZIP)
- 44,900
- Household income
- $112,504
- Rent vs Own
- Severe rent burden
- 586.0
Population outlook (Montgomery County) Hauer SSP2
- Today (2025)
- 713,896 people
- By 2030
- 805,263 · +12.8%
- By 2040
- 992,708 · +39.1%
- By 2050
- 1,179,590 · +65.2%
- By 2075
- 1,628,084 · +128.1%
- By 2100
- 1,937,880 · +171.5%
Race, ethnicity, and origin ACS 2023
- Neighborhood character
- Predominantly White (66%)
- Race & ethnicity
- White 66% Hispanic / Latino 25% Two or more races 18% Black 3% Asian 1%
- Hispanic origin (detail)
- Mexican 14% Puerto Rican 1%
- Common ancestry
- Lithuanian 4% Slovak 2% Italian 2%
- Foreign-born
- 11% · Canada, Vietnam
- Languages at home
- 83% English-only · Spanish 15% Other Indo-European 1% German/W. Germanic 1%
Political lean MEDSL · Montgomery
- 2024 margin
- Solid R (+45.5) · D 26.8% · R 72.3%
- 2008→2024 swing
- +7.2pp toward D · 2008: -52.7pp · 2024: -45.5pp
- All cycles
- 2024: R+45.5 2020: R+43.8 2016: R+51.4 2012: R+60.7 2008: R+52.7
Not yet ingested
- Civics
- —
Market trends
- HPI YoY
- ▲ 12.09%
- Current HPI
- 512.87
- Rent YoY
- ▲ 0.32%
- Metro
- Houston-The Woodlands-Sugar Land, TX
- State GDP YoY
- ▲ 3.95%
- F500 in state
- 110
Industry mix (Fortune 500 HQ in TX)
| Industry | F500 HQs | Revenue |
|---|---|---|
| Energy | 16 | $1,198B |
|
||
| Technology | 5 | $198B |
|
||
| Engineering / Construction | 4 | $72B |
|
||
| Energy Services | 3 | $60B |
|
||
| Utilities | 3 | $41B |
|
||
| Healthcare | 2 | $330B |
|
||
Price history
+22.2% since first listed27 events — show timeline
- 2026-06-06 Price Changed $275,000 LERA
- 2026-06-04 Listed $287,000 LERA
- 2024-10-30 Rental Removed $2,000 HARMLS
- 2024-10-30 Listing Removed — HARMLS
- 2024-10-19 Rental Removed $2,000 REDFIN
- 2024-10-19 Listed for Rent $2,000 HARMLS
- 2024-10-18 Relisted — HARMLS
- 2024-10-18 Price Changed $2,000 REDFIN
- 2024-10-16 Price Changed $1,950 REDFIN
- 2024-10-16 Price Changed $1,850 REDFIN
- 2024-10-13 Listed for Rent $2,250 REDFIN
- 2024-10-13 Listing Removed — HARMLS
- 2024-09-20 Listed $299,000 HARMLS
- 2024-09-17 Coming Soon — HARMLS
- 2022-03-23 Sold (Public Records) — Public Records
- 2022-03-22 Sold (MLS) — HARMLS
- 2022-02-19 Pending — HARMLS
- 2022-02-18 Listed $265,000 HARMLS
- 2019-12-09 Sold (MLS) — HARMLS
- 2019-11-25 Pending — HARMLS
- 2019-11-15 Price Changed $204,990 HARMLS
- 2019-10-21 Price Changed $209,990 HARMLS
- 2019-10-07 Price Changed $214,990 HARMLS
- 2019-09-26 Price Changed $209,990 HARMLS
- 2019-09-09 Price Changed $199,990 HARMLS
- 2019-09-05 Price Changed $219,990 HARMLS
- 2019-07-09 Listed $224,990 HARMLS
Property tax history
+68.5%/yrLatest (2025): $7,693 · +1.7% YoY. Source: county tax records.
Cash-flow waterfall
monthlySold comps — $/sqft
last 12 mo · ≤1 miLoading sold comps…