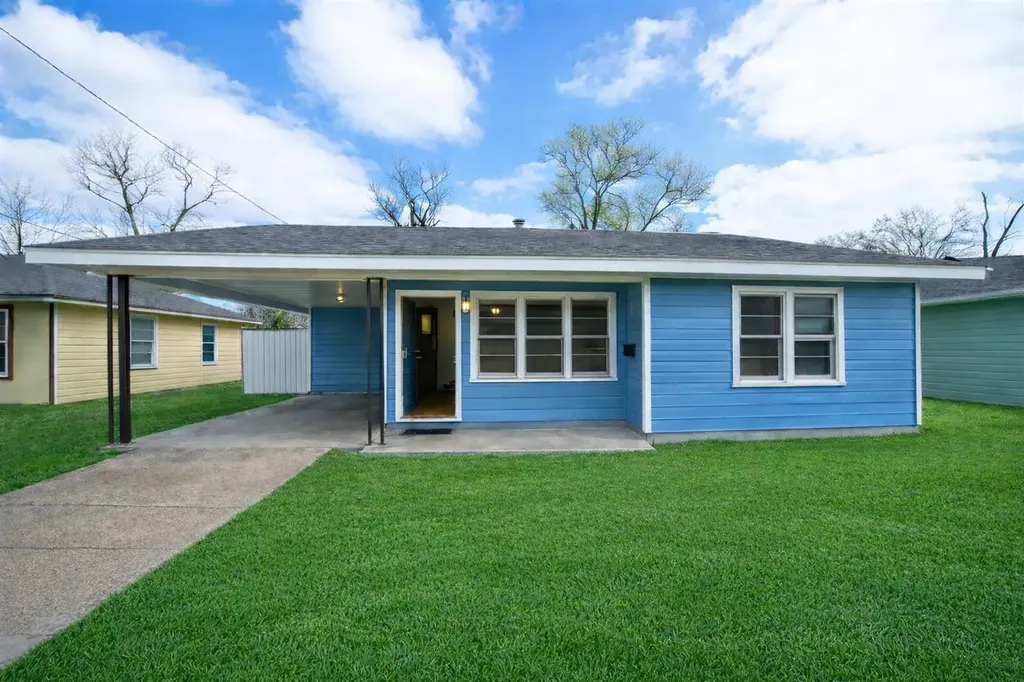
4780 El Paso St · Beaumont, TX
Flood risk 3/10 · Minor
- FEMA flood zone
- X
- Chance of flooding over 30 yrs
- 0.2%
- Est. flood insurance / yr
- $507 – $1,088
Fire risk 3/10 · Minor
- Est. fire insurance / yr
- $1,222 – $2,270
Heat risk 9/10 · Severe
- Hot days now (above 109°F)
- 7 days/yr
- Hot days in 30 yrs
- 24 days/yr
Wind risk 9/10 · Severe
- Chance of severe wind over 30 yrs
- 99.0%
Air-quality risk 2/10 · Minimal
- Unhealthy air days now
- 1 days/yr
- Unhealthy air days in 30 yrs
- 1 days/yr
Risk factors via First Street. Map © Google.
Why this score? — see what drove the B- grade
The composite is a weighted blend of 9 inputs, each scored 0–100. Each bar is that input's sub-score; the figure is the points it added to the 100-point composite (weight × sub-score).
- Cash flow +27.6/30.0
- DSCR +9.7/10.0
- Appreciation +7.7/10.0
- 1% rule +7.6/10.0
- ARV discount +6.7/15.0
- Livability +3.2/5.0
- Rent growth +2.5/5.0
- Condition / age +2.5/5.0
- Schools +1.5/10.0
$97,500
🖨 Deal sheet 📄 Offer letter ✓ Due diligence
Listing remarks MLS
For sale in Beaumont, this inviting three-bedroom, one-bath home offers comfort, practicality, and great everyday living. Inside, you’ll find carpet flooring throughout the living room and bedrooms, with linoleum flooring in the kitchen and bathroom for easy maintenance. The spacious living room provides plenty of room to gather and relax, plus a convenient storage closet for added functionality. Just off the kitchen, a dedicated utility room includes electric washer and dryer connections, making this home as practical as it is welcoming. A great opportunity for buyers looking for a cozy place to call home.
Key facts
- Parking
- Listed 105 days
Neighborhood map
What this means for you Summary
Snapshot
- This is a 3-bed/1.0-bath single-family listed at $98k.
Deal economics
- At list price, monthly cash flow is $292 ($4k/yr) — positive.
- The deal already cash-flows at list — no discount required.
- Meets the 1% rule at list price ($1k rent vs $98k).
- Recommended offer: $89k (9.0% below list) — sets the bar for market timing.
- Cap rate 9.9% vs local median 5.3% in Beaumont — top-decile yield for the area; either an underpriced asset or a hidden risk that comps aren't pricing in. Stress-test before assuming the spread holds.
Location & tenants
- Location reads 64/100 on livability (#739 in TX) — a middle-class / working-renter tenant base. Strengths: cost of living A+, housing A+, health & safety A+; Watch: employment D, schools D-, crime F.
- Beaumont ISD (urban): math 14% / reading 22% proficiency, ranked #789 of 826 in TX (top 96%) — low school quality limits family demand, transient renter base, plan for 1-2y turnover; 69% free/reduced lunch — lower-income household profile, screen leases tightly.
- Market conditions: 79 active listings in the ZIP; 27 comparable units currently listed for rent nearby; rentals lingering (median 44d on market — plan ~5-8 weeks vacancy on turnover, expect pricing pressure); 52% of comp listings sitting > 30 days — soft ceiling on asking rent; lower-income renter base — watch delinquency; 343 units permitted in Jefferson County in 2024 (0 in 5+ unit buildings).
- At $1,232/mo this rent would consume 46% of the median local household income ($32k/yr) (locally 657% of renters already pay >50% of income on rent) — very limited rent-growth headroom before tenants either downsize or default.
Forward outlook
- In year one you build about $6k of equity ($674 loan paydown + $5k appreciation (5.4% local appreciation)).
- At projected returns (5.4% appreciation + 3.0% rent growth), your $27k cash investment doubles in ~3 years — after that, you're playing with house money.
- By year 6, paydown + projected appreciation supports a ~$32k cash-out refi (75% LTV) — recoverable capital for the next deal without selling this one.
Negotiation context
- It's been on market 105 days — a 9% lower offer ($89k) is reasonable based on typical stale-listing flexibility.
- 5 sale attempts since 3y ago with the ask held roughly flat each time — persistent listings suggest the price (not the market) is what's stuck; bring a comps-based counter.
Risks & watch-outs
- Watch-outs: built in 1955 — expect roof / HVAC / electrical / plumbing capex.
- Climate carrying-cost: severe wind risk, 99% chance of damaging wind over 30y; extreme-heat days projected 7→24/yr by 2055 (HVAC capex compounding) — expect insurance premiums to compound above CPI over the hold.
Questions for the listing agent
- It's been on market 105 days. Have you received any prior offers? Is the seller open to a 9% concession, seller financing, or rate buy-down credit?
- Built in 1955 — when were the roof, HVAC, electrical panel, plumbing, and water heater last replaced?
- Why hasn't it sold? Are there any deal-killer items the seller is aware of (foundation, flood, title, zoning, code violations)?
- Is there a deadline driving the sale (1031 exchange, divorce, estate, relocation)? That informs how much negotiation room exists.
- Schools are D-rated, which usually means shorter tenancies and higher turnover. Who's the typical renter profile here, and what's been the actual vacancy rate?
- Crime grade is F in this area — have there been break-ins, vandalism, or insurance claims at this property in the last 3 years? What carrier currently insures it and at what premium?
- What's the average days-on-market for RENTAL listings here right now (not sales)? A rising rental-DOM trend means longer vacancies and softer asking-rent achievability than the comps imply.
- What's the recent tenant-quality profile in this submarket — average credit score on applications, eviction rate, late-payment / NSF rate, and stable-employment percentage? A property-management company in the area should have these aggregated.
- How much new for-sale + rental construction is in the pipeline within 1–3 miles? Heavy new supply typically softens prices + rents 12–24 months out; constrained supply supports both.
Investment metrics
- 1% rule
- 1.26% ✓
- Cap rate
- 9.89%
- Cash-on-cash
- 12.84%
- DSCR
- 1.57
- GRM
- 6.6
CMA / ARV
- ARV (median comp)
- $95,867
- List price
- $97,500
- Delta
- 1.70%
- Verdict
- FAIR
- Comps
- 20 within 1.0 mi
Show comp detail 7 sales within ~0.75 mi
| Address | Dist | Beds/Ba | Sqft | Sold | Price | $/sf | Match |
|---|---|---|---|---|---|---|---|
| 4045 Dallas Ave | 0.57mi | 3/1.0 | 1,083 (+3%) | 16mo | $49,999 | $46 | 54 |
| 4466 Singleton Rd | 0.69mi | 2/1.0 (-1) | 1,080 (+3%) | 5mo | $95,000 | $88 | 54 |
| 4335 Dallas St | 0.42mi | 3/1.0 | 1,200 (+14%) | 4mo | $55,000 | $46 | 54 |
| 5220 Allen Dr | 0.58mi | 3/1.0 | 1,140 (+9%) | 11mo | $169,500 | $149 | 50 |
| 2435 Fillmore St | 0.71mi | 3/1.0 | 976 (-7%) | 16mo | $75,000 | $77 | 42 |
| 4295 Harding Dr | 0.45mi | 3/1.0 | 1,190 (+13%) | 18mo | $69,000 | $58 | 42 |
| 3975 Steelton St | 0.75mi | 3/1.0 | 908 (-13%) | 14mo | $99,900 | $110 | 31 |
Match score weights: distance 35% · size 25% · config 20% · recency 20%. Top-matched comps best support the ARV.
Projected returns pro-forma
5.43% appreciation · 3.0% rent growth · sell at horizon
- IRR
- 24.9%
- Equity multiple
- 2.59×
- Total profit
- $43,533
- Equity at exit
- $57,848
- IRR
- 23.8%
- Equity multiple
- 5.19×
- Total profit
- $114,504
- Equity at exit
- $102,052
Cash invested: $27,300 (down + closing). Projections, not guarantees.
Landlord ↔ Tenant lean methodology
- Overall (STATE)
- 87 Strongly Landlord-Friendly
- State Texas
- 87 Strongly Landlord-Friendly · R+5
- County
- — inherits STATE
- City
- — inherits STATE
ZIP-level market 77703
- Home prices YoY
- 3.7%
- Active inventory
- 79
- Price-to-rent
- 6.6×
Monthly cashflow live
- Estimated rent
- $1,232 high interval (Pro) →
- Mortgage (P&I)
- −$511
- Tax from tax record
- −$129 /mo · $1,552/yr
- Insurance
- −$41
- HOA
- −$0
- Vacancy / Maint / Mgmt
- −$259
- Net cashflow
- $292
Break-even live
UW: 25.0% down · 7.5% · 30yr · 1.5% tax · 5.0% vac · 8.0% maint · 8.0% mgmt
Financing live
Cash to close
- Down payment
- $24,375
- Closing costs
- $2,925
- Reserves months
- —
- Total cash needed
- —
Loan-product check · same deal, 3 products live
Conventional
25% down · 7.5% · 30yr
- Down + closing
- —
- Monthly P&I
- —
- Monthly cashflow
- —
- DSCR
- —
- Eligible?
- —
Personal DTI + credit; lowest rate.
DSCR
20% down · 8.5% · 30yr
- Down + closing
- —
- Monthly P&I
- —
- Monthly cashflow
- —
- DSCR
- —
- Eligible?
- —
No personal income docs; deal must DSCR.
Hard money
10% down · 12.0% · 12mo
- Down + closing
- —
- Monthly P&I
- —
- Monthly cashflow
- —
- DSCR
- —
- Eligible?
- —
Short-term bridge; refi at stabilization.
Rent comps 27 comps
| Address | Beds | Baths | Sqft | Rent | $/sqft | DOM | Units | Dist |
|---|---|---|---|---|---|---|---|---|
| 5080 Helbig Rd Beaumont, TX | 2.0–3.0 | 1.0 | 775 | $750 | $0.97 | 13d | 1 | 0.22mi |
| 5070 Wilshire St Beaumont, TX | 2.0 | 1.0 | 1042 | $1,295 | $1.24 | 13d | 1 | 0.31mi |
| 3910 Baldwin St Beaumont, TX | 3.0 | 1.0 | 1220 | $1,200 | $0.98 | 23d | 1 | 0.33mi |
| 4565 Detroit St Beaumont, TX | 2.0 | 1.0 | 880 | $995 | $1.13 | 44d | 1 | 0.43mi |
| 3255 Charles St Beaumont, TX | 3.0 | 1.0 | 1396 | $1,350 | $0.97 | 43d | 1 | 0.44mi |
| 4325 Woodlawn St Beaumont, TX | 2.0 | 1.0 | 1150 | $1,000 | $0.87 | 13d | 1 | 0.47mi |
| 5340 Bettes Ln Beaumont, TX | 3.0 | 1.5 | 1496 | $1,575 | $1.05 | 43d | 1 | 0.64mi |
| 2550 Pierce St Beaumont, TX | 2.0 | 1.0 | 1044 | $1,050 | $1.01 | 43d | 1 | 0.67mi |
| 2530 Pierce St Beaumont, TX | 2.0 | 1.0 | 950 | $1,000 | $1.05 | 43d | 1 | 0.68mi |
| 2555 Pierce St Beaumont, TX | 3.0 | 2.0 | 1364 | $1,450 | $1.06 | 23d | 1 | 0.68mi |
| 2420 Wilson St Beaumont, TX | 2.0 | 1.0 | 840 | $1,200 | $1.43 | 43d | 1 | 0.70mi |
| 5680 Shivers Dr Beaumont, TX | 3.0 | 1.0 | 1442 | $1,500 | $1.04 | 23d | 1 | 0.74mi |
| 2450 N Lynwood Dr Beaumont, TX | 3.0 | 1.0 | 1015 | $1,175 | $1.16 | 23d | 1 | 0.78mi |
| 3155 French Rd Beaumont, TX | 1.0–3.0 | 1.0–2.0 | 905 | $999 | $1.10 | 13d | 9 | 0.92mi |
| 2270 Johnson St Beaumont, TX | 2.0 | 1.0 | 700 | $800 | $1.14 | 23d | 1 | 0.97mi |
| 3910 Treadway Rd Beaumont, TX | 2.0–3.0 | 1.0–1.5 | 1019 | $1,849 | $1.81 | 13d | 10 | 1.02mi |
| 2575 Primrose St Unit 3 Beaumont, TX | 2.0 | 1.0 | 800 | $900 | $1.12 | 23d | 1 | 1.05mi |
| 2995 Wier Dr Beaumont, TX | 3.0 | 2.0 | 1446 | $1,800 | $1.24 | 13d | 1 | 1.12mi |
| 4695 Collier St #8 Beaumont, TX | 2.0 | 1.5 | 1121 | $1,150 | $1.03 | 43d | 1 | 1.15mi |
| 4636 Collier St Beaumont, TX | 2.0 | 1.0 | 969 | $1,030 | $1.06 | 43d | 1 | 1.21mi |
| 3270 Christopher St Beaumont, TX | 4.0 | 2.0 | 1208 | $1,290 | $1.07 | 43d | 1 | 1.26mi |
| 2125 Earl St Beaumont, TX | 2.0 | 1.0 | 785 | $900 | $1.15 | 23d | 1 | 1.27mi |
| 2125 Earl St Beaumont, TX | 2.0 | 1.0 | 785 | $995 | $1.27 | 43d | 1 | 1.27mi |
| 3995 Crow Rd Unit 201 Beaumont, TX | 2.0 | 2.0 | 1162 | $1,550 | $1.33 | 43d | 1 | 1.28mi |
| 3925 Crow Rd Unit 49 Beaumont, TX | 2.0 | 1.5 | 1306 | $1,325 | $1.01 | 43d | 1 | 1.32mi |
| 3825 Hyde Park Row Beaumont, TX | 3.0 | 2.0 | 1271 | $1,550 | $1.22 | 43d | 1 | 1.49mi |
| 6161 Sienna TRL Beaumont, TX | 2.0 | 2.0 | 1003 | $1,129 | $1.13 | 43d | 1 | 1.49mi |
Listing history 25 events
-
2026-06-18days on market $97,500 Active 105 DOM
-
2026-06-17days on market $97,500 Active 104 DOM
-
2026-06-16days on market $97,500 Active 103 DOM
-
2026-06-15days on market $97,500 Active 102 DOM
-
2026-06-14days on market $97,500 Active 100 DOM
-
2026-06-13days on market $97,500 Active 99 DOM
-
2026-06-10days on market $97,500 Active 97 DOM
-
2026-06-09days on market $97,500 Active 96 DOM
-
2026-06-08days on market $97,500 Active 95 DOM
-
2026-06-07days on market $97,500 Active 94 DOM
-
2026-06-03days on market $97,500 Active 90 DOM
-
2026-06-02days on market $97,500 Active 89 DOM
-
2026-06-01days on market $97,500 Active 88 DOM
-
2026-05-31days on market $97,500 Active 87 DOM
-
2026-05-30days on market $97,500 Active 86 DOM
-
2026-03-05$97,500 Active 620-char remark
Show marketing remark (620 chars)
For sale in Beaumont, this inviting three-bedroom, one-bath home offers comfort, practicality, and great everyday living. Inside, you’ll find carpet flooring throughout the living room and bedrooms, with linoleum flooring in the kitchen and bathroom for easy maintenance. The spacious living room provides plenty of room to gather and relax, plus a convenient storage closet for added functionality. Just off the kitchen, a dedicated utility room includes electric washer and dryer connections, making this home as practical as it is welcoming. A great opportunity for buyers looking for a cozy place to call home.
-
2024-12-21historical $875
-
2024-12-18$875
-
2024-12-18historical $925
-
2024-10-30price $925
-
2024-10-10$995
-
2024-05-23historical $995
-
2024-05-08$995
-
2023-09-09historical $900
-
2023-08-31$900
ⓘ Source: listings_history table (triggers on properties + properties_extension) + one-shot
backfill from property_details.listing_events for pre-trigger history.
Tax reassessment forecast TX · Resets to sale price
- Current annual tax
- $1,552 · $129/mo
- Projected year-2 tax
- $1,784 · $149/mo
- Expected delta
- +$232/yr (+$19/mo · 14.9%)
ⓘ Screening estimate from a state-policy table — verify with the county assessor before closing.
Climate risk First Street
- Flood 3/10 Moderate FEMA zone X · 20% chance over 30 yrs
- Wildfire 3/10 Moderate
- Heat 9/10 Extreme 7 d/yr ≥109°F today · 24 d/yr by 30 yrs out
- Wind 9/10 Extreme 99% chance of damaging wind over 30 yrs
- Air quality 2/10 Low 1 unhealthy d/yr today · 1 by 30 yrs out
Nearby sold comps map
Loading sold comps map…
Walkable amenities ~0.75 mi
Loading nearby amenities…
Taxation est. · year 1
- Rental income
- $14,784
- − Mortgage interest
- −$5,462
- − Property taxes
- −$1,552
- − Insurance
- −$488
- − Repairs & maintenance
- −$1,183
- − Management
- −$1,183
- − Depreciation
- −$2,836
- Taxable income
- $2,081
- Est. tax owed @ 24.0%
- −$499
- After-tax cash flow
- $3,005/yr
For passive investors: Depreciation is non-cash, so a rental often shows a tax loss while cash-flowing — sheltering income. Rental losses are passive: they offset passive income freely, and up to $25,000/yr can offset ordinary (W-2) income if you actively participate and your MAGI is under $100k (phasing out to $0 by $150k); unused losses carry forward. On sale, claimed depreciation is recaptured at up to 25%, and gains may owe capital-gains tax (a 1031 exchange can defer both). Figures are a year-1 estimate at your 24.0% rate — not tax advice; consult a CPA.
Schools (NCES district)
- District
- Beaumont ISD
- NCES district ID
- 4809670
- Math proficiency
- 14% ▼ -13.00%
- Reading proficiency
- 22% ▼ -7.00%
- Median HH income
- $41,683
- Composite
- 15.43/100
- National rank
- #9316
- State rank
- #789 of 826 in TX
Livability — Beaumont
- Score
- 64/100
- State rank
- #739
- US rank
- #13710
Category grades
Schools grade is shown separately in the Schools card above.
Census & demographics
- Census place
- Beaumont, TX
- County
- Jefferson County · 203,592 people
- City population
- 125,901
- Metro
- Beaumont-Port Arthur, TX
- Population (ZIP)
- 11,004
- Household income
- $31,803
- Rent vs Own
- Severe rent burden
- 657.0
Population outlook (Jefferson County) Hauer SSP2
- Today (2025)
- 259,015 people
- By 2030
- 260,685 · +0.6%
- By 2040
- 263,309 · +1.7%
- By 2050
- 265,237 · +2.4%
- By 2075
- 270,193 · +4.3%
- By 2100
- 255,628 · -1.3%
Race, ethnicity, and origin ACS 2023
- Neighborhood character
- Majority Black (60%)
- Race & ethnicity
- Black 60% Hispanic / Latino 31% Two or more races 7% White 5%
- Hispanic origin (detail)
- Mexican 25%
- Common ancestry
- Serbian 1%
- Foreign-born
- 13% · Canada
- Languages at home
- 70% English-only · Spanish 29% French/Haitian/Cajun 1%
Political lean MEDSL · Jefferson
- 2024 margin
- Lean R (+8.9) · D 45.1% · R 54.0%
- 2008→2024 swing
- -11.1pp toward R · 2008: 2.2pp · 2024: -8.9pp
- All cycles
- 2024: R+8.9 2020: R+1.6 2016: R+0.5 2012: D+1.6 2008: D+2.2
Not yet ingested
- Civics
- —
Market trends
- HPI YoY
- ▲ 5.43%
- Current HPI
- 151.9888
- Rent YoY
- —
- Metro
- Beaumont-Port Arthur, TX
- State GDP YoY
- ▲ 3.95%
- F500 in state
- 110
Industry mix (Fortune 500 HQ in TX)
| Industry | F500 HQs | Revenue |
|---|---|---|
| Energy | 16 | $1,198B |
|
||
| Technology | 5 | $198B |
|
||
| Engineering / Construction | 4 | $72B |
|
||
| Energy Services | 3 | $60B |
|
||
| Utilities | 3 | $41B |
|
||
| Healthcare | 2 | $330B |
|
||
Price history
10 events — show timeline
- 2026-03-05 Listed $97,500 BBOR
- 2024-12-21 Rental Removed $875 APPFOLIO
- 2024-12-18 Listed for Rent $875 APPFOLIO
- 2024-12-18 Rental Removed $925 BBOR
- 2024-10-30 Price Changed $925 BBOR
- 2024-10-10 Listed for Rent $995 BBOR
- 2024-05-23 Rental Removed $995 BBOR
- 2024-05-08 Listed for Rent $995 BBOR
- 2023-09-09 Rental Removed $900 APPFOLIO
- 2023-08-31 Listed for Rent $900 APPFOLIO
Property tax history
+3.8%/yrLatest (2025): $1,552 · +5.9% YoY. Source: county tax records.
Cash-flow waterfall
monthlySold comps — $/sqft
last 12 mo · ≤1 miLoading sold comps…