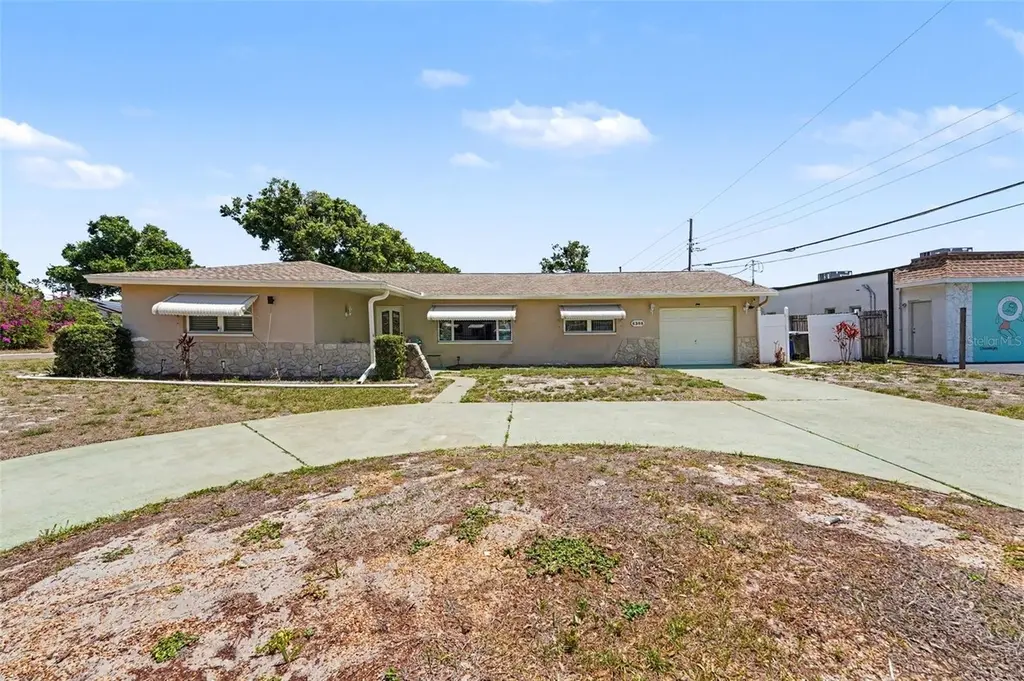
6388 21st Ave N · St. Petersburg, FL
Flood risk 1/10 · Minimal
- FEMA flood zone
- X (unshaded)
- Chance of flooding over 30 yrs
- 0.0%
- Est. flood insurance / yr
- $507 – $1,088
Fire risk 1/10 · Minimal
- Est. fire insurance / yr
- $947 – $1,759
Heat risk 10/10 · Severe
- Hot days now (above 106°F)
- 7 days/yr
- Hot days in 30 yrs
- 25 days/yr
Wind risk 10/10 · Severe
- Chance of severe wind over 30 yrs
- 99.0%
Air-quality risk 4/10 · Minor
- Unhealthy air days now
- 4 days/yr
- Unhealthy air days in 30 yrs
- 4 days/yr
Risk factors via First Street. Map © Google.
Why this score? — see what drove the C- grade
The composite is a weighted blend of 9 inputs, each scored 0–100. Each bar is that input's sub-score; the figure is the points it added to the 100-point composite (weight × sub-score).
- Cash flow +15.4/30.0
- ARV discount +15.0/15.0
- DSCR +4.7/10.0
- Schools +4.3/10.0
- 1% rule +3.1/10.0
- Livability +2.5/5.0
- Condition / age +2.5/5.0
- Rent growth +2.4/5.0
- Appreciation +0.0/10.0
$315,000
🖨 Deal sheet (PDF) 📄 Offer letter ✓ Due diligence
Listing remarks
Under contract-accepting backup offers. Charming Mid-Century Ranch in the Heart of St. Pete — Priced to Move at $315,000! Don't miss this rare opportunity to own a solid, move-in-ready concrete block home in one of St. Petersburg's most sought-after and accessible neighborhoods — priced well below the area median! This well-maintained 2-bedroom, 3-bathroom ranch-style home offers 1,621 sq ft of heated living space (2,050 total sq ft) with an outstanding layout that lives much larger than it looks. The sprawling, light-filled sunroom stretches over 31 feet and is perfect as a bonus living area, home office, hobby space, or entertainment room — the possibilities are tr
Key facts
- Pass-through bar
- Walk-in closet
- Light-filled sunroom
Tags
Property features AI
Finance
- Other: Furnished status negotiable
- Financial info: Homestead exempt; No lease restrictions indicated
- HOA & community: No association indicated
Exterior
- Parking: Attached garage with 1 garage space
- Utilities: Public water; Public sewer; Public utilities
- Home design: Single family residence; One story; Faces north; Residential property
- Construction: Block and stucco construction; Shingle roof; Slab foundation; Built on a 0.17-acre lot (approximately 75 x 100)
- Exterior features: French doors; Sidewalk; Storage
Interior
- Kitchen: Dishwasher; Disposal; Microwave; Range; Range hood; Refrigerator; Eat-in kitchen
- Bedrooms: 2 bedrooms
- Flooring: Carpet; Ceramic tile; Laminate
- Bathrooms: 3 full bathrooms
- Heating & cooling: Central heating; Central air conditioning
- Interior features: Ceiling fans; Eat-in kitchen; Living room/dining room combo; Open floorplan; Walk-in closet(s); Window treatments
- Laundry & utility: Laundry area in garage; Washer; Dryer; Electric water heater
Neighborhood map
What this means for you Summary
Snapshot
- This is a 2-bed/3.0-bath single-family listed at $315k.
Deal economics
- At list price, monthly cash flow is $124 ($1k/yr) — positive.
- The deal already cash-flows at list — no discount required.
- To meet the 1% rule (rent ≥ 1% of price), the offer needs to be $256k (18.7% below list).
- Recommended offer: $256k (18.7% below list) — sets the bar for 1% rule.
- Cap rate 6.8% vs local median 2.6% in St. Petersburg — top-decile yield for the area; either an underpriced asset or a hidden risk that comps aren't pricing in. Stress-test before assuming the spread holds.
Location & tenants
- Location reads: area grade C — affects rentability + tenant quality, not the cash-flow math above.
- Pinellas (suburban): math 51% / reading 51% proficiency, ranked #31 of 73 in FL (top 42%) — acceptable for families but not a draw, mixed tenant base, ~2y average lease.
- Zoned schools: Northwest Elementary School (math 56% / reading 50%, grade C, #963 of 2,144 statewide, top 45%, 477 students, 63% FRL); Tyrone Middle School (math 35% / reading 28%, grade F, #453 of 571 statewide, top 81%, 847 students, 68% FRL); Boca Ciega High School (math 24% / reading 33%, grade F, #458 of 667 statewide, top 69%, 1,423 students, 64% FRL) — zoned schools average 65% FRL vs 48% district-wide (17 pts higher); higher-poverty schools than district average — tighter screening recommended.
- Zoned-school proficiency averages 38% at this address vs 51% district-wide (-13 pts) — the specific schools serving this property underperform the Pinellas average; the district grade overstates school quality for this exact location.
- Market conditions: Rents soft (-0.5%/yr); 320 active listings in the ZIP; 18 comparable units currently listed for rent nearby; rentals at typical pace (median 19d on market — plan ~3-4 weeks tenant-placement turnaround); solid renter incomes; 2,676 units permitted in Pinellas County in 2024 (1,422 in 5+ unit buildings).
- This rent runs 39% of the median local income ($79k/yr) — at the standard rent-burdened threshold; future hikes will face affordability resistance.
Forward outlook
- Local home prices are declining (-3.0%/yr); year-one equity from $2k of loan paydown is wiped out by about $9k of value loss. Plan a longer hold.
- Pinellas County population projected at +14% by 2050 — modest demand growth; plan on rents tracking national, not racing it.
Negotiation context
- Only 4 days on market — expect competitive offers; lowballing is unlikely to land.
- 3 sale attempts since 19y ago with the ask held roughly flat each time — persistent listings suggest the price (not the market) is what's stuck; bring a comps-based counter.
- Current owner paid $75k; list at $315k implies a 320% gain — meaningful room to come down on a strong offer.
Risks & watch-outs
- Climate carrying-cost: severe wind risk, 99% chance of damaging wind over 30y; extreme-heat days projected 7→25/yr by 2055 (HVAC capex compounding) — expect insurance premiums to compound above CPI over the hold.
Questions for the listing agent
- Built in 1968 — when were the roof, HVAC, electrical panel, plumbing, and water heater last replaced?
- Is there a deadline driving the sale (1031 exchange, divorce, estate, relocation)? That informs how much negotiation room exists.
- What's the average days-on-market for RENTAL listings here right now (not sales)? A rising rental-DOM trend means longer vacancies and softer asking-rent achievability than the comps imply.
- What's the recent tenant-quality profile in this submarket — average credit score on applications, eviction rate, late-payment / NSF rate, and stable-employment percentage? A property-management company in the area should have these aggregated.
- How much new for-sale + rental construction is in the pipeline within 1–3 miles? Heavy new supply typically softens prices + rents 12–24 months out; constrained supply supports both.
Investment metrics
- 1% rule
- 0.81% ✗
- Cap rate
- 6.76%
- Cash-on-cash
- 1.68%
- DSCR
- 1.07
- GRM
- 10.3
CMA / ARV
- ARV (on-the-fly)
- $487,921
- Comps found
- 12
Show comp detail 12 sales within ~0.75 mi
| Address | Dist | Beds/Ba | Sqft | Sold | Price | $/sf | Match |
|---|---|---|---|---|---|---|---|
| 6388 21st Ave N | 0.00mi | 2/3.0 | 1,621 (0%) | 1mo | $325,000 | $200 | 100 |
| 2601 64th Way N | 0.36mi | 3/2.0 (+1) | 1,658 (+2%) | 7mo | $545,000 | $329 | 65 |
| 6441 27th Ave N | 0.41mi | 3/2.0 (+1) | 1,558 (-4%) | 6mo | $589,000 | $378 | 60 |
| 1349 Tyrone Blvd N | 0.47mi | 3/2.0 (+1) | 1,609 (-1%) | 12mo | $445,000 | $277 | 58 |
| 6415 13th Ave N | 0.39mi | 3/2.0 (+1) | 1,707 (+5%) | 12mo | $475,000 | $278 | 54 |
| 6688 30th Ave N | 0.66mi | 2/2.0 | 1,447 (-11%) | 1mo | $404,000 | $279 | 47 |
| 2671 66th Way N | 0.47mi | 3/2.0 (+1) | 1,475 (-9%) | 9mo | $475,000 | $322 | 47 |
| 6480 31st Ave N | 0.64mi | 3/2.0 (+1) | 1,742 (+8%) | 9mo | $699,000 | $401 | 41 |
| 6894 14th Ave N | 0.70mi | 3/2.0 (+1) | 1,728 (+7%) | 8mo | $450,000 | $260 | 41 |
| 6160 29th Ave N | 0.63mi | 3/2.0 (+1) | 1,517 (-6%) | 13mo | $400,000 | $264 | 40 |
| 2851 66th Way N | 0.56mi | 3/2.0 (+1) | 1,387 (-14%) | 13mo | $515,000 | $371 | 30 |
| 2854 60th St N | 0.70mi | 3/2.0 (+1) | 1,427 (-12%) | 11mo | $430,000 | $301 | 29 |
Match score weights: distance 35% · size 25% · config 20% · recency 20%. Top-matched comps best support the ARV.
Projected returns pro-forma
-3.0% appreciation · 0.0% rent growth · sell at horizon
- IRR
- -16.7%
- Equity multiple
- 0.42×
- Total profit
- $-50,807
- Equity at exit
- $46,968
- IRR
- -14.3%
- Equity multiple
- 0.28×
- Total profit
- $-63,639
- Equity at exit
- $27,235
Cash invested: $88,200 (down + closing). Projections, not guarantees.
Landlord ↔ Tenant lean methodology
- Overall (STATE)
- 87 Strongly Landlord-Friendly
- State Florida
- 87 Strongly Landlord-Friendly · R+3
- County
- — inherits STATE
- City
- — inherits STATE
ZIP-level market 33710
- Rents YoY
- -0.5%
- Active inventory
- 320
- Price-to-rent
- 10.3×
Monthly cashflow live
- Estimated rent
- $2,560 high interval (Pro) →
- Mortgage (P&I)
- −$1,652
- Tax from tax record
- −$116 /mo · $1,391/yr
- Insurance
- −$131
- HOA
- −$0
- Vacancy / Maint / Mgmt
- −$538
- Net cashflow
- $124
Break-even live
Sensitivity live
| Price | -10% $302 | -5% $213 | +0% $124 | +5% $34 | +10% $-55 |
|---|---|---|---|---|---|
| Rent | -10% $-79 | -5% $22 | +0% $124 | +5% $225 | +10% $326 |
| Rate | -1.0pp $282 | -0.5pp $204 | base $124 | +0.5pp $42 | +1.0pp $-41 |
UW: 25.0% down · 7.5% · 30yr · 1.5% tax · 5.0% vac · 8.0% maint · 8.0% mgmt
Financing live
Cash to close
- Down payment
- $78,750
- Closing costs
- $9,450
- Reserves months
- —
- Total cash needed
- —
Loan-product check · same deal, 3 products live
Conventional
25% down · 7.5% · 30yr
- Down + closing
- —
- Monthly P&I
- —
- Monthly cashflow
- —
- DSCR
- —
- Eligible?
- —
Personal DTI + credit; lowest rate.
DSCR
20% down · 8.5% · 30yr
- Down + closing
- —
- Monthly P&I
- —
- Monthly cashflow
- —
- DSCR
- —
- Eligible?
- —
No personal income docs; deal must DSCR.
Hard money
10% down · 12.0% · 12mo
- Down + closing
- —
- Monthly P&I
- —
- Monthly cashflow
- —
- DSCR
- —
- Eligible?
- —
Short-term bridge; refi at stabilization.
Rent comps 18 comps
| Address | Beds | Baths | Sqft | Rent | $/sqft | DOM | Units | Dist |
|---|---|---|---|---|---|---|---|---|
| 1699 68th St N Saint Petersburg, FL | 3.0 | 1.0–2.0 | 775 | $1,985 | $2.56 | 0d | 43 | 0.49mi |
| 2176 Winchester Rd N #2 Saint Petersburg, FL | 3.0 | 2.0 | 1080 | $2,250 | $2.08 | 16d | 1 | 0.61mi |
| 2871 67th St N Saint Petersburg, FL | 3.0 | 1.0 | 1075 | $2,500 | $2.33 | 26d | 1 | 0.61mi |
| 6960 20th Ave N #501 St Petersburg, FL | 2.0 | 2.0 | 1150 | $1,995 | $1.73 | 26d | 1 | 0.61mi |
| 5900 22nd Ave N Unit 1 St. Petersburg, FL | 3.0 | 2.0 | 1100 | $1,999 | $1.82 | 19d | 1 | 0.72mi |
| 5900 22nd Ave N Saint Petersburg, FL | 3.0 | 1.0 | 1100 | $1,950 | $1.77 | 6d | 1 | 0.72mi |
| 2901 70th St N Unit 1546478P St. Petersburg, FL | 3.0 | 2.0 | 1614 | $4,682 | $2.90 | 18d | 1 | 0.76mi |
| 1308 70th St N Unit 1308 St. Petersburg, FL | 2.0 | 1.5 | 1100 | $2,500 | $2.27 | 26d | 1 | 0.77mi |
| 6348 7th Ave N St Petersburg, FL | 3.0 | 1.5 | 1637 | $2,800 | $1.71 | 26d | 1 | 0.79mi |
| 2153 75th Way N Saint Petersburg, FL | 3.0 | 2.0 | 1410 | $3,500 | $2.48 | 23d | 1 | 1.06mi |
| 1790 Russell Dr N Saint Petersburg, FL | 3.0 | 2.0 | 1277 | $2,800 | $2.19 | 6d | 1 | 1.10mi |
| 5919 4th Ave N Saint Petersburg, FL | 2.0 | 1.0 | 1053 | $2,650 | $2.52 | 6d | 1 | 1.16mi |
| 7600 16th Ave N Saint Petersburg, FL | 2.0 | 1.0 | 1243 | $2,200 | $1.77 | 13d | 1 | 1.17mi |
| 441 57th St N Saint Petersburg, FL | 2.0 | 1.0 | 1160 | $1,950 | $1.68 | 4d | 1 | 1.28mi |
| 3300 55th St N Saint Petersburg, FL | 3.0 | 2.0 | 1677 | $3,011 | $1.80 | 23d | 1 | 1.30mi |
| 5145 17th Ave N Saint Petersburg, FL | 3.0 | 2.0 | 1242 | $2,875 | $2.31 | 0d | 1 | 1.31mi |
| 5200 26th Ave N St Petersburg, FL | 3.0 | 2.0 | 1755 | $4,500 | $2.56 | 26d | 1 | 1.31mi |
| 5318 9th Ave N Saint Petersburg, FL | 3.0 | 2.0 | 1142 | $2,600 | $2.28 | 6d | 1 | 1.34mi |
Listing history 9 events
-
2026-05-04status Pending
-
2026-04-30$315,000 Active
-
2025-07-15historical
-
2025-05-03price $419,500
-
2025-03-04price $429,500
-
2025-01-28price $439,500
-
2025-01-15$449,500 Active
-
2007-05-17$259,900
-
1998-02-06soldstatus $75,000
ⓘ Source: listings_history table (triggers on properties + properties_extension) + one-shot
backfill from property_details.listing_events for pre-trigger history.
Tax reassessment forecast FL · Resets to sale price
- Current annual tax
- $1,391 · $116/mo
- Projected year-2 tax
- $2,614 · $218/mo
- Expected delta
- +$1,223/yr (+$102/mo · 87.9%)
ⓘ Screening estimate from a state-policy table — verify with the county assessor before closing.
Climate risk First Street
- Flood 1/10 Low FEMA zone X (unshaded) · 0% chance over 30 yrs
- Wildfire 1/10 Low
- Heat 10/10 Extreme 7 d/yr ≥106°F today · 25 d/yr by 30 yrs out
- Wind 10/10 Extreme 99% chance of damaging wind over 30 yrs
- Air quality 4/10 Moderate 4 unhealthy d/yr today · 4 by 30 yrs out
Nearby sold comps map
Loading sold comps map…
Walkable amenities ~0.75 mi
Loading nearby amenities…
Taxation est. · year 1
- Rental income
- $30,724
- − Mortgage interest
- −$17,645
- − Property taxes
- −$1,391
- − Insurance
- −$1,575
- − Repairs & maintenance
- −$2,458
- − Management
- −$2,458
- − Depreciation
- −$9,164
- Taxable loss
- −$3,966
- Est. tax savings @ 24.0%
- +$952
- After-tax cash flow
- $2,435/yr
For passive investors: Depreciation is non-cash, so a rental often shows a tax loss while cash-flowing — sheltering income. Rental losses are passive: they offset passive income freely, and up to $25,000/yr can offset ordinary (W-2) income if you actively participate and your MAGI is under $100k (phasing out to $0 by $150k); unused losses carry forward. On sale, claimed depreciation is recaptured at up to 25%, and gains may owe capital-gains tax (a 1031 exchange can defer both). Figures are a year-1 estimate at your 24.0% rate — not tax advice; consult a CPA.
Schools (NCES district)
- District
- Pinellas
- NCES district ID
- 1201560
- Math proficiency
- 51% ▼ -5.00%
- Reading proficiency
- 51% ▼ -3.00%
- Median HH income
- $46,270
- Composite
- 43.27/100
- National rank
- #3046
- State rank
- #31 of 73 in FL
Livability — St. Petersburg
No livability data for this city. (Only ~50 U.S. cities are tracked.)
Census & demographics
- Census place
- St. Petersburg, FL
- County
- Pinellas County · 939,478 people
- City population
- 249,151
- Metro
- Tampa-St. Petersburg-Clearwater, FL
- Population (ZIP)
- 33,796
- Household income
- $78,611
- Rent vs Own
- Severe rent burden
- 542.0
Population outlook (Pinellas County) Hauer SSP2
- Today (2025)
- 1,027,532 people
- By 2030
- 1,063,586 · +3.5%
- By 2040
- 1,125,020 · +9.5%
- By 2050
- 1,168,637 · +13.7%
- By 2075
- 1,265,188 · +23.1%
- By 2100
- 1,260,357 · +22.7%
Race, ethnicity, and origin ACS 2023
- Neighborhood character
- Predominantly White (77%)
- Race & ethnicity
- White 77% Two or more races 10% Hispanic / Latino 9% Asian 5% Black 4%
- Hispanic origin (detail)
- Mexican 1% Puerto Rican 2% Cuban 2%
- Common ancestry
- Lithuanian 3% Romanian 3% Slovak 2%
- Foreign-born
- 12% · Canada, Vietnam, China
- Languages at home
- 85% English-only · Spanish 7% Other Indo-European 2% Russian/Polish/Slavic 2%
Political lean MEDSL · Pinellas
- 2024 margin
- Lean R (+5.2) · D 46.9% · R 52.1%
- 2008→2024 swing
- -13.5pp toward R · 2008: 8.3pp · 2024: -5.2pp
- All cycles
- 2024: R+5.2 2020: D+0.2 2016: R+1.1 2012: D+5.6 2008: D+8.3
Not yet ingested
- Civics
- —
Market trends
- HPI YoY
- ▼ -547.31%
- Current HPI
- 405.0731
- Rent YoY
- ▼ -0.48%
- Metro
- Tampa-St. Petersburg-Clearwater, FL
- State GDP YoY
- ▲ 3.28%
- F500 in state
- 36
Industry mix (Fortune 500 HQ in FL)
| Industry | F500 HQs | Revenue |
|---|---|---|
| Industrial Technology | 2 | $29B |
|
||
| Insurance | 2 | $17B |
|
||
| Retail | 1 | $60B |
|
||
| Technology Distribution | 1 | $58B |
|
||
| Homebuilding | 1 | $35B |
|
||
| Technology Manufacturing | 1 | $35B |
|
||
Price history
+320.0% since first listed9 events — show timeline
- 2026-05-04 Pending — Stellar MLS as Distributed by MLS Grid
- 2026-04-30 Listed $315,000 Stellar MLS as Distributed by MLS Grid
- 2025-07-15 Listing Removed — Stellar MLS as Distributed by MLS Grid
- 2025-05-03 Price Changed $419,500 Stellar MLS as Distributed by MLS Grid
- 2025-03-04 Price Changed $429,500 Stellar MLS as Distributed by MLS Grid
- 2025-01-28 Price Changed $439,500 Stellar MLS as Distributed by MLS Grid
- 2025-01-15 Listed $449,500 Stellar MLS as Distributed by MLS Grid
- 2007-05-17 Listed $259,900 Stellar MLS as Distributed by MLS Grid
- 1998-02-06 Sold (Public Records) $75,000 Public Records
Property tax history
-3.4%/yrLatest (2025): $1,391 · +7.4% YoY. Source: county tax records.
Cash-flow waterfall
monthlySold comps — $/sqft
last 12 mo · ≤1 miLoading sold comps…