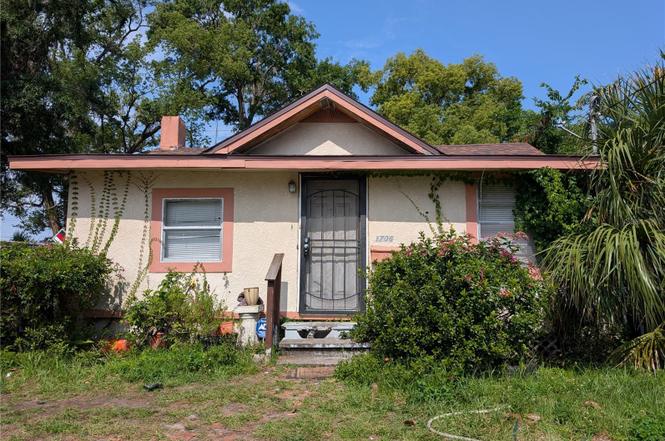
3706 N 36th St · Tampa, FL
Flood risk 1/10 · Minimal
- FEMA flood zone
- X (unshaded)
- Chance of flooding over 30 yrs
- 0.0%
- Est. flood insurance / yr
- $507 – $1,088
Fire risk 1/10 · Minimal
- Est. fire insurance / yr
- $947 – $1,759
Heat risk 10/10 · Severe
- Hot days now (above 108°F)
- 7 days/yr
- Hot days in 30 yrs
- 27 days/yr
Wind risk 9/10 · Severe
- Chance of severe wind over 30 yrs
- 99.0%
Air-quality risk 3/10 · Minor
- Unhealthy air days now
- 3 days/yr
- Unhealthy air days in 30 yrs
- 4 days/yr
Risk factors via First Street. Map © Google.
Why this score? — see what drove the C- grade
The composite is a weighted blend of 9 inputs, each scored 0–100. Each bar is that input's sub-score; the figure is the points it added to the 100-point composite (weight × sub-score).
- Cash flow +21.1/30.0
- ARV discount +7.5/15.0
- DSCR +6.7/10.0
- 1% rule +5.5/10.0
- Schools +4.2/10.0
- Livability +4.0/5.0
- Condition / age +2.5/5.0
- Rent growth +1.3/5.0
- Appreciation +0.0/10.0
$160,000
🖨 Deal sheet (PDF) 📄 Offer letter ✓ Due diligence
Listing remarks
Investor Special in the Heart of Downtown Tampa!~ 1926 Classic Fixer (a. k. a. Certified Junker) ~ 982 Sqft | 6,650 Sqft Lot | Prime Location! Looking for your next big project or tear-down treasure? Say hello to this charming 1926 relic that's got more history than function. She's seen better days—okay, she's seen way better decades—but she's standing strong(ish) in the heart of Tampa! The Details: Roof: 2017 / Electricity: Working / Water: Still flowing / Title: Clean / Structure: . .. maybe bring a contractor!! Located just walking distance to downtown Tampa and a hop, skip, and a pothole from I-4 and I-275, this is an unbeatable location with serious upside. Your Op
Key facts
- Clean title
- 6,650 sq ft lot
- Built 1926
Tags
Neighborhood map
What this means for you Summary
Snapshot
- This is a 2-bed/1.0-bath single-family listed at $160k.
Deal economics
- At list price, monthly cash flow is $228 ($3k/yr) — positive.
- The deal already cash-flows at list — no discount required.
- Meets the 1% rule at list price ($2k rent vs $160k).
- Recommended offer: $155k (3.0% below list) — sets the bar for market timing.
Location & tenants
- Location reads 79/100 on livability (#142 in FL, #2,135 nationally) — a middle-class / working-renter tenant base. Strengths: commute A+, housing A+, health & safety A+; Watch: schools C-, crime D+.
- Hillsborough (suburban): math 47% / reading 50% proficiency, ranked #41 of 73 in FL (top 56%) — families likely to look elsewhere, expect single-tenant / working-renter base with shorter leases.
- Market conditions: Rents falling (-4.7%/yr); 278 active listings in the ZIP; 40 comparable units currently listed for rent nearby; rentals at typical pace (median 21d on market — plan ~3-4 weeks tenant-placement turnaround); 9,053 units permitted in Hillsborough County in 2024 (4,555 in 5+ unit buildings).
- This rent runs 37% of the median local income ($54k/yr) — at the standard rent-burdened threshold; future hikes will face affordability resistance.
Forward outlook
- Local home prices are declining (-3.0%/yr); year-one equity from $1k of loan paydown is wiped out by about $5k of value loss. Plan a longer hold.
- Hillsborough County population projected at +37% by 2050 — long-run rental-demand tailwind backs the buy-and-hold thesis.
Negotiation context
- It's been on market 37 days — a 3% lower offer ($155k) is reasonable based on typical stale-listing flexibility.
- 7 sale attempts; this cycle's ask has dropped $15k (9%) from the opening price — seller is motivated, your offer sets the floor, not the list.
- Current owner paid $56k; list at $160k implies a 184% gain — meaningful room to come down on a strong offer.
Risks & watch-outs
- Watch-outs: built in 1926 — expect roof / HVAC / electrical / plumbing capex.
- Climate carrying-cost: severe wind risk, 99% chance of damaging wind over 30y; extreme-heat days projected 7→27/yr by 2055 (HVAC capex compounding) — expect insurance premiums to compound above CPI over the hold.
Questions for the listing agent
- It's been on market 37 days. Have you received any prior offers? Is the seller open to a 3% concession, seller financing, or rate buy-down credit?
- Built in 1926 — when were the roof, HVAC, electrical panel, plumbing, and water heater last replaced?
- Is there a deadline driving the sale (1031 exchange, divorce, estate, relocation)? That informs how much negotiation room exists.
- Crime grade is D in this area — have there been break-ins, vandalism, or insurance claims at this property in the last 3 years? What carrier currently insures it and at what premium?
- What's the average days-on-market for RENTAL listings here right now (not sales)? A rising rental-DOM trend means longer vacancies and softer asking-rent achievability than the comps imply.
- What's the recent tenant-quality profile in this submarket — average credit score on applications, eviction rate, late-payment / NSF rate, and stable-employment percentage? A property-management company in the area should have these aggregated.
- How much new for-sale + rental construction is in the pipeline within 1–3 miles? Heavy new supply typically softens prices + rents 12–24 months out; constrained supply supports both.
Investment metrics
- 1% rule
- 1.05% ✓
- Cap rate
- 8.01%
- Cash-on-cash
- 6.12%
- DSCR
- 1.27
- GRM
- 7.9
CMA / ARV
No comps found within radius.
Projected returns pro-forma
-3.0% appreciation · 0.0% rent growth · sell at horizon
- IRR
- -10.3%
- Equity multiple
- 0.64×
- Total profit
- $-16,292
- Equity at exit
- $23,857
- IRR
- -5.8%
- Equity multiple
- 0.68×
- Total profit
- $-14,433
- Equity at exit
- $13,834
Cash invested: $44,800 (down + closing). Projections, not guarantees.
Landlord ↔ Tenant lean methodology
- Overall (STATE)
- 87 Strongly Landlord-Friendly
- State Florida
- 87 Strongly Landlord-Friendly · R+3
- County
- — inherits STATE
- City
- — inherits STATE
ZIP-level market 33610
- Home prices YoY
- -27.0%
- Rents YoY
- -4.7%
- Active inventory
- 278
- Price-to-rent
- 7.9×
Monthly cashflow live
- Estimated rent
- $1,684 high interval (Pro) →
- Mortgage (P&I)
- −$839
- Tax from tax record
- −$196 /mo · $2,354/yr
- Insurance
- −$67
- HOA
- −$0
- Vacancy / Maint / Mgmt
- −$354
- Net cashflow
- $228
Break-even live
Sensitivity live
| Price | -10% $319 | -5% $274 | +0% $228 | +5% $183 | +10% $138 |
|---|---|---|---|---|---|
| Rent | -10% $95 | -5% $162 | +0% $228 | +5% $295 | +10% $361 |
| Rate | -1.0pp $309 | -0.5pp $269 | base $228 | +0.5pp $187 | +1.0pp $145 |
UW: 25.0% down · 7.5% · 30yr · 1.5% tax · 5.0% vac · 8.0% maint · 8.0% mgmt
Financing live
Cash to close
- Down payment
- $40,000
- Closing costs
- $4,800
- Reserves months
- —
- Total cash needed
- —
Loan-product check · same deal, 3 products live
Conventional
25% down · 7.5% · 30yr
- Down + closing
- —
- Monthly P&I
- —
- Monthly cashflow
- —
- DSCR
- —
- Eligible?
- —
Personal DTI + credit; lowest rate.
DSCR
20% down · 8.5% · 30yr
- Down + closing
- —
- Monthly P&I
- —
- Monthly cashflow
- —
- DSCR
- —
- Eligible?
- —
No personal income docs; deal must DSCR.
Hard money
10% down · 12.0% · 12mo
- Down + closing
- —
- Monthly P&I
- —
- Monthly cashflow
- —
- DSCR
- —
- Eligible?
- —
Short-term bridge; refi at stabilization.
Rent comps 40 comps
| Address | Beds | Baths | Sqft | Rent | $/sqft | DOM | Units | Dist |
|---|---|---|---|---|---|---|---|---|
| 3507 E 29th Ave Tampa, FL | 3.0 | 2.0 | 928 | $1,700 | $1.83 | 25d | 1 | 0.09mi |
| 3405 N 34th St Unit C Tampa, FL | 1.0 | 1.0 | 600 | $795 | $1.32 | 3d | 1 | 0.27mi |
| 3408 E Doctor Martin Luther King Junior Blvd Unit 5 Tampa, FL | 2.0 | 1.0 | 654 | $1,595 | $2.44 | 15d | 1 | 0.30mi |
| 3408 E Doctor Martin Luther King Junior Blvd Apt 3 Tampa, FL | 2.0 | 1.0 | 654 | $1,625 | $2.48 | 25d | 1 | 0.30mi |
| 3408 E Doctor Martin Luther King Junior Blvd Unit 8 Tampa, FL | 2.0 | 1.0 | 654 | $1,495 | $2.29 | 17d | 1 | 0.30mi |
| 3408 E Doctor Martin Luther King Junior Blvd Unit 4 Tampa, FL | 2.0 | 1.0 | 654 | $1,575 | $2.41 | 25d | 1 | 0.30mi |
| 3408 E Doctor Martin Luther King Junior Blvd Unit 8 Tampa, FL | 2.0 | 1.0 | 654 | $1,495 | $2.29 | 21d | 1 | 0.30mi |
| 3511 Bishop Eddie Newkirk Way Tampa, FL | 3.0 | 1.0 | 1056 | $1,800 | $1.70 | 25d | 1 | 0.34mi |
| 3511 Bishop Eddie Newkirk Way Tampa, FL | 3.0 | 1.0 | 1056 | $1,800 | $1.70 | 11d | 1 | 0.34mi |
| 3705 E North Bay St Tampa, FL | 3.0 | 2.0 | 969 | $1,850 | $1.91 | 4d | 1 | 0.34mi |
| 4204 N 29th St Tampa, FL | 3.0 | 1.0 | 957 | $1,800 | $1.88 | 25d | 1 | 0.62mi |
| 2704 E 25th Ave Tampa, FL | 3.0 | 1.0 | 858 | $1,595 | $1.86 | 22d | 1 | 0.65mi |
| 4506 N 42nd St Tampa, FL | 3.0 | 1.5 | 792 | $1,900 | $2.40 | 0d | 1 | 0.74mi |
| 3612 E Osborne Ave Unit A Tampa, FL | 2.0 | 1.0 | 576 | $1,600 | $2.78 | 25d | 1 | 0.76mi |
| 3101 E 18th Ave Tampa, FL | 3.0 | 1.0 | 1050 | $1,750 | $1.67 | 4d | 1 | 0.77mi |
| 2402 E Doctor Martin Luther King Junior Blvd Unit 4 Tampa, FL | 1.0 | 1.0 | 610 | $800 | $1.31 | 10d | 1 | 0.80mi |
| 2402 E Doctor Martin Luther King Junior Blvd Tampa, FL | 2.0 | 1.0 | 710 | $1,699 | $2.39 | 25d | 1 | 0.80mi |
| 2501 E Chelsea St Tampa, FL | 1.0 | 1.0 | 600 | $1,100 | $1.83 | 22d | 1 | 0.86mi |
| 2205 Chipco St Tampa, FL | 2.0 | 1.0 | 1100 | $1,600 | $1.45 | 25d | 1 | 0.89mi |
| 3910 E Ellicott St Tampa, FL | 2.0 | 1.0 | 950 | $1,800 | $1.89 | 25d | 1 | 0.93mi |
| 2925 N 46th St Unit B Tampa, FL | 2.0 | 1.0 | 1120 | $1,103 | $0.98 | 25d | 1 | 1.02mi |
| 2506 E Columbus Dr Tampa, FL | 2.0 | 1.0 | 796 | $1,950 | $2.45 | 17d | 1 | 1.03mi |
| 2407 E 17th Ave Tampa, FL | 3.0 | 2.0 | 810 | $1,650 | $2.04 | 25d | 1 | 1.07mi |
| 2407 E 17th Ave Apt A Tampa, FL | 3.0 | 2.0 | 810 | $1,595 | $1.97 | 11d | 1 | 1.07mi |
| 2407 E 17th Ave Unit B Tampa, FL | 3.0 | 2.0 | 810 | $1,650 | $2.04 | 18d | 1 | 1.07mi |
| 2407 E 17th Ave Tampa, FL | 3.0 | 2.0 | 810 | $1,650 | $2.04 | 22d | 1 | 1.07mi |
| 2407 E 17th Ave Apt A Tampa, FL | 3.0 | 2.0 | 810 | $1,650 | $2.04 | 15d | 1 | 1.07mi |
| 2407 E 17th Ave Tampa, FL | 3.0 | 2.0 | 810 | $1,595 | $1.97 | 0d | 1 | 1.07mi |
| 3001 E McBerry St Tampa, FL | 3.0 | 2.0 | 1118 | $1,945 | $1.74 | 5d | 1 | 1.10mi |
| 3706 E Shadowlawn Ave Tampa, FL | 3.0 | 1.0 | 1080 | $1,950 | $1.81 | 10d | 1 | 1.12mi |
| 2308 E 15th Ave Tampa, FL | 3.0 | 1.0 | 936 | $1,895 | $2.02 | 15d | 1 | 1.14mi |
| 3212 N 50th St Unit B Tampa, FL | 3.0 | 2.0 | 1005 | $2,200 | $2.19 | 15d | 1 | 1.14mi |
| 3417 Temple St Unit B Tampa, FL | 3.0 | 2.0 | 975 | $1,600 | $1.64 | 25d | 1 | 1.19mi |
| 2104 E Columbus Dr Unit 301 Tampa, FL | 3.0 | 2.0 | 1083 | $2,050 | $1.89 | 25d | 1 | 1.20mi |
| 1605 E 29th Ave Tampa, FL | 3.0 | 1.0 | 870 | $1,800 | $2.07 | 21d | 1 | 1.25mi |
| 2006 E Columbus Dr Unit A Tampa, FL | 2.0 | 1.0 | 896 | $1,495 | $1.67 | 2d | 1 | 1.26mi |
| 4811 E Curtis St Tampa, FL | 1.0 | 1.0 | 891 | $797 | $0.89 | 25d | 1 | 1.26mi |
| 1709 E Chelsea St Unit F Tampa, FL | 2.0 | 1.0 | 1041 | $1,625 | $1.56 | 24d | 1 | 1.27mi |
| 3625 E Mohawk Ave Tampa, FL | 1.0 | 1.0 | 1110 | $1,750 | $1.58 | 15d | 1 | 1.29mi |
| 1515 E 31st Ave Tampa, FL | 2.0 | 1.0 | 914 | $1,500 | $1.64 | 5d | 1 | 1.33mi |
Listing history 16 events
-
2025-11-19status Pending
-
2025-11-19status Active
-
2025-11-15status Pending
-
2025-11-12status Active
-
2025-11-06status Pending
-
2025-10-29price $160,000
-
2025-10-20status Active
-
2025-10-20status Active
-
2025-10-13status Pending
-
2025-10-04status Active
-
2025-09-29status Pending
-
2025-09-25status Active
-
2025-05-26status Pending
-
2025-05-22$175,000 Active
-
2005-12-30soldstatus $56,400
-
1996-11-25soldstatus $12,000
ⓘ Source: listings_history table (triggers on properties + properties_extension) + one-shot
backfill from property_details.listing_events for pre-trigger history.
Tax reassessment forecast FL · Resets to sale price
- Current annual tax
- $2,354 · $196/mo
- Projected year-2 tax
- $2,354 · $196/mo
- Expected delta
- $0/yr ($0/mo · 0.0%)
ⓘ Screening estimate from a state-policy table — verify with the county assessor before closing.
Climate risk First Street
- Flood 1/10 Low FEMA zone X (unshaded) · 0% chance over 30 yrs
- Wildfire 1/10 Low
- Heat 10/10 Extreme 7 d/yr ≥108°F today · 27 d/yr by 30 yrs out
- Wind 9/10 Extreme 99% chance of damaging wind over 30 yrs
- Air quality 3/10 Moderate 3 unhealthy d/yr today · 4 by 30 yrs out
Nearby sold comps map
Loading sold comps map…
Walkable amenities ~0.75 mi
Loading nearby amenities…
Taxation est. · year 1
- Rental income
- $20,207
- − Mortgage interest
- −$8,962
- − Property taxes
- −$2,354
- − Insurance
- −$800
- − Repairs & maintenance
- −$1,617
- − Management
- −$1,617
- − Depreciation
- −$4,655
- Taxable income
- $203
- Est. tax owed @ 24.0%
- −$49
- After-tax cash flow
- $2,692/yr
For passive investors: Depreciation is non-cash, so a rental often shows a tax loss while cash-flowing — sheltering income. Rental losses are passive: they offset passive income freely, and up to $25,000/yr can offset ordinary (W-2) income if you actively participate and your MAGI is under $100k (phasing out to $0 by $150k); unused losses carry forward. On sale, claimed depreciation is recaptured at up to 25%, and gains may owe capital-gains tax (a 1031 exchange can defer both). Figures are a year-1 estimate at your 24.0% rate — not tax advice; consult a CPA.
Schools (NCES district)
- District
- Hillsborough
- NCES district ID
- 1200870
- Math proficiency
- 47% ▼ -8.00%
- Reading proficiency
- 50% ▼ -4.00%
- Median HH income
- $50,622
- Composite
- 41.6/100
- National rank
- #3435
- State rank
- #41 of 73 in FL
Livability — Tampa
- Score
- 79/100
- State rank
- #142
- US rank
- #2135
Category grades
Schools grade is shown separately in the Schools card above.
Census & demographics
- Census place
- Tampa, FL
- County
- Hillsborough County · 1,540,968 people
- City population
- 523,346
- Metro
- Tampa-St. Petersburg-Clearwater, FL
- Population (ZIP)
- 46,587
- Household income
- $54,209
- Rent vs Own
- Severe rent burden
- 2431.0
Population outlook (Hillsborough County) Hauer SSP2
- Today (2025)
- 1,607,022 people
- By 2030
- 1,733,968 · +7.9%
- By 2040
- 1,979,565 · +23.2%
- By 2050
- 2,203,427 · +37.1%
- By 2075
- 2,667,893 · +66.0%
- By 2100
- 2,891,558 · +79.9%
Race, ethnicity, and origin ACS 2023
- Neighborhood character
- Diverse neighborhood (Simpson 0.62)
- Race & ethnicity
- Black 55% Hispanic / Latino 22% White 17% Two or more races 13% Asian 3%
- Hispanic origin (detail)
- Mexican 3% Puerto Rican 7% Cuban 6%
- Common ancestry
- Hispanic 2% Romanian 1% Slovak 1%
- Foreign-born
- 18% · Canada
- Languages at home
- 75% English-only · Spanish 18% French/Haitian/Cajun 3% Other Asian/Pacific 1%
Political lean MEDSL · Hillsborough
- 2024 margin
- Toss-up / Even · D 47.8% · R 50.9% · Other 1.3%
- 2008→2024 swing
- -10.2pp toward R · 2008: 7.1pp · 2024: -3.1pp
- All cycles
- 2024: R+3.1 2020: D+6.9 2016: D+6.8 2012: D+6.7 2008: D+7.1
Not yet ingested
- Civics
- —
Market trends
- HPI YoY
- ▼ -158.81%
- Current HPI
- 428.9741
- Rent YoY
- ▼ -4.72%
- Metro
- Tampa-St. Petersburg-Clearwater, FL
- State GDP YoY
- ▲ 3.28%
- F500 in state
- 36
Industry mix (Fortune 500 HQ in FL)
| Industry | F500 HQs | Revenue |
|---|---|---|
| Industrial Technology | 2 | $29B |
|
||
| Insurance | 2 | $17B |
|
||
| Retail | 1 | $60B |
|
||
| Technology Distribution | 1 | $58B |
|
||
| Homebuilding | 1 | $35B |
|
||
| Technology Manufacturing | 1 | $35B |
|
||
Price history
+1233.3% since first listed16 events — show timeline
- 2025-11-19 Pending — Stellar MLS as Distributed by MLS Grid
- 2025-11-19 Relisted — Stellar MLS as Distributed by MLS Grid
- 2025-11-15 Pending — Stellar MLS as Distributed by MLS Grid
- 2025-11-12 Relisted — Stellar MLS as Distributed by MLS Grid
- 2025-11-06 Pending — Stellar MLS as Distributed by MLS Grid
- 2025-10-29 Price Changed $160,000 Stellar MLS as Distributed by MLS Grid
- 2025-10-20 Relisted — Stellar MLS as Distributed by MLS Grid
- 2025-10-20 Relisted — Stellar MLS as Distributed by MLS Grid
- 2025-10-13 Pending — Stellar MLS as Distributed by MLS Grid
- 2025-10-04 Relisted — Stellar MLS as Distributed by MLS Grid
- 2025-09-29 Pending — Stellar MLS as Distributed by MLS Grid
- 2025-09-25 Relisted — Stellar MLS as Distributed by MLS Grid
- 2025-05-26 Pending — Stellar MLS as Distributed by MLS Grid
- 2025-05-22 Listed $175,000 Stellar MLS as Distributed by MLS Grid
- 2005-12-30 Sold (Public Records) $56,400 Public Records
- 1996-11-25 Sold (Public Records) $12,000 Public Records
Property tax history
+43.3%/yrLatest (2025): $2,354 · +11.5% YoY. Source: county tax records.
Cash-flow waterfall
monthlySold comps — $/sqft
last 12 mo · ≤1 miLoading sold comps…