426 61st St NE · Washington, DC
Flood risk 1/10 · Minimal
- FEMA flood zone
- X (unshaded)
- Chance of flooding over 30 yrs
- 0.0%
- Est. flood insurance / yr
- $473 – $860
Fire risk 1/10 · Minimal
- Est. fire insurance / yr
- $631 – $1,173
Heat risk 8/10 · Major
- Hot days now (above 103°F)
- 7 days/yr
- Hot days in 30 yrs
- 15 days/yr
Wind risk 4/10 · Minor
- Chance of severe wind over 30 yrs
- 21.0%
Air-quality risk 4/10 · Minor
- Unhealthy air days now
- 4 days/yr
- Unhealthy air days in 30 yrs
- 5 days/yr
Risk factors via First Street. Map © Google.
Why this score? — see what drove the B- grade
The composite is a weighted blend of 9 inputs, each scored 0–100. Each bar is that input's sub-score; the figure is the points it added to the 100-point composite (weight × sub-score).
- Cash flow +24.9/30.0
- ARV discount +15.0/15.0
- DSCR +8.1/10.0
- 1% rule +6.3/10.0
- Rent growth +4.0/5.0
- Livability +3.7/5.0
- Schools +3.6/10.0
- Condition / age +2.5/5.0
- Appreciation +0.0/10.0
$229,000
🖨 Deal sheet (PDF) 📄 Offer letter ✓ Due diligence
Listing remarks MLS
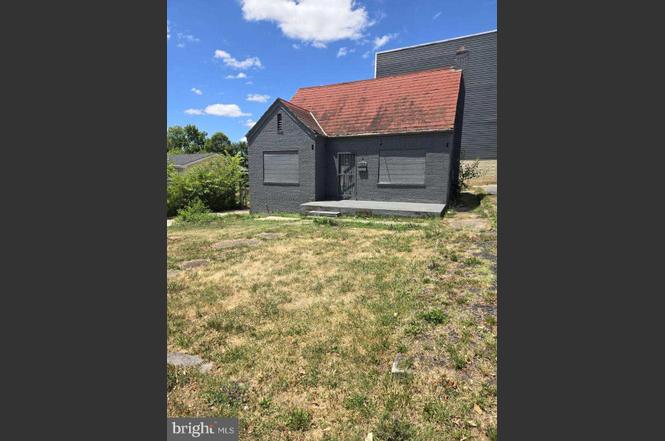
Rehab Ready! Corner lot fully detached brick home on 3 levels with off street parking perfect for the seasoned investor and anyone looking to totally redo a home to their liking. Located 1 block off Eastern Avenue NE and 1/2 mile from Capitol Heights metro rail station (Silver and Blue lines)
Key facts
- 5,605 sq ft lot
- Built 1939
- Listed 521 days
Property features AI
Finance
- Other: Fee simple ownership
Exterior
- Parking: Off-site parking
- Utilities: Public water; Public sewer
- Home design: Detached structure; Above grade finished area of 1,025; Below grade unfinished area of 854
- Construction: Brick construction; Concrete perimeter foundation; Building is not winterized
- Exterior features: No tidal water on the property
Interior
- Bedrooms: 3 bedrooms on the main level
- Bathrooms: 1 full bathroom on the main level; 1 full bathroom total
- Heating & cooling: Hot water heating; Electric cooling; Wood as heating fuel (wood-burning heat source present)
- Interior features: Not furnished; Connecting stairway to basement
Neighborhood map
What this means for you Summary
Snapshot
- This is a 3-bed/1.0-bath single-family listed at $229k.
Deal economics
- At list price, monthly cash flow is $494 ($6k/yr) — positive.
- The deal already cash-flows at list — no discount required.
- Meets the 1% rule at list price ($3k rent vs $229k).
- Recommended offer: $202k (12.0% below list) — sets the bar for market timing.
- Cap rate 8.9% vs local median 2.5% in Washington — top-decile yield for the area; either an underpriced asset or a hidden risk that comps aren't pricing in. Stress-test before assuming the spread holds.
Location & tenants
- Location reads 73/100 on livability (#1 in DC) — a middle-class / working-renter tenant base. Strengths: amenities A+, commute A+, employment A+; Watch: crime F, cost of living F.
- District Of Columbia Public Schools (urban): math 33% / reading 40% proficiency, ranked #8 of 32 in DC (top 25%) — families likely to look elsewhere, expect single-tenant / working-renter base with shorter leases; 65% free/reduced lunch — lower-income household profile, screen leases tightly.
- Zoned schools: Capitol Hill Montessori School At Logan (424 students, 0% FRL); Kelly Miller Ms (351 students, 0% FRL); H.D. Woodson Hs (543 students, 0% FRL) — zoned schools average 0% FRL vs 65% district-wide (65 pts lower); this property's tenant base skews higher-income than the district average.
- Market conditions: Rents rising fast (+6.1%/yr); 281 active listings in the ZIP; 40 comparable units currently listed for rent nearby; rentals at typical pace (median 26d on market — plan ~3-4 weeks tenant-placement turnaround); 1,737 units permitted in District of Columbia in 2024 (1,506 in 5+ unit buildings).
- At $2,581/mo this rent would consume 53% of the median local household income ($58k/yr) (locally 5115% of renters already pay >50% of income on rent) — very limited rent-growth headroom before tenants either downsize or default.
Forward outlook
- Local home prices are declining (-3.0%/yr); year-one equity from $2k of loan paydown is wiped out by about $7k of value loss. Plan a longer hold.
- District of Columbia County population projected at +50% by 2050 — long-run rental-demand tailwind backs the buy-and-hold thesis.
- At projected returns (-3.0% appreciation + 6.1% rent growth), your $64k cash investment doubles in ~9 years — after that, you're playing with house money.
Negotiation context
- It's been on market 521 days — a 12% lower offer ($202k) is reasonable based on typical stale-listing flexibility.
- 6 sale attempts since 9y ago; this cycle's ask has dropped $460k (67%) from the opening price — seller is motivated, your offer sets the floor, not the list.
Risks & watch-outs
- Watch-outs: built in 1939 — expect roof / HVAC / electrical / plumbing capex.
- Climate carrying-cost: extreme-heat days projected 7→15/yr by 2055 (HVAC capex compounding) — expect insurance premiums to compound above CPI over the hold.
Questions for the listing agent
- It's been on market 521 days. Have you received any prior offers? Is the seller open to a 12% concession, seller financing, or rate buy-down credit?
- Built in 1939 — when were the roof, HVAC, electrical panel, plumbing, and water heater last replaced?
- Why hasn't it sold? Are there any deal-killer items the seller is aware of (foundation, flood, title, zoning, code violations)?
- Is there a deadline driving the sale (1031 exchange, divorce, estate, relocation)? That informs how much negotiation room exists.
- Crime grade is F in this area — have there been break-ins, vandalism, or insurance claims at this property in the last 3 years? What carrier currently insures it and at what premium?
- What's the average days-on-market for RENTAL listings here right now (not sales)? A rising rental-DOM trend means longer vacancies and softer asking-rent achievability than the comps imply.
- What's the recent tenant-quality profile in this submarket — average credit score on applications, eviction rate, late-payment / NSF rate, and stable-employment percentage? A property-management company in the area should have these aggregated.
- How much new for-sale + rental construction is in the pipeline within 1–3 miles? Heavy new supply typically softens prices + rents 12–24 months out; constrained supply supports both.
Investment metrics
- 1% rule
- 1.13% ✓
- Cap rate
- 8.88%
- Cash-on-cash
- 9.25%
- DSCR
- 1.41
- GRM
- 7.4
CMA / ARV
- ARV (on-the-fly)
- $326,975
- Comps found
- 12
Show comp detail 12 sales within ~0.75 mi
| Address | Dist | Beds/Ba | Sqft | Sold | Price | $/sf | Match |
|---|---|---|---|---|---|---|---|
| 5722 Eagle St | 0.43mi | 3/1.0 | 1,008 (-2%) | 9mo | $300,000 | $298 | 70 |
| 600 64th Ave | 0.32mi | 3/2.0 | 1,125 (+10%) | 5mo | $355,000 | $316 | 61 |
| 5338 Jay St NE | 0.61mi | 3/1.5 | 1,054 (+3%) | 7mo | $365,000 | $346 | 59 |
| 6209 Foote St | 0.13mi | 3/2.0 | 1,176 (+15%) | 9mo | $325,000 | $276 | 58 |
| 603 62nd Pl | 0.20mi | 4/2.0 (+1) | 1,152 (+12%) | 8mo | $325,000 | $282 | 55 |
| 5704 L | 0.58mi | 3/2.0 | 936 (-9%) | 6mo | $342,500 | $366 | 49 |
| 5206 Banks Pl NE | 0.72mi | 3/1.0 | 1,116 (+9%) | 6mo | $275,000 | $246 | 47 |
| 404 70th Pl | 0.68mi | 2/1.0 (-1) | 936 (-9%) | 3mo | $299,000 | $319 | 46 |
| 704 65th Ave | 0.45mi | 3/2.0 | 875 (-15%) | 7mo | $325,000 | $371 | 45 |
| 6202 K St | 0.52mi | 3/2.0 | 1,136 (+11%) | 11mo | $354,000 | $312 | 44 |
| 5707 Coolidge St | 0.56mi | 4/3.0 (+1) | 1,158 (+13%) | 3mo | $385,000 | $332 | 37 |
| 805 Minna Ave | 0.70mi | 2/1.0 (-1) | 884 (-14%) | 8mo | $290,000 | $328 | 33 |
Match score weights: distance 35% · size 25% · config 20% · recency 20%. Top-matched comps best support the ARV.
Projected returns pro-forma
-3.0% appreciation · 6.06% rent growth · sell at horizon
- IRR
- 1.0%
- Equity multiple
- 1.04×
- Total profit
- $2,567
- Equity at exit
- $34,145
- IRR
- 13.5%
- Equity multiple
- 2.23×
- Total profit
- $78,613
- Equity at exit
- $19,800
Cash invested: $64,120 (down + closing). Projections, not guarantees.
Landlord ↔ Tenant lean methodology
- Overall (CITY)
- 0 Strongly Tenant-Friendly
- State District of Columbia
- 12 Strongly Tenant-Friendly · D+43
- County
- — inherits STATE
- City Washington
- 0 Strongly Tenant-Friendly · D+43
ZIP-level market 20019
- Rents YoY
- 6.1%
- Active inventory
- 281
- Price-to-rent
- 7.4×
Monthly cashflow live
- Estimated rent
- $2,581 high interval (Pro) →
- Mortgage (P&I)
- −$1,201
- Tax from tax record
- −$249 /mo · $2,986/yr
- Insurance
- −$95
- HOA
- −$0
- Vacancy / Maint / Mgmt
- −$542
- Net cashflow
- $494
Break-even live
Sensitivity live
| Price | -10% $624 | -5% $559 | +0% $494 | +5% $429 | +10% $364 |
|---|---|---|---|---|---|
| Rent | -10% $290 | -5% $392 | +0% $494 | +5% $596 | +10% $698 |
| Rate | -1.0pp $609 | -0.5pp $552 | base $494 | +0.5pp $435 | +1.0pp $374 |
UW: 25.0% down · 7.5% · 30yr · 1.5% tax · 5.0% vac · 8.0% maint · 8.0% mgmt
Financing live
Cash to close
- Down payment
- $57,250
- Closing costs
- $6,870
- Reserves months
- —
- Total cash needed
- —
Loan-product check · same deal, 3 products live
Conventional
25% down · 7.5% · 30yr
- Down + closing
- —
- Monthly P&I
- —
- Monthly cashflow
- —
- DSCR
- —
- Eligible?
- —
Personal DTI + credit; lowest rate.
DSCR
20% down · 8.5% · 30yr
- Down + closing
- —
- Monthly P&I
- —
- Monthly cashflow
- —
- DSCR
- —
- Eligible?
- —
No personal income docs; deal must DSCR.
Hard money
10% down · 12.0% · 12mo
- Down + closing
- —
- Monthly P&I
- —
- Monthly cashflow
- —
- DSCR
- —
- Eligible?
- —
Short-term bridge; refi at stabilization.
Rent comps 40 comps
| Address | Beds | Baths | Sqft | Rent | $/sqft | DOM | Units | Dist |
|---|---|---|---|---|---|---|---|---|
| 324 61st St NE Unit 4 Washington, DC | 3.0 | 1.5 | 850 | $2,800 | $3.29 | 26d | 1 | 0.14mi |
| 622 Eastern Ave NE #301 Washington, DC | 2.0 | 1.0 | 755 | $1,900 | $2.52 | 26d | 1 | 0.16mi |
| 323 62nd St NE Washington, DC | 1.0–3.0 | 1.0–2.0 | 908 | $2,435 | $2.68 | 26d | 1 | 0.18mi |
| 5811 Field Pl NE Unit 304 Washington, DC | 3.0 | 1.0 | 779 | $2,922 | $3.75 | 26d | 1 | 0.21mi |
| 6340 Southern Ave NE Washington, DC | 4.0 | 2.0 | 1248 | $4,200 | $3.37 | 26d | 1 | 0.32mi |
| 805 Eastern Ave Fairmount Heights, MD | 4.0 | 2.0 | 936 | $2,400 | $2.56 | 6d | 1 | 0.38mi |
| 809 Eastern Ave Fairmount Heights, MD | 3.0 | 2.0 | 1246 | $2,400 | $1.93 | 6d | 1 | 0.40mi |
| 818 Balsamtree Pl Capitol Heights, MD | 4.0 | 1.5 | 1102 | $2,275 | $2.06 | 6d | 1 | 0.43mi |
| 716 55th St NE Unit 1 Washington, DC | 2.0 | 2.0 | 1100 | $2,200 | $2.00 | 21d | 1 | 0.49mi |
| 337 54th St NE Unit A Washington, DC | 3.0 | 1.5 | 1184 | $2,850 | $2.41 | 26d | 1 | 0.49mi |
| 505 69th St Capitol Heights, MD | 3.0 | 2.0 | 1000 | $2,500 | $2.50 | 20d | 1 | 0.52mi |
| 5338 Jay St NE Washington, DC | 3.0 | 1.5 | 1000 | $2,795 | $2.79 | 26d | 1 | 0.60mi |
| 1105 61st Ave Fairmount Heights, MD | 4.0 | 3.5 | 1352 | $2,500 | $1.85 | 20d | 1 | 0.60mi |
| 6211 L St Capitol Heights, MD | 2.0 | 2.0 | 1500 | $2,250 | $1.50 | 1d | 1 | 0.60mi |
| 5225 Dix St NE Washington, DC | 2.0 | 1.0 | 800 | $1,500 | $1.88 | 23d | 1 | 0.62mi |
| 6210 Lee Pl Capitol Heights, MD | 2.0 | 1.0 | 1200 | $1,950 | $1.62 | 4d | 1 | 0.66mi |
| 5347 Ames St NE Washington, DC | 3.0 | 2.0 | 1428 | $3,000 | $2.10 | 26d | 1 | 0.67mi |
| 22 Chamber Ave Capitol Heights, MD | 3.0 | 1.0 | 942 | $3,000 | $3.18 | 45d | 1 | 0.69mi |
| 5213 Just St NE Washington, DC | 3.0 | 2.0 | 1114 | $2,400 | $2.15 | 26d | 1 | 0.73mi |
| 927 52nd St NE Unit 4 Washington, DC | 2.0 | 1.0 | 700 | $1,500 | $2.14 | 26d | 1 | 0.77mi |
| 5539 Central Ave SE Washington, DC | 3.0 | 2.0 | 1140 | $2,300 | $2.02 | 23d | 1 | 0.78mi |
| 945 52nd St NE Washington, DC | 2.0–3.0 | 1.0 | 612 | $2,270 | $3.71 | 26d | 4 | 0.78mi |
| 814 51st St NE Washington, DC | 3.0 | 1.0 | 1210 | $2,200 | $1.82 | 26d | 1 | 0.80mi |
| 5532 B St SE Washington, DC | 2.0 | 2.0 | 1188 | $2,800 | $2.36 | 26d | 1 | 0.80mi |
| 599 50th St NE Washington, DC | 1.0–2.0 | 1.0–2.0 | 775 | $2,081 | $2.69 | 26d | 1 | 0.84mi |
| 5074 Central Ave SE Washington, DC | 4.0 | 2.0 | 1349 | $5,200 | $3.85 | 23d | 1 | 0.87mi |
| 416 Topeka Ave Unit A Capitol Heights, MD | 3.0 | 2.0 | 1170 | $2,800 | $2.39 | 45d | 1 | 0.87mi |
| 903 Glen Willow Dr Capitol Heights, MD | 2.0–3.0 | 1.0 | 885 | $2,115 | $2.39 | 1d | 3 | 0.89mi |
| 5124 Astor Pl SE Washington, DC | 2.0 | 1.0 | 700 | $1,100 | $1.57 | 26d | 1 | 0.93mi |
| 5000 Hunt St NE Washington, DC | 2.0 | 1.0 | 629 | $1,325 | $2.11 | 26d | 20 | 0.94mi |
| 4930 Eads Pl NE Washington, DC | 3.0 | 1.5 | 1054 | $2,400 | $2.28 | 26d | 1 | 0.94mi |
| 4802 Leroy Gorham Dr Capitol Heights, MD | 4.0 | 3.5 | 1482 | $3,500 | $2.36 | 4d | 1 | 0.96mi |
| 5344 C St SE Unit 102 Washington, DC | 3.0 | 2.0 | 1000 | $2,499 | $2.50 | 26d | 1 | 0.96mi |
| 5344 C St SE Unit 302 Washington, DC | 3.0 | 2.0 | 1000 | $2,100 | $2.10 | 26d | 1 | 0.96mi |
| 556 49th Pl NE Washington, DC | 3.0 | 3.0 | 894 | $3,475 | $3.89 | 26d | 1 | 0.98mi |
| 4925 Just St NE Washington, DC | 2.0 | 2.0 | 864 | $2,299 | $2.66 | 26d | 1 | 0.98mi |
| 5401 Call Pl SE Washington, DC | 2.0–3.0 | 1.0 | 1094 | $2,626 | $2.40 | 3d | 2 | 1.01mi |
| 4950 Just St NE Washington, DC | 3.0 | 2.0 | 1437 | $4,000 | $2.78 | 26d | 1 | 1.02mi |
| 4934 Just St NE Washington, DC | 2.0 | 1.0 | 966 | $2,200 | $2.28 | 26d | 1 | 1.03mi |
| 832 49th St NE Unit 1 Washington, DC | 3.0 | 1.0 | 1100 | $2,350 | $2.14 | 9d | 1 | 1.03mi |
Listing history 41 events
-
2026-06-21days on market $229,000 Active 521 DOM
-
2026-06-18days on market $229,000 Active 518 DOM
-
2026-06-17days on market $229,000 Active 517 DOM
-
2026-06-16days on market $229,000 Active 516 DOM
-
2026-06-15days on market $229,000 Active 515 DOM
-
2026-06-13pricedays on market $229,000 Active 513 DOM
-
2026-06-09days on market $249,900 Active 509 DOM
-
2026-06-08days on market $249,900 Active 508 DOM
-
2026-06-07days on market $249,900 Active 507 DOM
-
2026-06-04days on market $249,900 Active 504 DOM
-
2026-06-03days on market $249,900 Active 503 DOM
-
2026-06-02days on market $249,900 Active 502 DOM
-
2026-06-01days on market $249,900 Active 501 DOM
-
2026-05-31days on market $249,900 Active 500 DOM
-
2026-04-16price $259,000
-
2026-03-24price $289,000
-
2026-03-10price $299,900
-
2026-02-14price $329,900
-
2026-01-13status Active
-
2026-01-13status Pending
-
2026-01-02price $349,000
-
2025-12-17price $364,000
-
2025-06-23price $384,900
-
2025-03-27price $399,000
-
2025-03-14price $449,000
-
2025-02-26price $499,000
-
2025-02-20price $599,900
-
2025-01-16$689,000 Active
-
2018-09-27historical 294-char remark
Show marketing remark (294 chars)
Rehab Ready! Corner lot fully detached brick home on 3 levels with off street parking perfect for the seasoned investor and anyone looking to totally redo a home to their liking. Located 1 block off Eastern Avenue NE and 1/2 mile from Capitol Heights metro rail station (Silver and Blue lines)
-
2018-09-26soldstatus $260,000
-
2018-09-21soldstatus $260,000 Closed 294-char remark
Show marketing remark (294 chars)
Rehab Ready! Corner lot fully detached brick home on 3 levels with off street parking perfect for the seasoned investor and anyone looking to totally redo a home to their liking. Located 1 block off Eastern Avenue NE and 1/2 mile from Capitol Heights metro rail station (Silver and Blue lines)
-
2018-09-21soldstatus $260,000 Sold 294-char remark
Show marketing remark (294 chars)
Rehab Ready! Corner lot fully detached brick home on 3 levels with off street parking perfect for the seasoned investor and anyone looking to totally redo a home to their liking. Located 1 block off Eastern Avenue NE and 1/2 mile from Capitol Heights metro rail station (Silver and Blue lines)
-
2018-08-28status Pending 294-char remark
Show marketing remark (294 chars)
Rehab Ready! Corner lot fully detached brick home on 3 levels with off street parking perfect for the seasoned investor and anyone looking to totally redo a home to their liking. Located 1 block off Eastern Avenue NE and 1/2 mile from Capitol Heights metro rail station (Silver and Blue lines)
-
2018-08-28status Contract 294-char remark
Show marketing remark (294 chars)
Rehab Ready! Corner lot fully detached brick home on 3 levels with off street parking perfect for the seasoned investor and anyone looking to totally redo a home to their liking. Located 1 block off Eastern Avenue NE and 1/2 mile from Capitol Heights metro rail station (Silver and Blue lines)
-
2018-08-11$225,000 Active 294-char remark
Show marketing remark (294 chars)
Rehab Ready! Corner lot fully detached brick home on 3 levels with off street parking perfect for the seasoned investor and anyone looking to totally redo a home to their liking. Located 1 block off Eastern Avenue NE and 1/2 mile from Capitol Heights metro rail station (Silver and Blue lines)
-
2017-02-13historical Withdrawn
-
2017-02-13historical
-
2017-02-08Active
-
2017-02-08$199,000
-
1985-02-04soldstatus $35,000
ⓘ Source: listings_history table (triggers on properties + properties_extension) + one-shot
backfill from property_details.listing_events for pre-trigger history.
Tax reassessment forecast DC · Partial reset (capped growth)
- Current annual tax
- $2,986 · $249/mo
- Projected year-2 tax
- $2,986 · $249/mo
- Expected delta
- $0/yr ($0/mo · 0.0%)
ⓘ Screening estimate from a state-policy table — verify with the county assessor before closing.
Climate risk First Street
- Flood 1/10 Low FEMA zone X (unshaded) · 0% chance over 30 yrs
- Wildfire 1/10 Low
- Heat 8/10 Severe 7 d/yr ≥103°F today · 15 d/yr by 30 yrs out
- Wind 4/10 Moderate 21% chance of damaging wind over 30 yrs
- Air quality 4/10 Moderate 4 unhealthy d/yr today · 5 by 30 yrs out
Nearby sold comps map
Loading sold comps map…
Walkable amenities ~0.75 mi
Loading nearby amenities…
Taxation est. · year 1
- Rental income
- $30,976
- − Mortgage interest
- −$12,828
- − Property taxes
- −$2,986
- − Insurance
- −$1,145
- − Repairs & maintenance
- −$2,478
- − Management
- −$2,478
- − Depreciation
- −$6,662
- Taxable income
- $2,399
- Est. tax owed @ 24.0%
- −$576
- After-tax cash flow
- $5,353/yr
For passive investors: Depreciation is non-cash, so a rental often shows a tax loss while cash-flowing — sheltering income. Rental losses are passive: they offset passive income freely, and up to $25,000/yr can offset ordinary (W-2) income if you actively participate and your MAGI is under $100k (phasing out to $0 by $150k); unused losses carry forward. On sale, claimed depreciation is recaptured at up to 25%, and gains may owe capital-gains tax (a 1031 exchange can defer both). Figures are a year-1 estimate at your 24.0% rate — not tax advice; consult a CPA.
Schools (NCES district)
- District
- District Of Columbia Public Schools
- NCES district ID
- 1100030
- Math proficiency
- 33% ▲ 3.00%
- Reading proficiency
- 40% ▲ 5.00%
- Median HH income
- $67,671
- Composite
- 35.84/100
- National rank
- #9606
- State rank
- #8 of 32 in DC
Livability — Washington
- Score
- 73/100
- State rank
- #1
- US rank
- #5327
Category grades
Schools grade is shown separately in the Schools card above.
Census & demographics
- Census place
- Washington, DC
- County
- District of Columbia · 671,873 people
- City population
- 671,873
- Metro
- Washington-Arlington-Alexandria, DC-VA-MD-WV
- Population (ZIP)
- 63,380
- Household income
- $58,296
- Rent vs Own
- Severe rent burden
- 5115.0
Population outlook (District of Columbia County) Hauer SSP2
- Today (2025)
- 821,926 people
- By 2030
- 899,517 · +9.4%
- By 2040
- 1,061,162 · +29.1%
- By 2050
- 1,231,493 · +49.8%
- By 2075
- 1,603,312 · +95.1%
- By 2100
- 1,847,141 · +124.7%
Race, ethnicity, and origin ACS 2023
- Neighborhood character
- Predominantly Black (87%)
- Race & ethnicity
- Black 87% Hispanic / Latino 7% Two or more races 4% White 2%
- Hispanic origin (detail)
- Mexican 1% Dominican 1%
- Foreign-born
- 6% · Canada
- Languages at home
- 91% English-only · Spanish 6% French/Haitian/Cajun 1%
Political lean MEDSL · District of Columbia
- 2024 margin
- Solid D (+86.1) · D 91.2% · R 5.1% · Other 3.8%
- 2008→2024 swing
- +0.1pp no change · 2008: 85.9pp · 2024: 86.1pp
- All cycles
- 2024: D+86.1 2020: D+86.8 2016: D+88.7 2012: D+84.2 2008: D+85.9
Not yet ingested
- Civics
- —
Market trends
- HPI YoY
- ▼ -416.91%
- Current HPI
- 326.4481
- Rent YoY
- ▲ 6.06%
- Metro
- Washington-Arlington-Alexandria, DC-VA-MD-WV
- State GDP YoY
- ▲ 1.33%
- F500 in state
- 6
Industry mix (Fortune 500 HQ in DC)
| Industry | F500 HQs | Revenue |
|---|---|---|
| Financial Services | 1 | $153B |
|
||
| Life Sciences / Industrials | 1 | $25B |
|
||
| Industrial Machinery | 1 | $8B |
|
||
Price history
+640.0% since first listed27 events — show timeline
- 2026-04-16 Price Changed $259,000 BRIGHT MLS
- 2026-03-24 Price Changed $289,000 BRIGHT MLS
- 2026-03-10 Price Changed $299,900 BRIGHT MLS
- 2026-02-14 Price Changed $329,900 BRIGHT MLS
- 2026-01-13 Relisted — BRIGHT MLS
- 2026-01-13 Pending — BRIGHT MLS
- 2026-01-02 Price Changed $349,000 BRIGHT MLS
- 2025-12-17 Price Changed $364,000 BRIGHT MLS
- 2025-06-23 Price Changed $384,900 BRIGHT MLS
- 2025-03-27 Price Changed $399,000 BRIGHT MLS
- 2025-03-14 Price Changed $449,000 BRIGHT MLS
- 2025-02-26 Price Changed $499,000 BRIGHT MLS
- 2025-02-20 Price Changed $599,900 BRIGHT MLS
- 2025-01-16 Listed $689,000 BRIGHT MLS
- 2018-09-27 Listing Removed — BRIGHT MLS
- 2018-09-26 Sold (Public Records) $260,000 Public Records
- 2018-09-21 Sold (MLS) $260,000 MRIS
- 2018-09-21 Sold (MLS) $260,000 BRIGHT MLS
- 2018-08-28 Pending — BRIGHT MLS
- 2018-08-28 Pending — MRIS
- 2018-08-11 Listed $225,000 MRIS
- 2018-08-11 Listed $225,000 BRIGHT MLS
- 2017-02-13 Listing Removed — BRIGHT MLS
- 2017-02-13 Delisted — MRIS
- 2017-02-08 Listed — MRIS
- 2017-02-08 Listed $199,000 BRIGHT MLS
- 1985-02-04 Sold (Public Records) $35,000 Public Records
Property tax history
+12.1%/yrLatest (2025): $2,986 · -82.7% YoY. Source: county tax records.
Cash-flow waterfall
monthlySold comps — $/sqft
last 12 mo · ≤1 miLoading sold comps…