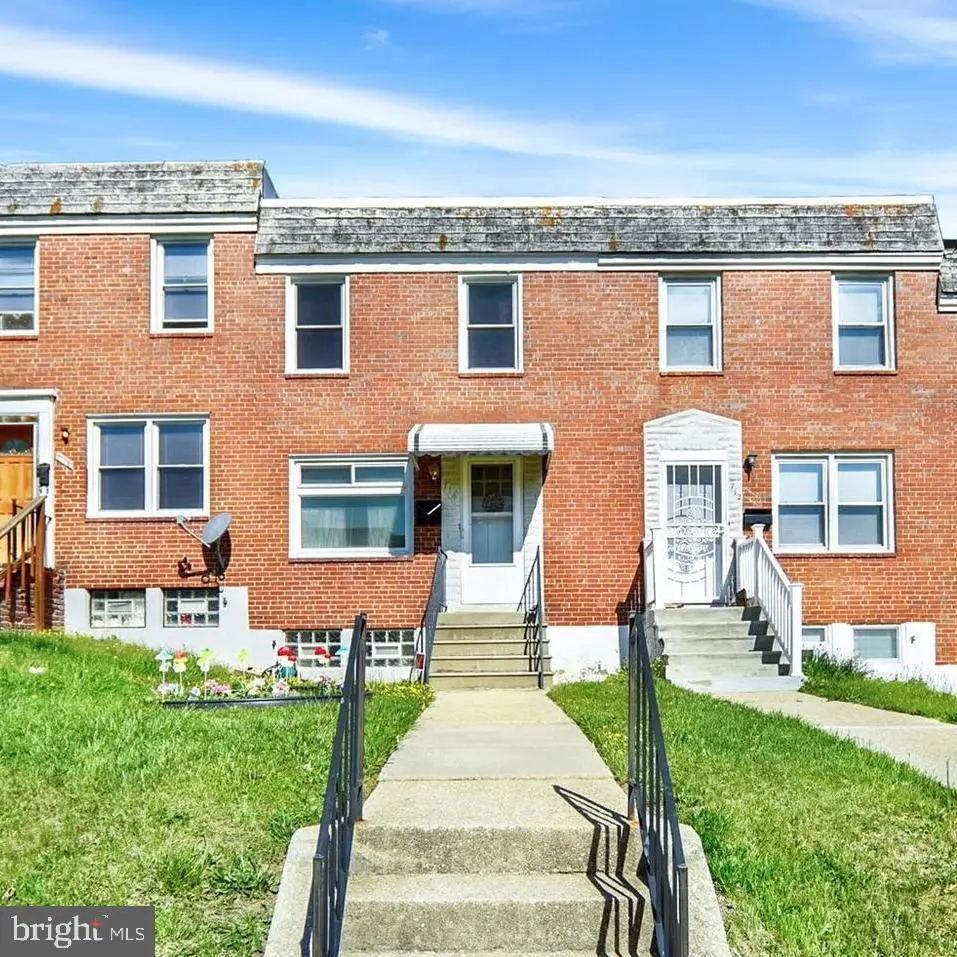
714 Bethnal Rd · Baltimore, MD
Flood risk 1/10 · Minimal
- FEMA flood zone
- X (unshaded)
- Chance of flooding over 30 yrs
- 0.0%
- Est. flood insurance / yr
- $473 – $860
Fire risk 1/10 · Minimal
- Est. fire insurance / yr
- $755 – $1,403
Heat risk 7/10 · Major
- Hot days now (above 103°F)
- 7 days/yr
- Hot days in 30 yrs
- 15 days/yr
Wind risk 5/10 · Moderate
- Chance of severe wind over 30 yrs
- 24.0%
Air-quality risk 3/10 · Minor
- Unhealthy air days now
- 3 days/yr
- Unhealthy air days in 30 yrs
- 4 days/yr
Risk factors via First Street. Map © Google.
Why this score? — see what drove the D grade
The composite is a weighted blend of 9 inputs, each scored 0–100. Each bar is that input's sub-score; the figure is the points it added to the 100-point composite (weight × sub-score).
- Cash flow +18.3/30.0
- DSCR +5.7/10.0
- 1% rule +4.8/10.0
- Rent growth +3.8/5.0
- Livability +3.8/5.0
- ARV discount +3.1/15.0
- Condition / age +2.5/5.0
- Schools +1.0/10.0
- Appreciation +0.0/10.0
$189,900
🖨 Deal sheet (PDF) 📄 Offer letter ✓ Due diligence
Listing remarks
Welcome to this charming and well-maintained home, perfect for a first-time buyer! This 3 bedroom with 2 bedrooms upstairs and 3rd bedroom in the basement, 1 bath home offers comfortable living with valuable bonus space and thoughtful features throughout. Enjoy cooking and entertaining in the kitchen, which opens to an extended sunroom featuring heat, ac and electricity-ideal for year round use as a dining area, home office, or a relaxing sitting room. The home includes brand new appliances including a stove, refrigerator and dryer with an existing washer, providing convenience and peace of mind for the new owners. The inviting living space features a real brick electric fireplace, creatin
Key facts
- Walkout basement
- Extended sunroom
- Attached shed
Tags
Property features AI
Exterior
- Parking: Detached carport with 2 spaces; Concrete driveway; Total of 2 garage/parking spaces
- Utilities: Public water; Public sewer; Electric cooling; Natural gas for heat and hot water
- Home design: Interior townhouse/rowhouse; Fee simple ownership
- Construction: Brick exterior; Block foundation
- Exterior features: Brick construction; Above- and below-grade finished space; Not in a federal flood zone; Pets allowed with no restrictions
Interior
- Kitchen: Gas oven/range; Refrigerator; Freezer
- Bedrooms: Two bedrooms on the upper level; One bedroom on the lower level
- Flooring: Wood floors
- Bathrooms: One full bathroom (upper level)
- Heating & cooling: Heat pump with gas backup; Natural gas heating and hot water; Central air conditioning (electric)
- Interior features: Formal separate dining room; Galley kitchen; Dining area; Wood floors; Sun/Florida room; Full walkout basement with windows (about half finished)
- Laundry & utility: Washer and electric dryer in unit; Laundry in basement
Neighborhood map
What this means for you Summary
Snapshot
- This is a 3-bed/1.0-bath townhouse listed at $190k.
Deal economics
- At list price, monthly cash flow is $173 ($2k/yr) — positive.
- The deal already cash-flows at list — no discount required.
- To meet the 1% rule (rent ≥ 1% of price), the offer needs to be $186k (1.9% below list).
- Recommended offer: $184k (3.0% below list) — sets the bar for market timing.
- Cap rate 7.4% vs local median 6.0% in Baltimore — meaningfully above typical; check what's discounted (condition, days-on-market, listing class) to confirm the premium yield is real.
Location & tenants
- Location reads 76/100 on livability (#90 in MD, #3,396 nationally) — a middle-class / working-renter tenant base. Strengths: amenities A+, commute A+, housing A+; Watch: crime F.
- Baltimore City Public Schools (urban): math 7% / reading 16% proficiency, ranked #24 of 24 in MD (top 100%) — low school quality limits family demand, transient renter base, plan for 1-2y turnover; 79% free/reduced lunch — lower-income household profile, screen leases tightly.
- Zoned schools: Elmer A. Henderson: A Johns Hopkins Partnership (math 2% / reading 16%, grade F, #650 of 860 statewide, top 77%, 642 students, 80% FRL); Baltimore Polytechnic Institute (math 71% / reading 84%, grade A-, #22 of 222 statewide, top 10%, 1,555 students, 43% FRL) — zoned schools average 62% FRL vs 79% district-wide (17 pts lower); this property's tenant base skews higher-income than the district average.
- Zoned-school proficiency averages 43% at this address vs 12% district-wide (+32 pts) — the actual schools serving this property are materially stronger than the Baltimore City Public Schools average implies; a family-tenant draw the district grade alone would hide.
- Market conditions: Rents rising fast (+5.4%/yr); 256 active listings in the ZIP; 40 comparable units currently listed for rent nearby; rentals at typical pace (median 24d on market — plan ~3-4 weeks tenant-placement turnaround); 1,273 units permitted in Baltimore city in 2024 (1,104 in 5+ unit buildings).
- This rent runs 37% of the median local income ($60k/yr) — at the standard rent-burdened threshold; future hikes will face affordability resistance.
Forward outlook
- Local home prices are declining (-3.0%/yr); year-one equity from $1k of loan paydown is wiped out by about $6k of value loss. Plan a longer hold.
- Baltimore County population projected to shrink 4% by 2050 — rents likely to lag national; underwrite the cash flow, not the appreciation.
Negotiation context
- It's been on market 58 days — a 3% lower offer ($184k) is reasonable based on typical stale-listing flexibility.
- Current owner paid $40k; list at $190k implies a 381% gain — meaningful room to come down on a strong offer.
Risks & watch-outs
- Watch-outs: built in 1954 — expect roof / HVAC / electrical / plumbing capex.
- Climate carrying-cost: moderate wind risk, 24% chance of damaging wind over 30y; extreme-heat days projected 7→15/yr by 2055 (HVAC capex compounding) — expect insurance premiums to compound above CPI over the hold.
Questions for the listing agent
- It's been on market 58 days. Have you received any prior offers? Is the seller open to a 3% concession, seller financing, or rate buy-down credit?
- Built in 1954 — when were the roof, HVAC, electrical panel, plumbing, and water heater last replaced?
- Is there a deadline driving the sale (1031 exchange, divorce, estate, relocation)? That informs how much negotiation room exists.
- Schools are D-rated, which usually means shorter tenancies and higher turnover. Who's the typical renter profile here, and what's been the actual vacancy rate?
- Crime grade is F in this area — have there been break-ins, vandalism, or insurance claims at this property in the last 3 years? What carrier currently insures it and at what premium?
- The area grade is low — what's the realistic commute time and amenity access for the typical tenant pool here? Any planned neighborhood developments (good or bad) we should know about?
- What's the average days-on-market for RENTAL listings here right now (not sales)? A rising rental-DOM trend means longer vacancies and softer asking-rent achievability than the comps imply.
- What's the recent tenant-quality profile in this submarket — average credit score on applications, eviction rate, late-payment / NSF rate, and stable-employment percentage? A property-management company in the area should have these aggregated.
- How much new for-sale + rental construction is in the pipeline within 1–3 miles? Heavy new supply typically softens prices + rents 12–24 months out; constrained supply supports both.
Investment metrics
- 1% rule
- 0.98% ✗
- Cap rate
- 7.39%
- Cash-on-cash
- 3.91%
- DSCR
- 1.17
- GRM
- 8.5
CMA / ARV
- ARV (median comp)
- $172,890
- List price
- $189,900
- Delta
- 9.84%
- Verdict
- FAIR
- Comps
- 20 within 1.0 mi
Show comp detail 12 sales within ~0.75 mi
| Address | Dist | Beds/Ba | Sqft | Sold | Price | $/sf | Match |
|---|---|---|---|---|---|---|---|
| 377 Marydell Rd | 0.30mi | 2/1.0 (-1) | 1,040 (0%) | 2mo | $145,000 | $139 | 79 |
| 4441 Eldone Rd | 0.10mi | 3/1.5 | 1,120 (+8%) | 4mo | $165,000 | $147 | 77 |
| 708 Woodington Rd S | 0.06mi | 2/1.5 (-1) | 1,120 (+8%) | 1mo | $100,000 | $89 | 76 |
| 4413 Parkton St | 0.14mi | 2/1.5 (-1) | 1,120 (+8%) | 3mo | $130,000 | $116 | 71 |
| 586 Lucia Ave | 0.11mi | 3/1.5 | 1,178 (+13%) | 3mo | $175,000 | $149 | 68 |
| 517 Lucia Ave | 0.03mi | 2/1.5 (-1) | 896 (-14%) | 5mo | $155,000 | $173 | 64 |
| 738 Yale Ave | 0.11mi | 2/1.0 (-1) | 896 (-14%) | 5mo | $144,000 | $161 | 63 |
| 626 Brisbane Rd | 0.21mi | 2/1.0 (-1) | 896 (-14%) | 5mo | $165,000 | $184 | 58 |
| 3579 Benzinger Rd | 0.74mi | 2/1.5 (-1) | 1,050 (+1%) | 3mo | $189,000 | $180 | 55 |
| 5141 Stafford Rd | 0.62mi | 3/1.5 | 1,140 (+10%) | 0mo | $120,100 | $105 | 53 |
| 4786 Melbourne Rd | 0.35mi | 2/1.5 (-1) | 896 (-14%) | 1mo | $175,000 | $195 | 53 |
| 304 S Augusta Ave | 0.53mi | 3/3.0 | 1,188 (+14%) | 5mo | $160,000 | $135 | 39 |
Match score weights: distance 35% · size 25% · config 20% · recency 20%. Top-matched comps best support the ARV.
Projected returns pro-forma
-3.0% appreciation · 5.38% rent growth · sell at horizon
- IRR
- -7.5%
- Equity multiple
- 0.72×
- Total profit
- $-15,149
- Equity at exit
- $28,315
- IRR
- 4.8%
- Equity multiple
- 1.39×
- Total profit
- $20,773
- Equity at exit
- $16,419
Cash invested: $53,172 (down + closing). Projections, not guarantees.
Landlord ↔ Tenant lean methodology
- Overall (CITY)
- 12 Strongly Tenant-Friendly
- State Maryland
- 27 Tenant-Leaning · D+14
- County
- — inherits STATE
- City Baltimore
- 12 Strongly Tenant-Friendly · D+58
ZIP-level market 21229
- Rents YoY
- 5.4%
- Active inventory
- 256
- Price-to-rent
- 8.5×
Monthly cashflow live
- Estimated rent
- $1,862 high interval (Pro) →
- Mortgage (P&I)
- −$996
- Tax from tax record
- −$223 /mo · $2,677/yr
- Insurance
- −$79
- HOA
- −$0
- Vacancy / Maint / Mgmt
- −$391
- Net cashflow
- $173
Break-even live
Sensitivity live
| Price | -10% $281 | -5% $227 | +0% $173 | +5% $120 | +10% $66 |
|---|---|---|---|---|---|
| Rent | -10% $26 | -5% $100 | +0% $173 | +5% $247 | +10% $320 |
| Rate | -1.0pp $269 | -0.5pp $222 | base $173 | +0.5pp $124 | +1.0pp $74 |
UW: 25.0% down · 7.5% · 30yr · 1.5% tax · 5.0% vac · 8.0% maint · 8.0% mgmt
Financing live
Cash to close
- Down payment
- $47,475
- Closing costs
- $5,697
- Reserves months
- —
- Total cash needed
- —
Loan-product check · same deal, 3 products live
Conventional
25% down · 7.5% · 30yr
- Down + closing
- —
- Monthly P&I
- —
- Monthly cashflow
- —
- DSCR
- —
- Eligible?
- —
Personal DTI + credit; lowest rate.
DSCR
20% down · 8.5% · 30yr
- Down + closing
- —
- Monthly P&I
- —
- Monthly cashflow
- —
- DSCR
- —
- Eligible?
- —
No personal income docs; deal must DSCR.
Hard money
10% down · 12.0% · 12mo
- Down + closing
- —
- Monthly P&I
- —
- Monthly cashflow
- —
- DSCR
- —
- Eligible?
- —
Short-term bridge; refi at stabilization.
Rent comps 40 comps
| Address | Beds | Baths | Sqft | Rent | $/sqft | DOM | Units | Dist |
|---|---|---|---|---|---|---|---|---|
| 500 Lucia Ave Baltimore, MD | 3.0 | 2.0 | 1472 | $2,100 | $1.43 | 18d | 1 | 0.08mi |
| 738 Yale Ave Baltimore, MD | 2.0 | 1.0 | 1346 | $1,900 | $1.41 | 25d | 1 | 0.09mi |
| 586 Lucia Ave Baltimore, MD | 3.0 | 1.5 | 1178 | $2,100 | $1.78 | 19d | 1 | 0.10mi |
| 4431 Eldone Rd Baltimore, MD | 3.0 | 2.0 | 896 | $2,000 | $2.23 | 25d | 1 | 0.11mi |
| 751 Yale Ave Baltimore, MD | 3.0 | 1.5 | 1024 | $1,750 | $1.71 | 45d | 1 | 0.12mi |
| 627 Lucia Ave Baltimore, MD | 3.0 | 1.0 | 892 | $1,750 | $1.96 | 25d | 1 | 0.13mi |
| 613 S Beechfield Ave Baltimore, MD | 3.0 | 1.5 | 1080 | $1,950 | $1.81 | 45d | 1 | 0.17mi |
| 565 Brisbane Rd Baltimore, MD | 2.0 | 2.0 | 1146 | $1,675 | $1.46 | 25d | 1 | 0.21mi |
| 4301 Parkton St Baltimore, MD | 1.0–3.0 | 1.0 | 730 | $1,550 | $2.12 | 45d | 1 | 0.28mi |
| 402 Colleen Rd Baltimore, MD | 1.0–2.0 | 1.0 | 910 | $1,450 | $1.59 | 4d | 11 | 0.36mi |
| 501 Hazlett Ave Baltimore, MD | 2.0–3.0 | 1.5–2.0 | 1044 | $1,750 | $1.68 | 0d | 8 | 0.41mi |
| 643 S Wickham Rd Baltimore, MD | 2.0 | 3.0 | 896 | $1,800 | $2.01 | 0d | 1 | 0.43mi |
| 304 Collins Ave Unit 2 Baltimore, MD | 3.0 | 1.0 | 1016 | $2,100 | $2.07 | 45d | 1 | 0.57mi |
| 19 S Tremont Rd Baltimore, MD | 3.0 | 1.0 | 1350 | $1,850 | $1.37 | 45d | 1 | 0.58mi |
| 2 S Tremont Rd Baltimore, MD | 3.0 | 2.0 | 1450 | $1,800 | $1.24 | 12d | 1 | 0.63mi |
| 2 S Tremont Rd Baltimore, MD | 3.0 | 2.0 | 1450 | $1,800 | $1.24 | 25d | 1 | 0.63mi |
| 5147 Frederick Ave Baltimore, MD | 3.0 | 2.0 | 1216 | $1,950 | $1.60 | 5d | 1 | 0.67mi |
| 114 S Rock Glen Rd Baltimore, MD | 4.0 | 1.5 | 1160 | $2,350 | $2.03 | 14d | 1 | 0.67mi |
| 4018 Massachusetts Ave Baltimore, MD | 3.0 | 1.0 | 1050 | $1,400 | $1.33 | 25d | 1 | 0.73mi |
| 4601 Pen Lucy Rd Unit 4615-G Baltimore, MD | 2.0 | 1.0 | 798 | $1,200 | $1.50 | 23d | 1 | 0.73mi |
| 212 S Loudon Ave Baltimore, MD | 3.0 | 1.5 | 1310 | $1,550 | $1.18 | 45d | 1 | 0.73mi |
| 4601 Pen Lucy Rd Unit 4718-F Baltimore, MD | 2.0 | 1.0 | 879 | $1,225 | $1.39 | 4d | 1 | 0.74mi |
| 4601 Pen Lucy Rd Unit 4714-B Baltimore, MD | 2.0 | 1.0 | 730 | $1,205 | $1.65 | 16d | 1 | 0.74mi |
| 4601 Pen Lucy Rd Unit 103-H Baltimore, MD | 2.0 | 1.0 | 798 | $1,315 | $1.65 | 25d | 1 | 0.74mi |
| 2 S Woodington Rd Baltimore, MD | 2.0 | 1.0 | 856 | $1,160 | $1.36 | 16d | 1 | 0.79mi |
| 2 N Woodington Rd Baltimore, MD | 1.0–2.0 | 1.0 | 738 | $1,335 | $1.81 | 5d | 5 | 0.79mi |
| 219 Atholgate Ln Baltimore, MD | 1.0–3.0 | 1.0–1.5 | 814 | $1,500 | $1.84 | 5d | 2 | 0.81mi |
| 3704 Coolidge Ave Baltimore, MD | 2.0 | 1.0 | 1262 | $2,000 | $1.58 | 22d | 1 | 0.83mi |
| 4610 College Ave Baltimore, MD | 4.0 | 2.0 | 1440 | $2,200 | $1.53 | 19d | 1 | 0.84mi |
| 21 Holland Hill Ct Catonsville, MD | 4.0 | 1.5 | 1320 | $2,200 | $1.67 | 45d | 1 | 0.89mi |
| 3392 Saint Benedict St Baltimore, MD | 2.0 | 1.0 | 864 | $1,450 | $1.68 | 25d | 1 | 0.90mi |
| 111 Upmanor Rd Baltimore, MD | 3.0 | 1.5 | 1224 | $2,163 | $1.77 | 45d | 1 | 0.90mi |
| 24 Laurence Brooke Rd Catonsville, MD | 4.0 | 3.0 | 1440 | $2,800 | $1.94 | 14d | 1 | 0.92mi |
| 4700 Gateway Ter Arbutus, MD | 1.0–3.0 | 1.0 | 728 | $1,652 | $2.27 | 45d | 1 | 0.92mi |
| 131 N Bend Rd Unit 131-1B Baltimore, MD | 2.0 | 1.5 | 910 | $1,225 | $1.35 | 23d | 1 | 0.92mi |
| 220 Stonecroft Rd Unit 230-D Baltimore, MD | 2.0 | 1.5 | 900 | $1,395 | $1.55 | 23d | 1 | 1.01mi |
| 220 Stonecroft Rd Unit 232-I Baltimore, MD | 2.0 | 1.5 | 900 | $1,295 | $1.44 | 19d | 1 | 1.01mi |
| 220 Stonecroft Rd Unit 220-H Baltimore, MD | 2.0 | 1.5 | 900 | $1,245 | $1.38 | 0d | 1 | 1.01mi |
| 5364 Jamestowne Ct Baltimore, MD | 3.0 | 1.0–1.5 | 787 | $1,905 | $2.42 | 0d | 15 | 1.01mi |
| 3 Brucester Bridge Ct Catonsville, MD | 4.0 | 2.5 | 1440 | $2,700 | $1.88 | 25d | 1 | 1.04mi |
Listing history 18 events
-
2026-06-21days on market $189,900 Active 58 DOM
-
2026-06-18days on market $189,900 Active 55 DOM
-
2026-06-17days on market $189,900 Active 54 DOM
-
2026-06-16days on market $189,900 Active 53 DOM
-
2026-06-15days on market $189,900 Active 52 DOM
-
2026-06-13days on market $189,900 Active 50 DOM
-
2026-06-09days on market $189,900 Active 46 DOM
-
2026-06-08days on market $189,900 Active 45 DOM
-
2026-06-07days on market $189,900 Active 44 DOM
-
2026-06-04days on market $189,900 Active 41 DOM
-
2026-06-03days on market $189,900 Active 40 DOM
-
2026-06-02days on market $189,900 Active 39 DOM
-
2026-06-01days on market $189,900 Active 38 DOM
-
2026-05-31days on market $189,900 Active 37 DOM
-
2026-05-15price $189,900 1011-char remark
-
2026-04-24$199,900 Active 1011-char remark
-
1996-07-10soldstatus $39,500
-
1990-02-13soldstatus $37,500
ⓘ Source: listings_history table (triggers on properties + properties_extension) + one-shot
backfill from property_details.listing_events for pre-trigger history.
Tax reassessment forecast MD · Partial reset (capped growth)
- Current annual tax
- $2,677 · $223/mo
- Projected year-2 tax
- $2,677 · $223/mo
- Expected delta
- $0/yr ($0/mo · 0.0%)
ⓘ Screening estimate from a state-policy table — verify with the county assessor before closing.
Climate risk First Street
- Flood 1/10 Low FEMA zone X (unshaded) · 0% chance over 30 yrs
- Wildfire 1/10 Low
- Heat 7/10 Severe 7 d/yr ≥103°F today · 15 d/yr by 30 yrs out
- Wind 5/10 Major 24% chance of damaging wind over 30 yrs
- Air quality 3/10 Moderate 3 unhealthy d/yr today · 4 by 30 yrs out
Nearby sold comps map
Loading sold comps map…
Walkable amenities ~0.75 mi
Loading nearby amenities…
Taxation est. · year 1
- Rental income
- $22,350
- − Mortgage interest
- −$10,637
- − Property taxes
- −$2,677
- − Insurance
- −$950
- − Repairs & maintenance
- −$1,788
- − Management
- −$1,788
- − Depreciation
- −$5,524
- Taxable loss
- −$1,014
- Est. tax savings @ 24.0%
- +$243
- After-tax cash flow
- $2,323/yr
For passive investors: Depreciation is non-cash, so a rental often shows a tax loss while cash-flowing — sheltering income. Rental losses are passive: they offset passive income freely, and up to $25,000/yr can offset ordinary (W-2) income if you actively participate and your MAGI is under $100k (phasing out to $0 by $150k); unused losses carry forward. On sale, claimed depreciation is recaptured at up to 25%, and gains may owe capital-gains tax (a 1031 exchange can defer both). Figures are a year-1 estimate at your 24.0% rate — not tax advice; consult a CPA.
Schools (NCES district)
- District
- Baltimore City Public Schools
- NCES district ID
- 2400090
- Math proficiency
- 7% ▼ -9.00%
- Reading proficiency
- 16% ▼ -5.00%
- Median HH income
- $42,108
- Composite
- 10.08/100
- National rank
- #9805
- State rank
- #24 of 24 in MD
Livability — Baltimore
- Score
- 76/100
- State rank
- #90
- US rank
- #3396
Category grades
Schools grade is shown separately in the Schools card above.
Census & demographics
- Census place
- Baltimore, MD
- County
- Baltimore City · 558,601 people
- City population
- 588,727
- Metro
- Baltimore-Columbia-Towson, MD
- Population (ZIP)
- 46,679
- Household income
- $60,047
- Rent vs Own
- Severe rent burden
- 2776.0
Population outlook (Baltimore County) Hauer SSP2
- Today (2025)
- 624,249 people
- By 2030
- 621,541 · -0.4%
- By 2040
- 609,756 · -2.3%
- By 2050
- 597,249 · -4.3%
- By 2075
- 552,236 · -11.5%
- By 2100
- 513,934 · -17.7%
Race, ethnicity, and origin ACS 2023
- Neighborhood character
- Predominantly Black (73%)
- Race & ethnicity
- Black 73% White 15% Hispanic / Latino 6% Two or more races 4% Asian 3%
- Hispanic origin (detail)
- Common ancestry
- Lithuanian 1% Romanian 1% Serbian 1%
- Foreign-born
- 5% · Canada, Philippines
- Languages at home
- 91% English-only · Spanish 4% Other Indo-European 2% Other Asian/Pacific 1%
Political lean MEDSL · Baltimore
- 2024 margin
- Solid D (+73.0) · D 85.2% · R 12.2% · Other 2.6%
- 2008→2024 swing
- -2.5pp toward R · 2008: 75.5pp · 2024: 73.0pp
- All cycles
- 2024: D+73.0 2020: D+76.6 2016: D+74.6 2012: D+76.4 2008: D+75.5
Not yet ingested
- Civics
- —
Market trends
- HPI YoY
- ▼ -259.07%
- Current HPI
- 226.896
- Rent YoY
- ▲ 5.38%
- Metro
- Baltimore-Columbia-Towson, MD
- State GDP YoY
- ▲ 2.97%
- F500 in state
- 12
Industry mix (Fortune 500 HQ in MD)
| Industry | F500 HQs | Revenue |
|---|---|---|
| Aerospace / Defense | 1 | $71B |
|
||
| Utilities | 1 | $25B |
|
||
| Hotels | 1 | $24B |
|
||
| Consumer Goods | 1 | $7B |
|
||
| Real Estate | 1 | $6B |
|
||
| Chemicals | 1 | $2B |
|
||
Price history
+406.4% since first listed4 events — show timeline
- 2026-05-15 Price Changed $189,900 BRIGHT MLS
- 2026-04-24 Listed $199,900 BRIGHT MLS
- 1996-07-10 Sold (Public Records) $39,500 Public Records
- 1990-02-13 Sold (Public Records) $37,500 Public Records
Property tax history
+1.0%/yrLatest (2025): $2,677 · +11.8% YoY. Source: county tax records.
Cash-flow waterfall
monthlySold comps — $/sqft
last 12 mo · ≤1 miLoading sold comps…