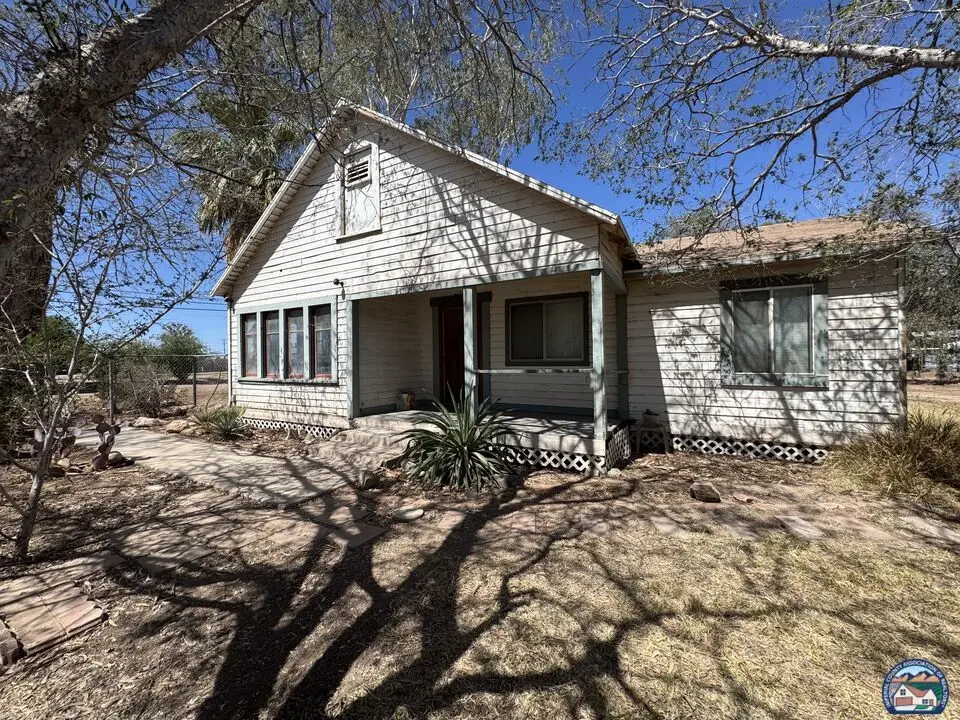
580 W Worthington Rd · Imperial, CA
Flood risk 1/10 · Minimal
- FEMA flood zone
- X (unshaded)
- Chance of flooding over 30 yrs
- 0.0%
- Est. flood insurance / yr
- $507 – $1,088
Fire risk 3/10 · Minor
- Est. fire insurance / yr
- $659 – $1,223
Heat risk 10/10 · Severe
- Hot days now (above 114°F)
- 8 days/yr
- Hot days in 30 yrs
- 23 days/yr
Wind risk 1/10 · Minimal
- Chance of severe wind over 30 yrs
- —
Air-quality risk 3/10 · Minor
- Unhealthy air days now
- 2 days/yr
- Unhealthy air days in 30 yrs
- 3 days/yr
Risk factors via First Street. Map © Google.
Why this score? — see what drove the B- grade
The composite is a weighted blend of 9 inputs, each scored 0–100. Each bar is that input's sub-score; the figure is the points it added to the 100-point composite (weight × sub-score).
- Cash flow +25.4/30.0
- ARV discount +15.0/15.0
- DSCR +8.4/10.0
- 1% rule +5.4/10.0
- Livability +3.4/5.0
- Schools +3.0/10.0
- Rent growth +2.5/5.0
- Condition / age +2.5/5.0
- Appreciation +0.0/10.0
$225,000
🖨 Deal sheet (PDF) 📄 Offer letter ✓ Due diligence
Listing remarks
Ideal for investors and developers. Property being sold as-is. Cash only. Value is in the land.
Key facts
- 2.49 acre lot
- Built 1950
Neighborhood map
What this means for you Summary
Snapshot
- This is a 3-bed/1.0-bath single-family listed at $225k.
Deal economics
- At list price, monthly cash flow is $516 ($6k/yr) — positive.
- The deal already cash-flows at list — no discount required.
- Meets the 1% rule at list price ($2k rent vs $225k).
- Cap rate 9.0% vs local median 3.9% in Imperial — top-decile yield for the area; either an underpriced asset or a hidden risk that comps aren't pricing in. Stress-test before assuming the spread holds.
Location & tenants
- Location reads 68/100 on livability (#286 in CA) — a middle-class / working-renter tenant base. Strengths: crime A+, housing A+, employment A-; Watch: schools C-, amenities F, commute F.
- Imperial Unified (suburban): math 21% / reading 44% proficiency, ranked #281 of 517 in CA (top 54%) — families likely to look elsewhere, expect single-tenant / working-renter base with shorter leases.
- Market conditions: 114 active listings in the ZIP; 3 comparable units currently listed for rent nearby; rentals lingering (median 44d on market — plan ~5-8 weeks vacancy on turnover, expect pricing pressure); 100% of comp listings sitting > 30 days — soft ceiling on asking rent; solid renter incomes; 271 units permitted in Imperial County in 2024 (112 in 5+ unit buildings).
- This rent runs 31% of the median local income ($91k/yr) — at the standard rent-burdened threshold; future hikes will face affordability resistance.
Forward outlook
- Local home prices are declining (-3.0%/yr); year-one equity from $2k of loan paydown is wiped out by about $7k of value loss. Plan a longer hold.
- Imperial County population projected at +7% by 2050 — modest demand growth; plan on rents tracking national, not racing it.
Negotiation context
- Only 0 days on market — expect competitive offers; lowballing is unlikely to land.
Risks & watch-outs
- Watch-outs: built in 1950 — expect roof / HVAC / electrical / plumbing capex.
- Climate carrying-cost: extreme-heat days projected 8→23/yr by 2055 (HVAC capex compounding) — expect insurance premiums to compound above CPI over the hold.
Questions for the listing agent
- Built in 1950 — when were the roof, HVAC, electrical panel, plumbing, and water heater last replaced?
- Is there a deadline driving the sale (1031 exchange, divorce, estate, relocation)? That informs how much negotiation room exists.
- What's the average days-on-market for RENTAL listings here right now (not sales)? A rising rental-DOM trend means longer vacancies and softer asking-rent achievability than the comps imply.
- What's the recent tenant-quality profile in this submarket — average credit score on applications, eviction rate, late-payment / NSF rate, and stable-employment percentage? A property-management company in the area should have these aggregated.
- How much new for-sale + rental construction is in the pipeline within 1–3 miles? Heavy new supply typically softens prices + rents 12–24 months out; constrained supply supports both.
Investment metrics
- 1% rule
- 1.04% ✓
- Cap rate
- 9.04%
- Cash-on-cash
- 9.83%
- DSCR
- 1.44
- GRM
- 8.0
CMA / ARV
- ARV (on-the-fly)
- $392,600
- Comps found
- 12
Show comp detail 12 sales within ~0.75 mi
| Address | Dist | Beds/Ba | Sqft | Sold | Price | $/sf | Match |
|---|---|---|---|---|---|---|---|
| 580 W Worthington Rd | 0.00mi | 3/1.0 | 1,300 (0%) | 0mo | $225,000 | $173 | 100 |
| 502 Cindy Ct | 0.21mi | 3/2.0 | 1,366 (+5%) | 0mo | $430,000 | $315 | 77 |
| 581 Lee Rd #583 | 0.21mi | 3/2.0 | 1,408 (+8%) | 17mo | $456,000 | $324 | 58 |
| 516 Shirlene Ct | 0.36mi | 3/2.0 | 1,366 (+5%) | 22mo | $412,500 | $302 | 53 |
| 506 Shirlene Ct | 0.27mi | 4/2.0 (+1) | 1,380 (+6%) | 19mo | $405,000 | $293 | 52 |
| 621 N D St | 0.65mi | 3/2.0 | 1,200 (-8%) | 4mo | $320,000 | $267 | 50 |
| 511 Quail Ct | 0.50mi | 4/2.0 (+1) | 1,455 (+12%) | 0mo | $452,500 | $311 | 48 |
| 508 W 11th St | 0.61mi | 3/2.0 | 1,184 (-9%) | 9mo | $250,000 | $211 | 45 |
| 662 W Lee Rd | 0.45mi | 4/2.0 (+1) | 1,411 (+8%) | 19mo | $530,000 | $376 | 40 |
| 508 Helen Ct | 0.48mi | 4/2.0 (+1) | 1,424 (+10%) | 16mo | $425,000 | $298 | 40 |
| 508 N E St | 0.69mi | 3/2.5 | 1,381 (+6%) | 16mo | $322,000 | $233 | 38 |
| 2655 Olivenite St | 0.58mi | 3/2.0 | 1,166 (-10%) | 18mo | $406,000 | $348 | 37 |
Match score weights: distance 35% · size 25% · config 20% · recency 20%. Top-matched comps best support the ARV.
Projected returns pro-forma
-3.0% appreciation · 3.0% rent growth · sell at horizon
- IRR
- -1.6%
- Equity multiple
- 0.94×
- Total profit
- $-3,707
- Equity at exit
- $33,548
- IRR
- 8.1%
- Equity multiple
- 1.61×
- Total profit
- $38,659
- Equity at exit
- $19,454
Cash invested: $63,000 (down + closing). Projections, not guarantees.
Landlord ↔ Tenant lean methodology
- Overall (STATE)
- 18 Strongly Tenant-Friendly
- State California
- 18 Strongly Tenant-Friendly · D+13
- County
- — inherits STATE
- City
- — inherits STATE
ZIP-level market 92251
- Home prices YoY
- -9.8%
- Active inventory
- 114
- Price-to-rent
- 8.0×
Monthly cashflow live
- Estimated rent
- $2,334 medium interval (Pro) →
- Mortgage (P&I)
- −$1,180
- Tax from tax record
- −$55 /mo · $656/yr
- Insurance
- −$94
- HOA
- −$0
- Vacancy / Maint / Mgmt
- −$490
- Net cashflow
- $516
Break-even live
Sensitivity live
| Price | -10% $643 | -5% $580 | +0% $516 | +5% $452 | +10% $389 |
|---|---|---|---|---|---|
| Rent | -10% $331 | -5% $424 | +0% $516 | +5% $608 | +10% $700 |
| Rate | -1.0pp $629 | -0.5pp $573 | base $516 | +0.5pp $458 | +1.0pp $398 |
UW: 25.0% down · 7.5% · 30yr · 1.5% tax · 5.0% vac · 8.0% maint · 8.0% mgmt
Financing live
Cash to close
- Down payment
- $56,250
- Closing costs
- $6,750
- Reserves months
- —
- Total cash needed
- —
Loan-product check · same deal, 3 products live
Conventional
25% down · 7.5% · 30yr
- Down + closing
- —
- Monthly P&I
- —
- Monthly cashflow
- —
- DSCR
- —
- Eligible?
- —
Personal DTI + credit; lowest rate.
DSCR
20% down · 8.5% · 30yr
- Down + closing
- —
- Monthly P&I
- —
- Monthly cashflow
- —
- DSCR
- —
- Eligible?
- —
No personal income docs; deal must DSCR.
Hard money
10% down · 12.0% · 12mo
- Down + closing
- —
- Monthly P&I
- —
- Monthly cashflow
- —
- DSCR
- —
- Eligible?
- —
Short-term bridge; refi at stabilization.
Rent comps 3 comps
| Address | Beds | Baths | Sqft | Rent | $/sqft | DOM | Units | Dist |
|---|---|---|---|---|---|---|---|---|
| 113 S E St Unit Main House Imperial, CA | 3.0 | 2.0 | 1260 | $2,000 | $1.59 | 44d | 1 | 0.58mi |
| 642 Brewer Rd Imperial, CA | 3.0 | 2.5 | 1550 | $2,300 | $1.48 | 44d | 1 | 0.62mi |
| 1100 Rodeo Dr #745 Imperial, CA | 3.0 | 2.0 | 1165 | $2,100 | $1.80 | 44d | 1 | 1.25mi |
Listing history 2 events
-
2026-06-07remarks 95-char remark
-
2026-06-07$225,000 Pending
ⓘ Source: listings_history table (triggers on properties + properties_extension) + one-shot
backfill from property_details.listing_events for pre-trigger history.
Tax reassessment forecast CA · Resets to sale price
- Current annual tax
- $656 · $55/mo
- Projected year-2 tax
- $1,710 · $142/mo
- Expected delta
- +$1,054/yr (+$88/mo · 160.6%)
ⓘ Screening estimate from a state-policy table — verify with the county assessor before closing.
Climate risk First Street
- Flood 1/10 Low FEMA zone X (unshaded) · 0% chance over 30 yrs
- Wildfire 3/10 Moderate
- Heat 10/10 Extreme 8 d/yr ≥114°F today · 23 d/yr by 30 yrs out
- Wind 1/10 Low
- Air quality 3/10 Moderate 2 unhealthy d/yr today · 3 by 30 yrs out
Nearby sold comps map
Loading sold comps map…
Walkable amenities ~0.75 mi
Loading nearby amenities…
Taxation est. · year 1
- Rental income
- $28,014
- − Mortgage interest
- −$12,603
- − Property taxes
- −$656
- − Insurance
- −$1,125
- − Repairs & maintenance
- −$2,241
- − Management
- −$2,241
- − Depreciation
- −$6,545
- Taxable income
- $2,601
- Est. tax owed @ 24.0%
- −$624
- After-tax cash flow
- $5,566/yr
For passive investors: Depreciation is non-cash, so a rental often shows a tax loss while cash-flowing — sheltering income. Rental losses are passive: they offset passive income freely, and up to $25,000/yr can offset ordinary (W-2) income if you actively participate and your MAGI is under $100k (phasing out to $0 by $150k); unused losses carry forward. On sale, claimed depreciation is recaptured at up to 25%, and gains may owe capital-gains tax (a 1031 exchange can defer both). Figures are a year-1 estimate at your 24.0% rate — not tax advice; consult a CPA.
Schools (NCES district)
- District
- Imperial Unified
- NCES district ID
- 0618210
- Math proficiency
- 21% ▼ -21.00%
- Reading proficiency
- 44% ▼ -16.00%
- Median HH income
- $66,775
- Composite
- 29.79/100
- National rank
- #6424
- State rank
- #281 of 517 in CA
Livability — Imperial
- Score
- 68/100
- State rank
- #286
- US rank
- #9731
Category grades
Schools grade is shown separately in the Schools card above.
Census & demographics
- County
- Imperial County · 104,838 people
- City population
- 27,454
- Metro
- El Centro, CA
- Population (ZIP)
- 27,454
- Household income
- $90,709
- Rent vs Own
- Severe rent burden
- 410.0
Population outlook (Imperial County) Hauer SSP2
- Today (2025)
- 186,713 people
- By 2030
- 190,022 · +1.8%
- By 2040
- 195,993 · +5.0%
- By 2050
- 199,534 · +6.9%
- By 2075
- 216,878 · +16.2%
- By 2100
- 352,705 · +88.9%
Race, ethnicity, and origin ACS 2023
- Neighborhood character
- Predominantly Hispanic (83%)
- Race & ethnicity
- Hispanic / Latino 83% Two or more races 30% White 10% Asian 3% Black 3%
- Hispanic origin (detail)
- Mexican 80%
- Common ancestry
- Slovak 1%
- Foreign-born
- 24% · Canada, South Korea, Vietnam
- Languages at home
- 34% English-only · Spanish 63% Korean 1% Arabic 1%
Political lean MEDSL · Imperial
- 2024 margin
- Toss-up / Even · D 48.3% · R 49.1% · Other 2.6%
- 2008→2024 swing
- -27.0pp toward R · 2008: 26.2pp · 2024: -0.9pp
- All cycles
- 2024: R+0.9 2020: D+24.4 2016: D+41.1 2012: D+28.8 2008: D+26.2
Not yet ingested
- Civics
- —
Market trends
- HPI YoY
- ▼ -41.26%
- Current HPI
- 380.9947
- Rent YoY
- —
- Metro
- El Centro, CA
- State GDP YoY
- ▲ 3.21%
- F500 in state
- 116
Industry mix (Fortune 500 HQ in CA)
| Industry | F500 HQs | Revenue |
|---|---|---|
| Technology | 27 | $1,492B |
|
||
| Financial Services | 3 | $174B |
|
||
| Retail | 3 | $44B |
|
||
| Insurance | 3 | $26B |
|
||
| Media / Entertainment | 2 | $115B |
|
||
| Pharmaceuticals / Biotech | 2 | $62B |
|
||
Price history
2 events — show timeline
- 2026-06-04 Delisted — ICAOR
- 2026-06-04 Listed $225,000 ICAOR
Property tax history
+1.9%/yrLatest (2025): $656 · +1.5% YoY. Source: county tax records.
Cash-flow waterfall
monthlySold comps — $/sqft
last 12 mo · ≤1 miLoading sold comps…