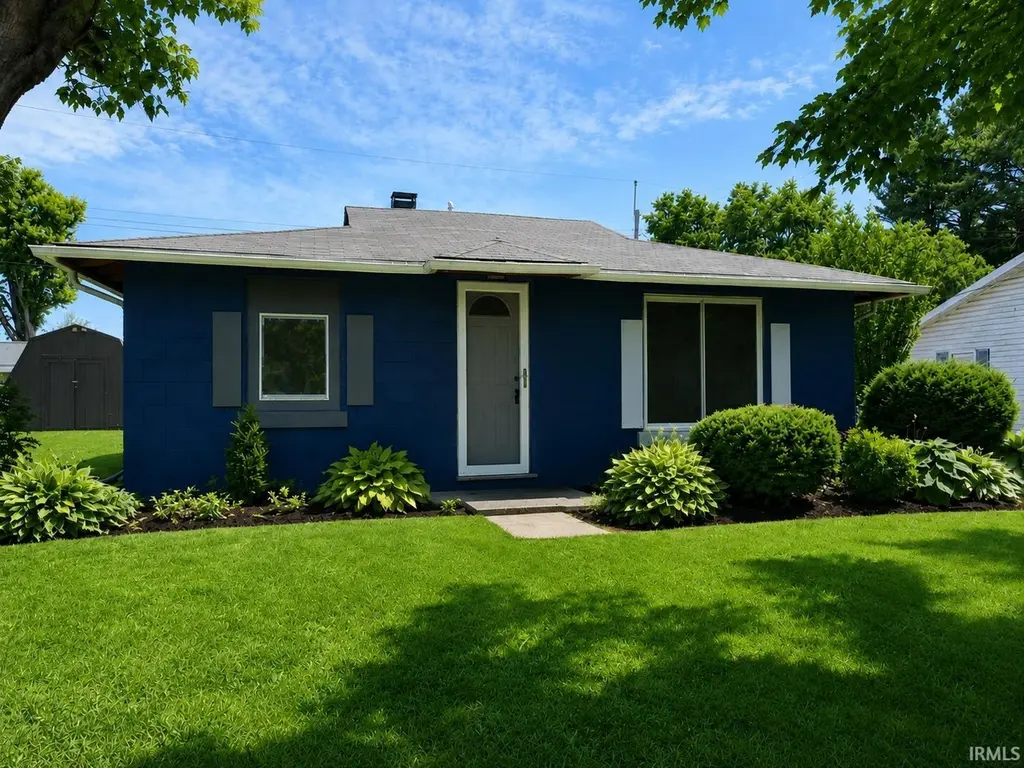
400 W Norway Rd · Norway, IN
Flood risk 7/10 · Major
- FEMA flood zone
- X (unshaded)
- Chance of flooding over 30 yrs
- 0.95%
- Est. flood insurance / yr
- $507 – $1,088
Fire risk 1/10 · Minimal
- Est. fire insurance / yr
- $717 – $1,331
Heat risk 3/10 · Minor
- Hot days now (above 101°F)
- 7 days/yr
- Hot days in 30 yrs
- 17 days/yr
Wind risk 2/10 · Minimal
- Chance of severe wind over 30 yrs
- —
Air-quality risk 2/10 · Minimal
- Unhealthy air days now
- 1 days/yr
- Unhealthy air days in 30 yrs
- 2 days/yr
Risk factors via First Street. Map © Google.
Why this score? — see what drove the C+ grade
The composite is a weighted blend of 9 inputs, each scored 0–100. Each bar is that input's sub-score; the figure is the points it added to the 100-point composite (weight × sub-score).
- Cash flow +23.7/30.0
- ARV discount +15.0/15.0
- DSCR +7.6/10.0
- 1% rule +4.8/10.0
- Schools +3.6/10.0
- Livability +2.7/5.0
- Rent growth +2.5/5.0
- Condition / age +2.5/5.0
- Appreciation +0.0/10.0
$109,900
🖨 Deal sheet 📄 Offer letter ✓ Due diligence
Listing remarks
this nice concrete block home is a great investment. with 2 possible 3 bedrooms this home offers alot of options
Key facts
- 6,534 sq ft lot
- Built 1943
- Listed 6 days
Property features AI
Finance
- HOA & community: No association amenities
Exterior
- Parking: Gravel driveway
- Utilities: Public water; Public sewer
- Home design: Single-family residence, site-built; One story; 989–993 above-grade finished area (approximate)
- Construction: Block construction; Shingle roof; Slab and concrete perimeter foundation; Built as site-built home
- Exterior features: Deck; Shed(s); Level lot
Interior
- Kitchen: Includes laminate counters
- Bedrooms: Total of 6 rooms (bedroom count not specified)
- Flooring: Carpet; Vinyl
- Bathrooms: 1 full bathroom (main level)
- Heating & cooling: Natural gas forced-air heating; No cooling
- Interior features: Laminate counters; One fireplace
- Laundry & utility: Laundry on main level
Neighborhood map
What this means for you Summary
Snapshot
- This is a 2-bed/1.0-bath single-family listed at $110k.
Deal economics
- At list price, monthly cash flow is $144 ($2k/yr) — positive.
- The deal already cash-flows at list — no discount required.
- To meet the 1% rule (rent ≥ 1% of price), the offer needs to be $108k (2.0% below list).
- Recommended offer: $108k (2.0% below list) — sets the bar for 1% rule.
- Cap rate 8.6% vs local median 2.2% in Norway — top-decile yield for the area; either an underpriced asset or a hidden risk that comps aren't pricing in. Stress-test before assuming the spread holds.
Location & tenants
- Location reads 53/100 on livability (#644 in IN) — a working-class tenant base; expect higher turnover. Strengths: cost of living A+, housing A+, crime A; Watch: amenities F, commute F, employment F.
- Twin Lakes School Corporation (town): math 39% / reading 46% proficiency, ranked #116 of 301 in IN (top 38%) — families likely to look elsewhere, expect single-tenant / working-renter base with shorter leases.
- Zoned schools: Meadowlawn Elementary School (math 36% / reading 37%, grade F, #571 of 994 statewide, top 58%, 567 students, 56% FRL); Roosevelt Middle School (math 38% / reading 47%, grade D-, #98 of 330 statewide, top 30%, 523 students, 67% FRL); Twin Lakes Senior High School (math 37% / reading 62%, grade D, #123 of 369 statewide, top 36%, 674 students, 59% FRL) — zoned schools average 60% FRL vs 41% district-wide (20 pts higher); higher-poverty schools than district average — tighter screening recommended.
- Market conditions: 220 active listings in the ZIP; 1 comparable units currently listed for rent nearby; 47 units permitted in White County in 2024 (0 in 5+ unit buildings).
Forward outlook
- Local home prices are declining (-3.0%/yr); year-one equity from $760 of loan paydown is wiped out by about $3k of value loss. Plan a longer hold.
- White County population projected at -19% by 2050 — secular population decline; favor cash flow + early exit over multi-decade hold.
Negotiation context
- Only 6 days on market — expect competitive offers; lowballing is unlikely to land.
Risks & watch-outs
- Watch-outs: flood insurance adds $66/mo; built in 1943 — expect roof / HVAC / electrical / plumbing capex.
- Climate carrying-cost: major flood risk — expect insurance premiums to compound above CPI over the hold.
Questions for the listing agent
- Built in 1943 — when were the roof, HVAC, electrical panel, plumbing, and water heater last replaced?
- What's the actual annual flood-insurance premium (NFIP or private), and is the property in a SFHA with mandatory coverage?
- Is there a deadline driving the sale (1031 exchange, divorce, estate, relocation)? That informs how much negotiation room exists.
- Schools are F-rated, which usually means shorter tenancies and higher turnover. Who's the typical renter profile here, and what's been the actual vacancy rate?
- What's the average days-on-market for RENTAL listings here right now (not sales)? A rising rental-DOM trend means longer vacancies and softer asking-rent achievability than the comps imply.
- What's the recent tenant-quality profile in this submarket — average credit score on applications, eviction rate, late-payment / NSF rate, and stable-employment percentage? A property-management company in the area should have these aggregated.
- How much new for-sale + rental construction is in the pipeline within 1–3 miles? Heavy new supply typically softens prices + rents 12–24 months out; constrained supply supports both.
Investment metrics
- 1% rule
- 0.98% ✗
- Cap rate
- 8.59%
- Cash-on-cash
- 8.19%
- DSCR
- 1.36
- GRM
- 8.5
CMA / ARV
- ARV (on-the-fly)
- $141,999
- Comps found
- 1
Show comp detail 1 sale within ~0.75 mi
| Address | Dist | Beds/Ba | Sqft | Sold | Price | $/sf | Match |
|---|---|---|---|---|---|---|---|
| 1865 N Francis St | 0.21mi | 2/1.0 | 1,050 (+6%) | 18mo | $149,900 | $143 | 65 |
Match score weights: distance 35% · size 25% · config 20% · recency 20%. Top-matched comps best support the ARV.
Projected returns pro-forma
-3.0% appreciation · 3.0% rent growth · sell at horizon
- IRR
- -7.6%
- Equity multiple
- 0.72×
- Total profit
- $-8,676
- Equity at exit
- $16,386
- IRR
- 1.9%
- Equity multiple
- 1.14×
- Total profit
- $4,160
- Equity at exit
- $9,502
Cash invested: $30,772 (down + closing). Projections, not guarantees.
Landlord ↔ Tenant lean methodology
- Overall (STATE)
- 90 Strongly Landlord-Friendly
- State Indiana
- 90 Strongly Landlord-Friendly · R+11
- County
- — inherits STATE
- City
- — inherits STATE
ZIP-level market 47960
- Home prices YoY
- -17.8%
- Active inventory
- 220
- Price-to-rent
- 8.5×
Monthly cashflow live
- Estimated rent
- $1,077 medium interval (Pro) →
- Mortgage (P&I)
- −$576
- Tax from tax record
- −$19 /mo · $223/yr
- Insurance
- −$46
- Flood insurance flood zone
- −$66 /mo · $798/yr
- HOA
- −$0
- Vacancy / Maint / Mgmt
- −$226
- Net cashflow
- $144
Break-even live
UW: 25.0% down · 7.5% · 30yr · 1.5% tax · 5.0% vac · 8.0% maint · 8.0% mgmt
Financing live
Cash to close
- Down payment
- $27,475
- Closing costs
- $3,297
- Reserves months
- —
- Total cash needed
- —
Loan-product check · same deal, 3 products live
Conventional
25% down · 7.5% · 30yr
- Down + closing
- —
- Monthly P&I
- —
- Monthly cashflow
- —
- DSCR
- —
- Eligible?
- —
Personal DTI + credit; lowest rate.
DSCR
20% down · 8.5% · 30yr
- Down + closing
- —
- Monthly P&I
- —
- Monthly cashflow
- —
- DSCR
- —
- Eligible?
- —
No personal income docs; deal must DSCR.
Hard money
10% down · 12.0% · 12mo
- Down + closing
- —
- Monthly P&I
- —
- Monthly cashflow
- —
- DSCR
- —
- Eligible?
- —
Short-term bridge; refi at stabilization.
Rent comps 1 comps
| Address | Beds | Baths | Sqft | Rent | $/sqft | DOM | Units | Dist |
|---|---|---|---|---|---|---|---|---|
| 1101 Foxwood Ct Monticello, IN | 1.0–3.0 | 1.0–2.0 | 969 | $1,077 | $1.11 | 13d | 7 | 1.50mi |
Listing history 6 events
-
2026-06-18days on market $109,900 Active 6 DOM
-
2026-06-17days on market $109,900 Active 5 DOM
-
2026-06-16days on market $109,900 Active 4 DOM
-
2026-06-15days on market $109,900 Active 3 DOM
-
2026-06-12remarks 112-char remark
-
2026-06-12$109,900 Active 1 DOM
ⓘ Source: listings_history table (triggers on properties + properties_extension) + one-shot
backfill from property_details.listing_events for pre-trigger history.
Tax reassessment forecast IN · Partial reset (capped growth)
- Current annual tax
- $223 · $19/mo
- Projected year-2 tax
- $579 · $48/mo
- Expected delta
- +$355/yr (+$30/mo · 159.1%)
ⓘ Screening estimate from a state-policy table — verify with the county assessor before closing.
Climate risk First Street
- Flood 7/10 Severe FEMA zone X (unshaded) · 95% chance over 30 yrs
- Wildfire 1/10 Low
- Heat 3/10 Moderate 7 d/yr ≥101°F today · 17 d/yr by 30 yrs out
- Wind 2/10 Low
- Air quality 2/10 Low 1 unhealthy d/yr today · 2 by 30 yrs out
Nearby sold comps map
Loading sold comps map…
Walkable amenities ~0.75 mi
Loading nearby amenities…
Taxation est. · year 1
- Rental income
- $12,924
- − Mortgage interest
- −$6,156
- − Property taxes
- −$223
- − Insurance
- −$1,347
- − Repairs & maintenance
- −$1,034
- − Management
- −$1,034
- − Depreciation
- −$3,197
- Taxable loss
- −$67
- Est. tax savings @ 24.0%
- +$16
- After-tax cash flow
- $1,740/yr
For passive investors: Depreciation is non-cash, so a rental often shows a tax loss while cash-flowing — sheltering income. Rental losses are passive: they offset passive income freely, and up to $25,000/yr can offset ordinary (W-2) income if you actively participate and your MAGI is under $100k (phasing out to $0 by $150k); unused losses carry forward. On sale, claimed depreciation is recaptured at up to 25%, and gains may owe capital-gains tax (a 1031 exchange can defer both). Figures are a year-1 estimate at your 24.0% rate — not tax advice; consult a CPA.
Schools (NCES district)
- District
- Twin Lakes School Corporation
- NCES district ID
- 1811580
- Math proficiency
- 39% ▼ -10.00%
- Reading proficiency
- 46% ▼ -5.00%
- Median HH income
- $48,963
- Composite
- 36.44/100
- National rank
- #4666
- State rank
- #116 of 301 in IN
Livability — Norway
- Score
- 53/100
- State rank
- #644
- US rank
- #24336
Category grades
Schools grade is shown separately in the Schools card above.
Census & demographics
- Census place
- Norway, IN
- Population (ZIP)
- 15,313
Population outlook (White County) Hauer SSP2
- Today (2025)
- 23,006 people
- By 2030
- 22,204 · -3.5%
- By 2040
- 20,441 · -11.1%
- By 2050
- 18,711 · -18.7%
- By 2075
- 14,989 · -34.8%
- By 2100
- 10,896 · -52.6%
Race, ethnicity, and origin ACS 2023
- Neighborhood character
- Predominantly White (92%)
- Race & ethnicity
- White 92% Hispanic / Latino 6% Two or more races 3%
- Hispanic origin (detail)
- Mexican 5%
- Common ancestry
- Romanian 4% Iranian 3% Lithuanian 2%
- Foreign-born
- 4% · Canada
- Languages at home
- 94% English-only · Spanish 4%
Political lean MEDSL · White
- 2024 margin
- Solid R (+45.0) · D 26.4% · R 71.4% · Other 2.2%
- 2008→2024 swing
- -36.7pp toward R · 2008: -8.3pp · 2024: -45.0pp
- All cycles
- 2024: R+45.0 2020: R+44.1 2016: R+42.9 2012: R+23.6 2008: R+8.3
Not yet ingested
- Civics
- —
Market trends
- HPI YoY
- ▼ -52.85%
- Current HPI
- 243.8468
- Rent YoY
- —
- Metro
- —
- State GDP YoY
- ▲ 2.90%
- F500 in state
- 18
Industry mix (Fortune 500 HQ in IN)
| Industry | F500 HQs | Revenue |
|---|---|---|
| Industrial Machinery | 2 | $37B |
|
||
| Healthcare | 1 | $177B |
|
||
| Pharmaceuticals | 1 | $45B |
|
||
| Metals / Steel | 1 | $18B |
|
||
| Agriculture | 1 | $17B |
|
||
| Packaging | 1 | $12B |
|
||
Price history
1 event — show timeline
- 2026-06-12 Listed $109,900 IRMLS
Property tax history
+7.9%/yrLatest (2024): $223 · +43.0% YoY. Source: county tax records.
Cash-flow waterfall
monthlySold comps — $/sqft
last 12 mo · ≤1 miLoading sold comps…