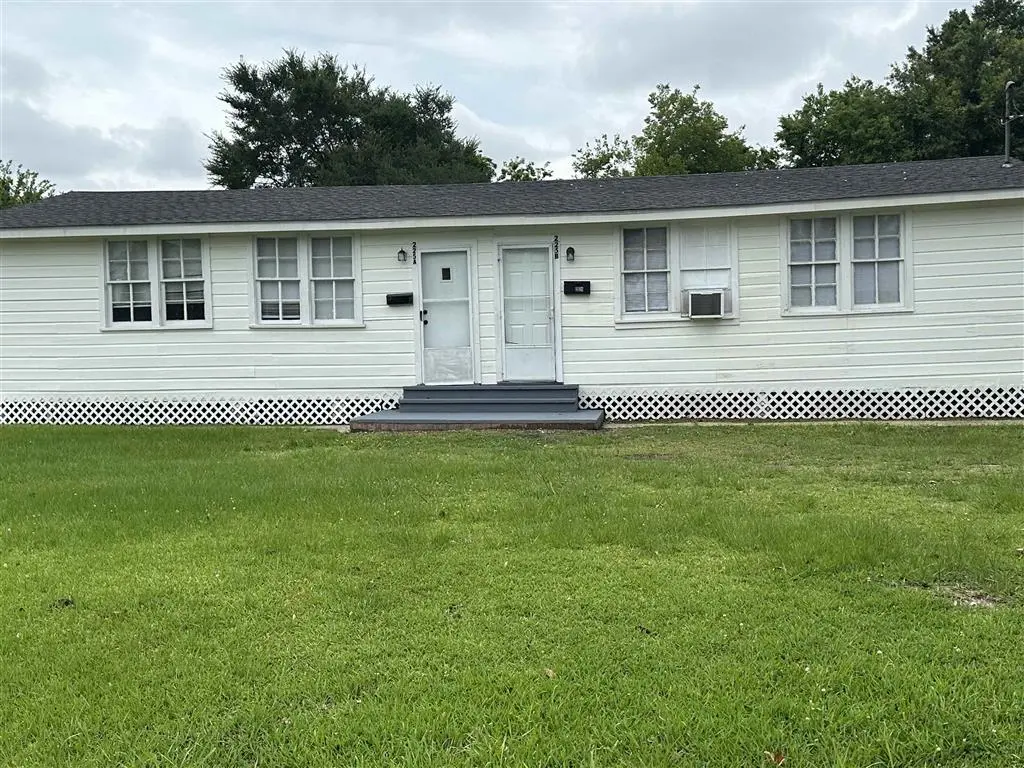
225 Eddy St · Lake Charles, LA
Flood risk 6/10 · Moderate
- FEMA flood zone
- X (shaded)
- Chance of flooding over 30 yrs
- 0.69%
- Est. flood insurance / yr
- $507 – $1,088
Fire risk 1/10 · Minimal
- Est. fire insurance / yr
- $1,269 – $2,357
Heat risk 9/10 · Severe
- Hot days now (above 109°F)
- 7 days/yr
- Hot days in 30 yrs
- 22 days/yr
Wind risk 9/10 · Severe
- Chance of severe wind over 30 yrs
- 99.0%
Air-quality risk 2/10 · Minimal
- Unhealthy air days now
- 1 days/yr
- Unhealthy air days in 30 yrs
- 1 days/yr
Risk factors via First Street. Map © Google.
Why this score? — see what drove the B+ grade
The composite is a weighted blend of 9 inputs, each scored 0–100. Each bar is that input's sub-score; the figure is the points it added to the 100-point composite (weight × sub-score).
- Cash flow +30.0/30.0
- ARV discount +14.4/15.0
- 1% rule +10.0/10.0
- DSCR +10.0/10.0
- Rent growth +4.0/5.0
- Livability +3.4/5.0
- Schools +3.1/10.0
- Condition / age +2.5/5.0
- Appreciation +0.0/10.0
$109,900
🖨 Deal sheet (PDF) 📄 Offer letter ✓ Due diligence
Listing remarks
Investor special! This duplex is located in the heart of Lake Charles close to everything! Each unit has 2 bedrooms and 1 bath, and they are 645 square feet each. Located on a double lot, you have the potential to build an additional duplex on the property. Call today for your private showing!
Key facts
- Double lot
- Potential to build
- Duplex
Tags
Property features AI
Finance
- Other: Directions: From I-210, go north on Ryan, west on Eddy; house will be on the left
Exterior
- Utilities: Public water; Public sewer; Electricity connected; Water connected
- Home design: Duplex; Single-story
- Exterior features: City lot; Rectangular lot; Lot dimensions approximately 121 x 140 (0.389 acres)
Interior
- Bathrooms: 2 full bathrooms
- Heating & cooling: No heating; No cooling
- Interior features: No fireplace
Neighborhood map
What this means for you Summary
Snapshot
- This is a 4-bed/2.0-bath single-family listed at $110k.
Deal economics
- At list price, monthly cash flow is $734 ($9k/yr) — positive.
- The deal already cash-flows at list — no discount required.
- Meets the 1% rule at list price ($2k rent vs $110k).
- Recommended offer: $108k (1.5% below list) — sets the bar for market timing.
- Cap rate 14.3% vs local median 4.3% in Lake Charles — top-decile yield for the area; either an underpriced asset or a hidden risk that comps aren't pricing in. Stress-test before assuming the spread holds.
Location & tenants
- Location reads 68/100 on livability (#95 in LA) — a middle-class / working-renter tenant base. Strengths: commute A+, cost of living A+, housing A+; Watch: crime F, amenities F, employment D-.
- Calcasieu Parish (other): math 30% / reading 44% proficiency, ranked #29 of 98 in LA (top 30%) — families likely to look elsewhere, expect single-tenant / working-renter base with shorter leases.
- Zoned schools: Barbe Elementary School (math 12% / reading 32%, grade F, #415 of 646 statewide, top 67%, 164 students, 84% FRL); Oak Park Middle School (math 10% / reading 22%, grade F, #180 of 218 statewide, top 83%, 385 students, 83% FRL); Alfred M. Barbe High School (math 41% / reading 56%, grade D, #41 of 265 statewide, top 16%, 1,991 students, 41% FRL) — zoned schools average 69% FRL vs 52% district-wide (17 pts higher); higher-poverty schools than district average — tighter screening recommended.
- Market conditions: Rents rising fast (+6.2%/yr); 365 active listings in the ZIP; 12 comparable units currently listed for rent nearby; rentals lingering (median 47d on market — plan ~5-8 weeks vacancy on turnover, expect pricing pressure); 58% of comp listings sitting > 30 days — soft ceiling on asking rent; 1,298 units permitted in Calcasieu Parish in 2024 (526 in 5+ unit buildings).
- This rent runs 42% of the median local income ($50k/yr) — at the standard rent-burdened threshold; future hikes will face affordability resistance.
Forward outlook
- Local home prices are declining (-3.0%/yr); year-one equity from $760 of loan paydown is wiped out by about $3k of value loss. Plan a longer hold.
- Calcasieu County population projected at +11% by 2050 — modest demand growth; plan on rents tracking national, not racing it.
- At projected returns (-3.0% appreciation + 6.2% rent growth), your $31k cash investment doubles in ~4 years — after that, you're playing with house money.
Negotiation context
- It's been on market 30 days — a 2% lower offer ($108k) is reasonable based on typical stale-listing flexibility.
Risks & watch-outs
- Climate carrying-cost: major flood risk; severe wind risk, 99% chance of damaging wind over 30y; extreme-heat days projected 7→22/yr by 2055 (HVAC capex compounding) — expect insurance premiums to compound above CPI over the hold.
Questions for the listing agent
- Built in 1960 — when were the roof, HVAC, electrical panel, plumbing, and water heater last replaced?
- Is there a deadline driving the sale (1031 exchange, divorce, estate, relocation)? That informs how much negotiation room exists.
- Schools are B-rated — typically a magnet for longer-tenancy family renters. What's the average tenant stay here, and is there a school-zone premium baked into asking?
- Crime grade is F in this area — have there been break-ins, vandalism, or insurance claims at this property in the last 3 years? What carrier currently insures it and at what premium?
- What's the average days-on-market for RENTAL listings here right now (not sales)? A rising rental-DOM trend means longer vacancies and softer asking-rent achievability than the comps imply.
- What's the recent tenant-quality profile in this submarket — average credit score on applications, eviction rate, late-payment / NSF rate, and stable-employment percentage? A property-management company in the area should have these aggregated.
- How much new for-sale + rental construction is in the pipeline within 1–3 miles? Heavy new supply typically softens prices + rents 12–24 months out; constrained supply supports both.
Investment metrics
- 1% rule
- 1.61% ✓
- Cap rate
- 14.31%
- Cash-on-cash
- 28.62%
- DSCR
- 2.27
- GRM
- 5.2
CMA / ARV
- ARV (on-the-fly)
- $129,785
- Comps found
- 12
Show comp detail 12 sales within ~0.75 mi
| Address | Dist | Beds/Ba | Sqft | Sold | Price | $/sf | Match |
|---|---|---|---|---|---|---|---|
| 222 W Hale St W | 0.04mi | 3/1.0 (-1) | 1,192 (-7%) | 8mo | $120,000 | $101 | 71 |
| 2404 Stanton St | 0.46mi | 3/1.0 (-1) | 1,296 (+1%) | 4mo | $89,900 | $69 | 65 |
| 2300 Ernest St | 0.54mi | 3/— (-1) | 1,285 (0%) | 9mo | $105,000 | $82 | 62 |
| 2614 Dietz St | 0.29mi | 3/1.0 (-1) | 1,237 (-4%) | 14mo | $65,000 | $53 | 60 |
| 143 Lucille St | 0.18mi | 3/2.0 (-1) | 1,462 (+14%) | 11mo | $229,000 | $157 | 54 |
| 501 Julius St | 0.69mi | 3/1.0 (-1) | 1,246 (-3%) | 15mo | $123,000 | $99 | 41 |
| 707 Fall St | 0.68mi | 3/1.5 (-1) | 1,192 (-7%) | 10mo | $52,000 | $44 | 40 |
| 606 Alamo St | 0.52mi | 3/2.0 (-1) | 1,450 (+13%) | 11mo | $154,000 | $106 | 40 |
| 3101 Center St | 0.63mi | 3/1.0 (-1) | 1,180 (-8%) | 10mo | $119,000 | $101 | 40 |
| 2109 Creole St | 0.72mi | 3/— (-1) | 1,425 (+11%) | 9mo | $173,900 | $122 | 36 |
| 409 Louie St | 0.56mi | 3/2.0 (-1) | 1,153 (-10%) | 21mo | $147,500 | $128 | 34 |
| 423 Blackman St | 0.74mi | 3/1.5 (-1) | 1,145 (-11%) | 11mo | $165,750 | $145 | 32 |
Match score weights: distance 35% · size 25% · config 20% · recency 20%. Top-matched comps best support the ARV.
Projected returns pro-forma
-3.0% appreciation · 6.18% rent growth · sell at horizon
- IRR
- 26.2%
- Equity multiple
- 2.13×
- Total profit
- $34,735
- Equity at exit
- $16,386
- IRR
- 35.6%
- Equity multiple
- 4.76×
- Total profit
- $115,851
- Equity at exit
- $9,502
Cash invested: $30,772 (down + closing). Projections, not guarantees.
Landlord ↔ Tenant lean methodology
- Overall (STATE)
- 90 Strongly Landlord-Friendly
- State Louisiana
- 90 Strongly Landlord-Friendly · R+12
- County
- — inherits STATE
- City
- — inherits STATE
ZIP-level market 70601
- Rents YoY
- 6.2%
- Active inventory
- 365
- Price-to-rent
- 5.2×
Monthly cashflow live
- Estimated rent
- $1,766 high interval (Pro) →
- Mortgage (P&I)
- −$576
- Tax from tax record
- −$39 /mo · $473/yr
- Insurance
- −$46
- HOA
- −$0
- Lot rent
- −$0
- Vacancy / Maint / Mgmt
- −$371
- Net cashflow
- $734
Break-even live
Sensitivity live
| Price | -10% $796 | -5% $765 | +0% $734 | +5% $703 | +10% $672 |
|---|---|---|---|---|---|
| Rent | -10% $594 | -5% $664 | +0% $734 | +5% $804 | +10% $873 |
| Rate | -1.0pp $789 | -0.5pp $762 | base $734 | +0.5pp $705 | +1.0pp $676 |
UW: 25.0% down · 7.5% · 30yr · 1.5% tax · 5.0% vac · 8.0% maint · 8.0% mgmt
Financing live
Cash to close
- Down payment
- $27,475
- Closing costs
- $3,297
- Reserves months
- —
- Total cash needed
- —
Loan-product check · same deal, 3 products live
Conventional
25% down · 7.5% · 30yr
- Down + closing
- —
- Monthly P&I
- —
- Monthly cashflow
- —
- DSCR
- —
- Eligible?
- —
Personal DTI + credit; lowest rate.
DSCR
20% down · 8.5% · 30yr
- Down + closing
- —
- Monthly P&I
- —
- Monthly cashflow
- —
- DSCR
- —
- Eligible?
- —
No personal income docs; deal must DSCR.
Hard money
10% down · 12.0% · 12mo
- Down + closing
- —
- Monthly P&I
- —
- Monthly cashflow
- —
- DSCR
- —
- Eligible?
- —
Short-term bridge; refi at stabilization.
Rent comps 12 comps
| Address | Beds | Baths | Sqft | Rent | $/sqft | DOM | Units | Dist |
|---|---|---|---|---|---|---|---|---|
| 2700 Ernest St Lake Charles, LA | 1.0–3.0 | 1.0–2.0 | 1054 | $1,598 | $1.52 | 16d | 1 | 0.21mi |
| 2116 Creole St Lake Charles, LA | 4.0 | 2.0 | 1305 | $1,500 | $1.15 | 23d | 1 | 0.72mi |
| 1812 Ethel St Lake Charles, LA | 3.0 | 2.0 | 1589 | $3,850 | $2.42 | 46d | 1 | 0.89mi |
| 617 E School St Unit A Lake Charles, LA | 3.0 | 2.0 | 1800 | $2,500 | $1.39 | 46d | 1 | 0.91mi |
| 807 Camelia St Lake Charles, LA | 3.0 | 1.0 | 1322 | $1,500 | $1.13 | 46d | 1 | 0.95mi |
| 3206 Louisiana Ave Lake Charles, LA | 4.0 | 2.0 | 1600 | $1,600 | $1.00 | 16d | 1 | 0.98mi |
| 1731 Elms St Lake Charles, LA | 3.0 | 2.0 | 1575 | $2,000 | $1.27 | 46d | 1 | 0.99mi |
| 417 E Claude St Lake Charles, LA | 4.0 | 1.0 | 1610 | $1,400 | $0.87 | 46d | 1 | 1.02mi |
| 125 East St Lake Charles, LA | 3.0 | 2.0 | 1138 | $3,850 | $3.38 | 46d | 1 | 1.05mi |
| 1710 Granger St Lake Charles, LA | 3.0 | 2.5 | 1450 | $1,900 | $1.31 | 46d | 1 | 1.09mi |
| 930 Azalea St Lake Charles, LA | 4.0 | 2.0 | 1658 | $1,500 | $0.90 | 23d | 1 | 1.11mi |
| 3601 1st Ave Lake Charles, LA | 3.0 | 2.0 | 1512 | $1,295 | $0.86 | 16d | 1 | 1.46mi |
Listing history 19 events
-
2026-06-23days on market $109,900 Active 30 DOM
-
2026-06-21days on market $109,900 Active 29 DOM
-
2026-06-19days on market $109,900 Active 27 DOM
-
2026-06-18days on market $109,900 Active 26 DOM
-
2026-06-17days on market $109,900 Active 25 DOM
-
2026-06-16days on market $109,900 Active 24 DOM
-
2026-06-15days on market $109,900 Active 23 DOM
-
2026-06-14days on market $109,900 Active 21 DOM
-
2026-06-13days on market $109,900 Active 20 DOM
-
2026-06-10days on market $109,900 Active 18 DOM
-
2026-06-09days on market $109,900 Active 17 DOM
-
2026-06-08days on market $109,900 Active 16 DOM
-
2026-06-07days on market $109,900 Active 15 DOM
-
2026-06-05pricedays on market $109,900 Active 12 DOM
-
2026-06-02days on market $115,000 Active 10 DOM
-
2026-06-01days on market $115,000 Active 9 DOM
-
2026-05-31days on market $115,000 Active 8 DOM
-
2026-05-30days on market $115,000 Active 7 DOM
-
2026-05-24$115,000 Active
ⓘ Source: listings_history table (triggers on properties + properties_extension) + one-shot
backfill from property_details.listing_events for pre-trigger history.
Tax reassessment forecast LA · Resets to sale price
- Current annual tax
- $473 · $39/mo
- Projected year-2 tax
- $604 · $50/mo
- Expected delta
- +$131/yr (+$11/mo · 27.7%)
ⓘ Screening estimate from a state-policy table — verify with the county assessor before closing.
Climate risk First Street
- Flood 6/10 Major FEMA zone X (shaded) · 69% chance over 30 yrs
- Wildfire 1/10 Low
- Heat 9/10 Extreme 7 d/yr ≥109°F today · 22 d/yr by 30 yrs out
- Wind 9/10 Extreme 99% chance of damaging wind over 30 yrs
- Air quality 2/10 Low 1 unhealthy d/yr today · 1 by 30 yrs out
Nearby sold comps map
Loading sold comps map…
Walkable amenities ~0.75 mi
Loading nearby amenities…
Taxation est. · year 1
- Rental income
- $21,198
- − Mortgage interest
- −$6,156
- − Property taxes
- −$473
- − Insurance
- −$550
- − Repairs & maintenance
- −$1,696
- − Management
- −$1,696
- − Depreciation
- −$3,197
- Taxable income
- $7,430
- Est. tax owed @ 24.0%
- −$1,783
- After-tax cash flow
- $7,024/yr
For passive investors: Depreciation is non-cash, so a rental often shows a tax loss while cash-flowing — sheltering income. Rental losses are passive: they offset passive income freely, and up to $25,000/yr can offset ordinary (W-2) income if you actively participate and your MAGI is under $100k (phasing out to $0 by $150k); unused losses carry forward. On sale, claimed depreciation is recaptured at up to 25%, and gains may owe capital-gains tax (a 1031 exchange can defer both). Figures are a year-1 estimate at your 24.0% rate — not tax advice; consult a CPA.
Schools (NCES district)
- District
- Calcasieu Parish
- NCES district ID
- 2200330
- Math proficiency
- 30% ▼ -39.00%
- Reading proficiency
- 44% ▼ -33.00%
- Median HH income
- $44,700
- Composite
- 31.45/100
- National rank
- #5979
- State rank
- #29 of 98 in LA
Livability — Lake Charles
- Score
- 68/100
- State rank
- #95
- US rank
- #9820
Category grades
Schools grade is shown separately in the Schools card above.
Census & demographics
- Census place
- Lake Charles, LA
- County
- Calcasieu Parish · 170,889 people
- City population
- 133,538
- Metro
- Lake Charles, LA
- Population (ZIP)
- 30,872
- Household income
- $49,992
- Rent vs Own
- Severe rent burden
- 1304.0
Population outlook (Calcasieu County) Hauer SSP2
- Today (2025)
- 212,179 people
- By 2030
- 218,199 · +2.8%
- By 2040
- 228,486 · +7.7%
- By 2050
- 236,208 · +11.3%
- By 2075
- 251,696 · +18.6%
- By 2100
- 247,848 · +16.8%
Race, ethnicity, and origin ACS 2023
- Neighborhood character
- Diverse neighborhood (Simpson 0.55)
- Race & ethnicity
- Black 59% White 31% Two or more races 7% Hispanic / Latino 5%
- Common ancestry
- Lithuanian 7% Iranian 1% Serbian 1%
- Foreign-born
- 3% · Canada
- Languages at home
- 95% English-only · Spanish 2% French/Haitian/Cajun 1%
Political lean MEDSL · Calcasieu
- 2024 margin
- Solid R (+39.6) · D 29.5% · R 69.0% · Other 1.5%
- 2008→2024 swing
- -15.0pp toward R · 2008: -24.6pp · 2024: -39.6pp
- All cycles
- 2024: R+39.6 2020: R+35.2 2016: R+33.3 2012: R+28.7 2008: R+24.6
Not yet ingested
- Civics
- —
Market trends
- HPI YoY
- ▼ -109.32%
- Current HPI
- 55.6127
- Rent YoY
- ▲ 6.18%
- Metro
- Lake Charles, LA
- State GDP YoY
- ▲ 3.29%
- F500 in state
- 10
Industry mix (Fortune 500 HQ in LA)
| Industry | F500 HQs | Revenue |
|---|---|---|
| Telecommunications | 2 | $23B |
|
||
| Utilities | 1 | $12B |
|
||
| Wholesale / Distribution | 1 | $5B |
|
||
| Advertising | 1 | $2B |
|
||
Price history
1 event — show timeline
- 2026-05-24 Listed $115,000 SWLAR
Property tax history
+0.5%/yrLatest (2025): $473 · +2.4% YoY. Source: county tax records.
Cash-flow waterfall
monthlySold comps — $/sqft
last 12 mo · ≤1 miLoading sold comps…