 Duplex
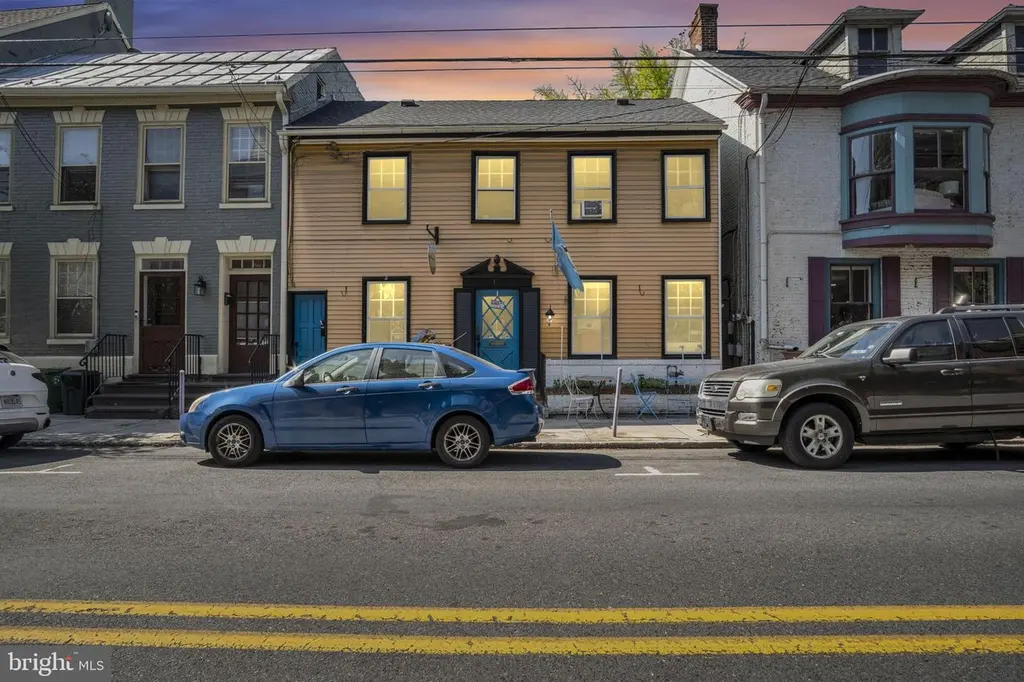
10 W Pomfret St · Carlisle, PA
Flood risk No data
- FEMA flood zone
- —
- Chance of flooding over 30 yrs
- —
- Est. flood insurance / yr
- —
Fire risk No data
- Est. fire insurance / yr
- —
Heat risk No data
- Hot days now (above threshold)
- —
- Hot days in 30 yrs
- —
Wind risk No data
- Chance of severe wind over 30 yrs
- —
Air-quality risk No data
- Unhealthy air days now
- —
- Unhealthy air days in 30 yrs
- —
Risk factors via First Street. Map © Google.
Why this score? — see what drove the C grade
The composite is a weighted blend of 9 inputs, each scored 0–100. Each bar is that input's sub-score; the figure is the points it added to the 100-point composite (weight × sub-score).
- Cash flow +28.7/30.0
- DSCR +10.0/10.0
- 1% rule +7.9/10.0
- Livability +3.9/5.0
- Schools +3.8/10.0
- Rent growth +3.1/5.0
- Condition / age +2.2/5.0
- ARV discount +0.0/15.0
- Appreciation +0.0/10.0
$265,000
🖨 Deal sheet (PDF) 📄 Offer letter ✓ Due diligence
Multi-family units
County records classify this as Multi-Family (2-4 Unit). Listing-text estimate: 2 units. confirmed
Listing remarks
Located in the heart of Carlisle’s Historic District and Central Business District, this mixed-use 2-unit property offers exceptional visibility and some of the highest pedestrian traffic in town. The first floor is occupied by an established restaurant space with strong street presence and outdoor seating, while the second floor features a separately accessed residential apartment. Positioned just steps from Dickinson College, the Square, shops, restaurants, and community events, this property presents an excellent opportunity for investors, owner-operators, or those seeking a downtown live/work setup.
Key facts
- Outdoor seating
- Restaurant space
- Historic district
Tags
Property features AI
Finance
- Financial info: Total of 2 units in the building; Improvement assessed value reported; Land assessed value reported; Property assessed for tax year 2024
Exterior
- Parking: On-street parking
- Utilities: Public water; Public sewer; Electric service with circuit breakers; Natural gas for heating and hot water
- Home design: Semi-detached structure
- Construction: Wood siding and shingle siding; Stick-built construction; Stone foundation; Metal roof; Built year estimated
- Exterior features: Located in downtown Carlisle; No tidal water
Interior
- Bedrooms: Two-bedroom unit included (building contains one two-bedroom unit)
- Heating & cooling: Hot water heating; Window unit(s) for cooling (electric)
- Interior features: Estimated living area
Neighborhood map
What this means for you Summary
Snapshot
- This is a 2 × 2-bed/1-bath units multifamily listed at $265k. Condition is rated fair.
Deal economics
- At list price, monthly cash flow is $878 ($11k/yr) — positive. Per door: $439/mo.
- The deal already cash-flows at list — no discount required.
- Meets the 1% rule at list price ($3k rent vs $265k).
- Recommended offer: $257k (3.0% below list) — sets the bar for market timing.
- Cap rate 10.3% vs local median 3.7% in Carlisle — top-decile yield for the area; either an underpriced asset or a hidden risk that comps aren't pricing in. Stress-test before assuming the spread holds.
Location & tenants
- Location reads 78/100 on livability (#297 in PA, #2,632 nationally) — a middle-class / working-renter tenant base. Strengths: cost of living A+, housing A+, health & safety A+; Watch: employment C-, amenities D, commute F.
- Carlisle Area SD (urban): math 33% / reading 55% proficiency, ranked #277 of 539 in PA (top 51%) — families likely to look elsewhere, expect single-tenant / working-renter base with shorter leases.
- Zoned schools: Carlisle Area Hs (math 70% / reading 75%, grade B+, #37 of 437 statewide, top 8%, 1,578 students, 39% FRL).
- Zoned-school proficiency averages 72% at this address vs 44% district-wide (+28 pts) — the actual schools serving this property are materially stronger than the Carlisle Area SD average implies; a family-tenant draw the district grade alone would hide.
- Market conditions: Rents rising (+2.5%/yr); 308 active listings in the ZIP; 24 comparable units currently listed for rent nearby; rentals at typical pace (median 24d on market — plan ~3-4 weeks tenant-placement turnaround); 1,052 units permitted in Cumberland County in 2024 (310 in 5+ unit buildings).
- At $3,431/mo this rent would consume 58% of the median local household income ($71k/yr) (locally 1444% of renters already pay >50% of income on rent) — very limited rent-growth headroom before tenants either downsize or default.
Forward outlook
- Local home prices are declining (-3.0%/yr); year-one equity from $2k of loan paydown is wiped out by about $8k of value loss. Plan a longer hold.
- Cumberland County population projected at +17% by 2050 — long-run rental-demand tailwind backs the buy-and-hold thesis.
- At projected returns (-3.0% appreciation + 2.5% rent growth), your $74k cash investment doubles in ~9 years — after that, you're playing with house money.
Negotiation context
- It's been on market 34 days — a 3% lower offer ($257k) is reasonable based on typical stale-listing flexibility.
- 3 sale attempts with the ask held roughly flat each time — persistent listings suggest the price (not the market) is what's stuck; bring a comps-based counter.
Risks & watch-outs
- Watch-outs: built in 1925 — expect roof / HVAC / electrical / plumbing capex.
Questions for the listing agent
- It's been on market 34 days. Have you received any prior offers? Is the seller open to a 3% concession, seller financing, or rate buy-down credit?
- Can we see the unit-by-unit rent roll, current vacancy, and any below-market leases? What's the average tenancy length?
- What capital expenditures (roof, boiler, parking lot, exteriors) have been made in the last 5 years, and what's planned in the next 2?
- Have any recent inspections been done? Can we get a copy of the seller's disclosures and any deferred-maintenance estimates?
- Built in 1925 — when were the roof, HVAC, electrical panel, plumbing, and water heater last replaced?
- Is there a deadline driving the sale (1031 exchange, divorce, estate, relocation)? That informs how much negotiation room exists.
- Schools are B-rated — typically a magnet for longer-tenancy family renters. What's the average tenant stay here, and is there a school-zone premium baked into asking?
- What's the average days-on-market for RENTAL listings here right now (not sales)? A rising rental-DOM trend means longer vacancies and softer asking-rent achievability than the comps imply.
- What's the recent tenant-quality profile in this submarket — average credit score on applications, eviction rate, late-payment / NSF rate, and stable-employment percentage? A property-management company in the area should have these aggregated.
- How much new apartment / multifamily construction is in the pipeline within 1–3 miles? Heavy new supply (>2% of stock underway) typically softens rents 12–24 months out; light construction supports rent growth.
Investment metrics
- 1% rule
- 1.29% ✓
- Cap rate
- 10.27%
- Cash-on-cash
- 14.20%
- DSCR
- 1.63
- GRM
- 6.4
CMA / ARV
- ARV (median comp)
- $199,902
- List price
- $265,000
- Delta
- 32.56%
- Verdict
- OVERPRICED
- Comps
- 20 within 1.0 mi
Show comp detail 4 sales within ~0.75 mi
| Address | Dist | Beds/Ba | Sqft | Sold | Price | $/sf | Match |
|---|---|---|---|---|---|---|---|
| 163 N West St | 0.39mi | 4/— | 1,728 (-4%) | 10mo | $200,000 | $116 | 68 |
| 350 W North St | 0.55mi | 4/4.0 | 1,800 (+0%) | 9mo | $315,000 | $175 | 66 |
| 141 E Louther St | 0.32mi | 3/2.0 (-1) | 1,893 (+6%) | 18mo | $166,250 | $88 | 56 |
| 111 E Pomfret St | 0.18mi | 3/2.0 (-1) | 1,550 (-14%) | 21mo | $147,000 | $95 | 47 |
Match score weights: distance 35% · size 25% · config 20% · recency 20%. Top-matched comps best support the ARV.
Projected returns pro-forma
-3.0% appreciation · 2.54% rent growth · sell at horizon
- IRR
- 4.0%
- Equity multiple
- 1.15×
- Total profit
- $11,453
- Equity at exit
- $39,512
- IRR
- 13.1%
- Equity multiple
- 2.02×
- Total profit
- $75,768
- Equity at exit
- $22,912
Cash invested: $74,200 (down + closing). Projections, not guarantees.
Landlord ↔ Tenant lean methodology
- Overall (STATE)
- 62 Landlord-Friendly
- State Pennsylvania
- 62 Landlord-Friendly · EVEN
- County
- — inherits STATE
- City
- — inherits STATE
ZIP-level market 17013
- Rents YoY
- 2.5%
- Active inventory
- 308
- Price-to-rent
- 12.9×
Monthly cashflow live
- Estimated rent
- $3,431 high interval (Pro) →
- Mortgage (P&I)
- −$1,390
- Tax from tax record
- −$332 /mo · $3,988/yr
- Insurance
- −$110
- HOA
- −$0
- Vacancy / Maint / Mgmt
- −$721
- Net cashflow
- $878
Break-even live
Sensitivity live
| Price | -10% $1,028 | -5% $953 | +0% $878 | +5% $803 | +10% $728 |
|---|---|---|---|---|---|
| Rent | -10% $607 | -5% $743 | +0% $878 | +5% $1,014 | +10% $1,149 |
| Rate | -1.0pp $1,011 | -0.5pp $945 | base $878 | +0.5pp $809 | +1.0pp $740 |
2-unit breakdown (identical units grouped — click to expand)
| Units | Beds | Baths | Est. rent |
|---|---|---|---|
| 2× units | 2 | 1 | $3,430 |
| #1 | 2 | 1 | $1,715 |
| #2 | 2 | 1 | $1,715 |
| Total (2 units) | $3,431 | ||
UW: 25.0% down · 7.5% · 30yr · 1.5% tax · 5.0% vac · 8.0% maint · 8.0% mgmt
Financing live
Cash to close
- Down payment
- $66,250
- Closing costs
- $7,950
- Reserves months
- —
- Total cash needed
- —
Loan-product check · same deal, 3 products live
Conventional
25% down · 7.5% · 30yr
- Down + closing
- —
- Monthly P&I
- —
- Monthly cashflow
- —
- DSCR
- —
- Eligible?
- —
Personal DTI + credit; lowest rate.
DSCR
20% down · 8.5% · 30yr
- Down + closing
- —
- Monthly P&I
- —
- Monthly cashflow
- —
- DSCR
- —
- Eligible?
- —
No personal income docs; deal must DSCR.
Hard money
10% down · 12.0% · 12mo
- Down + closing
- —
- Monthly P&I
- —
- Monthly cashflow
- —
- DSCR
- —
- Eligible?
- —
Short-term bridge; refi at stabilization.
Rent comps 24 comps
| Address | Beds | Baths | Sqft | Rent | $/sqft | DOM | Units | Dist |
|---|---|---|---|---|---|---|---|---|
| 131 Nava CT Carlisle, PA | 2.0–3.0 | 2.0 | 1345 | $1,650 | $1.23 | 14d | 1 | 0.14mi |
| 273 S Hanover St Carlisle, PA | 3.0 | 1.5 | 2373 | $2,225 | $0.94 | 14d | 1 | 0.23mi |
| 230 N Pitt St Carlisle, PA | 3.0 | 1.5 | 1408 | $1,300 | $0.92 | 44d | 1 | 0.38mi |
| 156 E Penn St Carlisle, PA | 3.0 | 3.0 | 1808 | $1,850 | $1.02 | 24d | 1 | 0.45mi |
| 7 Kerrs Ave Carlisle, PA | 4.0 | 1.5 | 1652 | $1,750 | $1.06 | 44d | 1 | 0.47mi |
| 457 N Pitt St Carlisle, PA | 3.0 | 1.0 | 1320 | $1,345 | $1.02 | 24d | 1 | 0.55mi |
| 254 Franklin St Carlisle, PA | 4.0 | 1.5 | 1620 | $2,250 | $1.39 | 14d | 1 | 0.59mi |
| 495 S Spring Garden St Unit 302 Carlisle, PA | 4.0 | 2.5 | 1625 | $1,735 | $1.07 | 44d | 1 | 0.65mi |
| 495 S Spring Garden St #109 Carlisle, PA | 4.0 | 2.5 | 1625 | $2,150 | $1.32 | 24d | 1 | 0.65mi |
| 495 S Spring Garden St #308 Carlisle, PA | 4.0 | 2.5 | 1625 | $1,835 | $1.13 | 44d | 1 | 0.65mi |
| 495 S Spring Garden St #202 Carlisle, PA | 4.0 | 2.5 | 1625 | $2,050 | $1.26 | 24d | 1 | 0.65mi |
| 79 Dawn Ridge Loop Carlisle, PA | 2.0–3.0 | 1.0–1.5 | 1179 | $1,474 | $1.25 | 14d | 4 | 0.69mi |
| 630 N West St Carlisle, PA | 3.0 | 1.5 | 1686 | $1,675 | $0.99 | 24d | 1 | 0.72mi |
| 238 C St Carlisle, PA | 3.0 | 1.0 | 1452 | $1,452 | $1.00 | 14d | 2 | 0.76mi |
| 646 N College St Carlisle, PA | 3.0 | 2.5 | 1500 | $1,795 | $1.20 | 14d | 1 | 0.77mi |
| 206 Alfalfa Dr CARLISLE BRKS, PA | 4.0 | 2.5 | 1625 | $2,050 | $1.26 | 24d | 1 | 0.84mi |
| 308 Alfalfa Dr CARLISLE BRKS, PA | 4.0 | 2.5 | 1625 | $2,150 | $1.32 | 24d | 1 | 0.84mi |
| 0 H St Unit 1-11 Carlisle, PA | 4.0 | 2.5 | 1625 | $2,300 | $1.42 | 44d | 1 | 1.06mi |
| 0 H St Unit 1-08 Carlisle, PA | 4.0 | 2.5 | 1625 | $2,200 | $1.35 | 24d | 1 | 1.06mi |
| 9 Heather Cir CARLISLE BRKS, PA | 4.0 | 2.5 | 1625 | $2,200 | $1.35 | 24d | 1 | 1.15mi |
| 16 Brook Side Dr Carlisle, PA | 3.0 | 2.5 | 1632 | $1,975 | $1.21 | 14d | 1 | 1.16mi |
| 134 Sable Dr Carlisle, PA | 3.0 | 2.5 | 1629 | $2,100 | $1.29 | 14d | 1 | 1.18mi |
| 1142 Redwood Dr Carlisle, PA | 3.0 | 2.5 | 1344 | $1,495 | $1.11 | 24d | 1 | 1.26mi |
| 15 Parker Spring Ave Carlisle, PA | 3.0 | 2.5 | 1810 | $2,300 | $1.27 | 14d | 1 | 1.45mi |
Listing history 19 events
-
2026-06-18days on market $265,000 Active 34 DOM
-
2026-06-17days on market $265,000 Active 33 DOM
-
2026-06-16days on market $265,000 Active 32 DOM
-
2026-06-15days on market $265,000 Active 31 DOM
-
2026-06-14days on market $265,000 Active 29 DOM
-
2026-06-10days on market $265,000 Active 26 DOM
-
2026-06-09days on market $265,000 Active 25 DOM
-
2026-06-08days on market $265,000 Active 24 DOM
-
2026-06-07days on market $265,000 Active 23 DOM
-
2026-06-03days on market $265,000 Active 19 DOM
-
2026-06-02days on market $265,000 Active 18 DOM
-
2026-06-01days on market $265,000 Active 17 DOM
-
2026-05-31days on market $265,000 Active 16 DOM
-
2026-05-31days on market $265,000 Active 15 DOM
-
2026-05-15$265,000 Active 616-char remark
-
2025-12-31historical
-
2025-11-14status Active
-
2025-10-16historical Active Under Contract
-
2025-07-28$274,900 Active
ⓘ Source: listings_history table (triggers on properties + properties_extension) + one-shot
backfill from property_details.listing_events for pre-trigger history.
Tax reassessment forecast PA · Partial reset (capped growth)
- Current annual tax
- $3,988 · $332/mo
- Projected year-2 tax
- $4,088 · $341/mo
- Expected delta
- +$99/yr (+$8/mo · 2.5%)
ⓘ Screening estimate from a state-policy table — verify with the county assessor before closing.
Nearby sold comps map
Loading sold comps map…
Walkable amenities ~0.75 mi
Loading nearby amenities…
Taxation est. · year 1
- Rental income
- $41,172
- − Mortgage interest
- −$14,844
- − Property taxes
- −$3,988
- − Insurance
- −$1,325
- − Repairs & maintenance
- −$3,294
- − Management
- −$3,294
- − Depreciation
- −$7,709
- Taxable income
- $6,718
- Est. tax owed @ 24.0%
- −$1,612
- After-tax cash flow
- $8,924/yr
For passive investors: Depreciation is non-cash, so a rental often shows a tax loss while cash-flowing — sheltering income. Rental losses are passive: they offset passive income freely, and up to $25,000/yr can offset ordinary (W-2) income if you actively participate and your MAGI is under $100k (phasing out to $0 by $150k); unused losses carry forward. On sale, claimed depreciation is recaptured at up to 25%, and gains may owe capital-gains tax (a 1031 exchange can defer both). Figures are a year-1 estimate at your 24.0% rate — not tax advice; consult a CPA.
Condition & rehab AI · 13 photos
This property requires moderate renovations to improve its condition and increase its value. The kitchen and exterior are in poor condition and need significant repairs.
Repairs flagged
- Major Kitchen counters — Severely worn and need replacement
- Major Appliances — Outdated and need replacement
- Major Exterior siding — Worn and need repainting
- Major Exterior paint — Peeling and need repainting
- Major Flooring — Worn and need replacement
Value-add opportunities
- Both Replace kitchen counters and appliances — Modernizing the kitchen will attract more buyers and renters
- Both Paint exterior and replace siding — A fresh exterior will improve curb appeal and attract more buyers
- Both Replace flooring — Fresh flooring will improve the overall look and feel of the home
Renovation cost estimate screening
| Repair item | Severity | Est. cost |
|---|---|---|
| Kitchen counters · Severely worn and need replacement | Major | $15,000–50,000 |
| Appliances · Outdated and need replacement | Major | $15,000–50,000 |
| Exterior siding · Worn and need repainting | Major | $15,000–50,000 |
| Exterior paint · Peeling and need repainting | Major | $15,000–50,000 |
| Flooring · Worn and need replacement | Major | $15,000–50,000 |
| Total estimated repair cost · 5 items | $75,000–250,000 |
Value-add ROI direction
- Both Replace kitchen counters and appliances — Modernizing the kitchen will attract more buyers and renters ↑
- Both Paint exterior and replace siding — A fresh exterior will improve curb appeal and attract more buyers ↑
- Both Replace flooring — Fresh flooring will improve the overall look and feel of the home ↑
ⓘ Cost ranges are severity-bucket heuristics (US national rule-of-thumb). Get contractor quotes + a written scope before underwriting a rehab budget.
Schools (NCES district)
- District
- Carlisle Area SD
- NCES district ID
- 4205010
- Math proficiency
- 33% ▼ -14.00%
- Reading proficiency
- 55% ▼ -10.00%
- Median HH income
- $55,334
- Composite
- 38.23/100
- National rank
- #4247
- State rank
- #277 of 539 in PA
Livability — Carlisle
- Score
- 78/100
- State rank
- #297
- US rank
- #2632
Category grades
Schools grade is shown separately in the Schools card above.
Census & demographics
- Census place
- Carlisle, PA
- County
- Cumberland County · 257,673 people
- City population
- 62,898
- Metro
- Harrisburg-Carlisle, PA
- Population (ZIP)
- 38,513
- Household income
- $71,042
- Rent vs Own
- Severe rent burden
- 1444.0
Population outlook (Cumberland County) Hauer SSP2
- Today (2025)
- 267,950 people
- By 2030
- 278,105 · +3.8%
- By 2040
- 296,552 · +10.7%
- By 2050
- 312,937 · +16.8%
- By 2075
- 349,233 · +30.3%
- By 2100
- 361,875 · +35.1%
Race, ethnicity, and origin ACS 2023
- Neighborhood character
- Predominantly White (79%)
- Race & ethnicity
- White 79% Black 8% Hispanic / Latino 7% Two or more races 6% Asian 3%
- Hispanic origin (detail)
- Puerto Rican 3% Dominican 1%
- Common ancestry
- Iranian 3% Romanian 3% Lithuanian 2%
- Foreign-born
- 7% · Canada, Vietnam
- Languages at home
- 91% English-only · Spanish 3% Russian/Polish/Slavic 1% Arabic 1%
Political lean MEDSL · Cumberland
- 2024 margin
- Lean R (+9.4) · D 44.6% · R 54.1% · Other 1.3%
- 2008→2024 swing
- +4.2pp toward D · 2008: -13.6pp · 2024: -9.4pp
- All cycles
- 2024: R+9.4 2020: R+10.6 2016: R+18.6 2012: R+18.5 2008: R+13.6
Not yet ingested
- Civics
- —
Market trends
- HPI YoY
- ▼ -140.48%
- Current HPI
- 247.337
- Rent YoY
- ▲ 2.54%
- Metro
- Harrisburg-Carlisle, PA
- State GDP YoY
- ▲ 1.68%
- F500 in state
- 34
Industry mix (Fortune 500 HQ in PA)
| Industry | F500 HQs | Revenue |
|---|---|---|
| Healthcare | 2 | $309B |
|
||
| Insurance | 2 | $27B |
|
||
| Telecommunications / Media | 1 | $124B |
|
||
| Industrial Distribution | 1 | $22B |
|
||
| Financial Services | 1 | $20B |
|
||
| Chemicals / Materials | 1 | $18B |
|
||
Price history
-3.6% since first listed5 events — show timeline
- 2026-05-15 Listed $265,000 BRIGHT MLS
- 2025-12-31 Listing Removed — BRIGHT MLS
- 2025-11-14 Relisted — BRIGHT MLS
- 2025-10-16 Contingent — BRIGHT MLS
- 2025-07-28 Listed $274,900 BRIGHT MLS
Property tax history
+2.1%/yrLatest (2026): $3,988 · +2.1% YoY. Source: county tax records.
Cash-flow waterfall
monthlySold comps — $/sqft
last 12 mo · ≤1 miLoading sold comps…