12629 County Road 1054 · Wylie, TX
Flood risk 1/10 · Minimal
- FEMA flood zone
- X (unshaded)
- Chance of flooding over 30 yrs
- 0.0%
- Est. flood insurance / yr
- $507 – $1,088
Fire risk 4/10 · Minor
- Est. fire insurance / yr
- $1,222 – $2,270
Heat risk 7/10 · Major
- Hot days now (above 111°F)
- 7 days/yr
- Hot days in 30 yrs
- 23 days/yr
Wind risk 6/10 · Moderate
- Chance of severe wind over 30 yrs
- 27.0%
Air-quality risk 3/10 · Minor
- Unhealthy air days now
- 3 days/yr
- Unhealthy air days in 30 yrs
- 3 days/yr
Risk factors via First Street. Map © Google.
Why this score? — see what drove the D+ grade
The composite is a weighted blend of 9 inputs, each scored 0–100. Each bar is that input's sub-score; the figure is the points it added to the 100-point composite (weight × sub-score).
- Cash flow +17.4/30.0
- ARV discount +10.0/15.0
- DSCR +5.4/10.0
- 1% rule +4.6/10.0
- Schools +3.7/10.0
- Livability +3.5/5.0
- Rent growth +2.5/5.0
- Condition / age +2.5/5.0
- Appreciation +0.0/10.0
$199,000
🖨 Deal sheet 📄 Offer letter ✓ Due diligence
Listing remarks
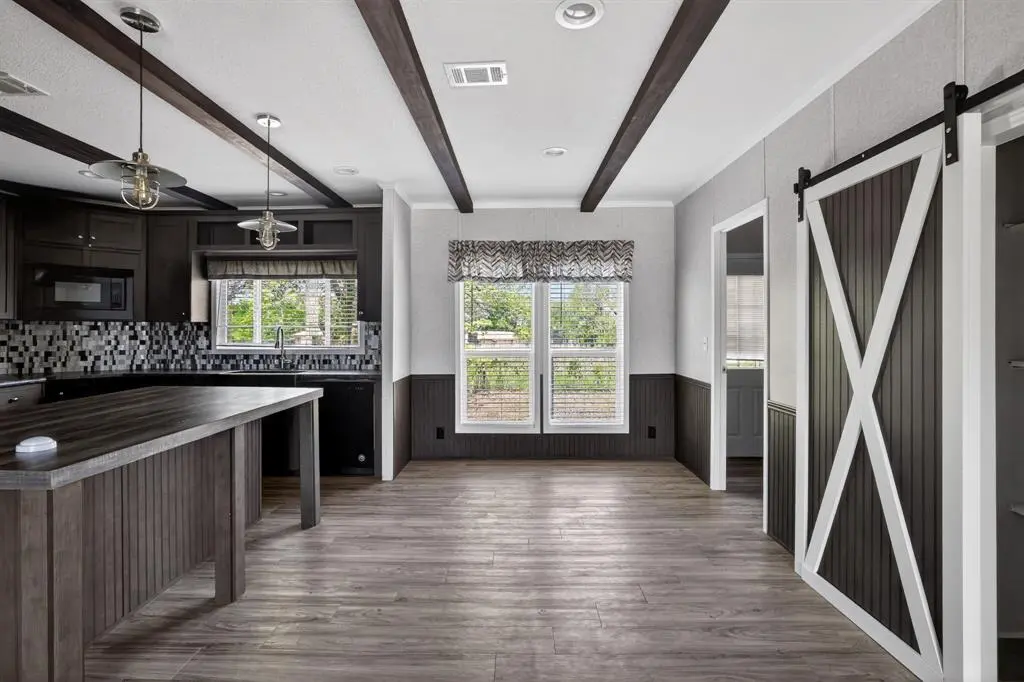
Experience the charm of country living with modern farmhouse style in this move-in ready home located in Farmersville. Built in 2019, this well-maintained 3-bedroom, 2-bath double-wide manufactured home offers 1,440 square feet of thoughtfully designed living space on a . 20-acre lot. Step inside to an inviting open-concept layout featuring stylish finishes, a decorative barn door, farmhouse kitchen sink, and plenty of room for everyday living and entertaining. The spacious primary suite provides a relaxing retreat with a garden tub, double vanity, and ample storage. Outside, enjoy the freedom of your own outdoor space with room to garden, entertain, or create the backyard you've always wan
Key facts
- Decorative barn door
- Outdoor space
- Open-concept layout
Tags
Property features AI
Finance
- Other: Property is standalone (not attached); Parcel: R0778000379A1; County: Collin; Country: United States; Geocode confidence: High
- HOA & community: No association
Exterior
- Parking: Outside parking
- Utilities: City water; Septic; Not in a municipal utility district
- Home design: Mobile home (residential); One level; Preowned (built 2019)
- Construction: Siding exterior; Built in 2019
- Exterior features: Lot under 0.5 acre; Subdivision: Lavon Beach Estates; Directions: Please use GPS
Interior
- Kitchen: Dishwasher; Microwave
- Bedrooms: Primary bedroom (level 1) — 13 x 12; Bedroom (level 1) — 11 x 10; Bedroom (level 1) — 11 x 11
- Bathrooms: 2 full bathrooms
- Interior features: Open floorplan; Eat-in kitchen; Kitchen island; Walk-in closet(s); One living area; One dining area; Total rooms: 4
- Laundry & utility: Utility room; Full-size washer/dryer area; Washer hookup; Washer and dryer included
Neighborhood map
What this means for you Summary
Snapshot
- This is a 3-bed/2.0-bath land listed at $199k.
Deal economics
- At list price, monthly cash flow is $149 ($2k/yr) — positive.
- The deal already cash-flows at list — no discount required.
- To meet the 1% rule (rent ≥ 1% of price), the offer needs to be $191k (4.2% below list).
- Recommended offer: $191k (4.2% below list) — sets the bar for 1% rule.
- Cap rate 7.2% vs local median 4.0% in Wylie — top-decile yield for the area; either an underpriced asset or a hidden risk that comps aren't pricing in. Stress-test before assuming the spread holds.
Location & tenants
- Location reads 69/100 on livability (#419 in TX) — a middle-class / working-renter tenant base. Strengths: crime A+, employment A+, housing A+; Watch: amenities F, commute F, health & safety F.
- Farmersville ISD (town): math 38% / reading 47% proficiency, ranked #298 of 826 in TX (top 36%) — families likely to look elsewhere, expect single-tenant / working-renter base with shorter leases.
- Zoned schools: Tatum El (519 students, 64% FRL) — zoned schools average 64% FRL vs 42% district-wide (22 pts higher); higher-poverty schools than district average — tighter screening recommended.
- Market conditions: 415 active listings in the ZIP; solid renter incomes; 19,194 units permitted in Collin County in 2024 (3,988 in 5+ unit buildings).
Forward outlook
- Local home prices are declining (-3.0%/yr); year-one equity from $1k of loan paydown is wiped out by about $6k of value loss. Plan a longer hold.
- Collin County population projected at +60% by 2050 — long-run rental-demand tailwind backs the buy-and-hold thesis.
Negotiation context
- Only 7 days on market — expect competitive offers; lowballing is unlikely to land.
- 2 sale attempts with the ask held roughly flat each time — persistent listings suggest the price (not the market) is what's stuck; bring a comps-based counter.
Risks & watch-outs
- Climate carrying-cost: major wind risk, 27% chance of damaging wind over 30y; extreme-heat days projected 7→23/yr by 2055 (HVAC capex compounding) — expect insurance premiums to compound above CPI over the hold.
Questions for the listing agent
- Is there a deadline driving the sale (1031 exchange, divorce, estate, relocation)? That informs how much negotiation room exists.
- Schools are B-rated — typically a magnet for longer-tenancy family renters. What's the average tenant stay here, and is there a school-zone premium baked into asking?
- The area grade is low — what's the realistic commute time and amenity access for the typical tenant pool here? Any planned neighborhood developments (good or bad) we should know about?
- What's the average days-on-market for RENTAL listings here right now (not sales)? A rising rental-DOM trend means longer vacancies and softer asking-rent achievability than the comps imply.
- What's the recent tenant-quality profile in this submarket — average credit score on applications, eviction rate, late-payment / NSF rate, and stable-employment percentage? A property-management company in the area should have these aggregated.
- How much new for-sale + rental construction is in the pipeline within 1–3 miles? Heavy new supply typically softens prices + rents 12–24 months out; constrained supply supports both.
Investment metrics
- 1% rule
- 0.96% ✗
- Cap rate
- 7.19%
- Cash-on-cash
- 3.21%
- DSCR
- 1.14
- GRM
- 8.7
CMA / ARV
- ARV (median comp)
- $210,938
- List price
- $199,000
- Delta
- -5.66%
- Verdict
- FAIR
- Comps
- 5 within 1.0 mi
Projected returns pro-forma
-3.0% appreciation · 3.0% rent growth · sell at horizon
- IRR
- -11.2%
- Equity multiple
- 0.59×
- Total profit
- $-22,733
- Equity at exit
- $29,672
- IRR
- -2.0%
- Equity multiple
- 0.87×
- Total profit
- $-7,496
- Equity at exit
- $17,206
Cash invested: $55,720 (down + closing). Projections, not guarantees.
Landlord ↔ Tenant lean methodology
- Overall (STATE)
- 87 Strongly Landlord-Friendly
- State Texas
- 87 Strongly Landlord-Friendly · R+5
- County
- — inherits STATE
- City
- — inherits STATE
ZIP-level market 75442
- Home prices YoY
- -8.3%
- Active inventory
- 415
- Price-to-rent
- 8.7×
Monthly cashflow live
- Estimated rent
- $1,907 medium interval (Pro) →
- Mortgage (P&I)
- −$1,044
- Tax from tax record
- −$231 /mo · $2,768/yr
- Insurance
- −$83
- HOA
- −$0
- Vacancy / Maint / Mgmt
- −$400
- Net cashflow
- $149
Break-even live
UW: 25.0% down · 7.5% · 30yr · 1.5% tax · 5.0% vac · 8.0% maint · 8.0% mgmt
Financing live
Cash to close
- Down payment
- $49,750
- Closing costs
- $5,970
- Reserves months
- —
- Total cash needed
- —
Loan-product check · same deal, 3 products live
Conventional
25% down · 7.5% · 30yr
- Down + closing
- —
- Monthly P&I
- —
- Monthly cashflow
- —
- DSCR
- —
- Eligible?
- —
Personal DTI + credit; lowest rate.
DSCR
20% down · 8.5% · 30yr
- Down + closing
- —
- Monthly P&I
- —
- Monthly cashflow
- —
- DSCR
- —
- Eligible?
- —
No personal income docs; deal must DSCR.
Hard money
10% down · 12.0% · 12mo
- Down + closing
- —
- Monthly P&I
- —
- Monthly cashflow
- —
- DSCR
- —
- Eligible?
- —
Short-term bridge; refi at stabilization.
Listing history 9 events
-
2026-06-18days on market $199,000 Active 7 DOM
-
2026-06-17days on market $199,000 Active 6 DOM
-
2026-06-16days on market $199,000 Active 5 DOM
-
2026-06-15days on market $199,000 Active 4 DOM
-
2026-06-13days on market $199,000 Active 2 DOM
-
2026-06-13remarks 699-char remark
-
2026-06-13days on market $199,000 Active 1 DOM
-
2026-04-21price $199,000 464-char remark
-
2026-04-10$234,900 Active 464-char remark
ⓘ Source: listings_history table (triggers on properties + properties_extension) + one-shot
backfill from property_details.listing_events for pre-trigger history.
Tax reassessment forecast TX · Resets to sale price
- Current annual tax
- $2,768 · $231/mo
- Projected year-2 tax
- $3,642 · $303/mo
- Expected delta
- +$874/yr (+$73/mo · 31.6%)
ⓘ Screening estimate from a state-policy table — verify with the county assessor before closing.
Climate risk First Street
- Flood 1/10 Low FEMA zone X (unshaded) · 0% chance over 30 yrs
- Wildfire 4/10 Moderate
- Heat 7/10 Severe 7 d/yr ≥111°F today · 23 d/yr by 30 yrs out
- Wind 6/10 Major 27% chance of damaging wind over 30 yrs
- Air quality 3/10 Moderate 3 unhealthy d/yr today · 3 by 30 yrs out
Nearby sold comps map
Loading sold comps map…
Walkable amenities ~0.75 mi
Loading nearby amenities…
Taxation est. · year 1
- Rental income
- $22,880
- − Mortgage interest
- −$11,147
- − Property taxes
- −$2,768
- − Insurance
- −$995
- − Repairs & maintenance
- −$1,830
- − Management
- −$1,830
- − Depreciation
- −$5,789
- Taxable loss
- −$1,480
- Est. tax savings @ 24.0%
- +$355
- After-tax cash flow
- $2,144/yr
For passive investors: Depreciation is non-cash, so a rental often shows a tax loss while cash-flowing — sheltering income. Rental losses are passive: they offset passive income freely, and up to $25,000/yr can offset ordinary (W-2) income if you actively participate and your MAGI is under $100k (phasing out to $0 by $150k); unused losses carry forward. On sale, claimed depreciation is recaptured at up to 25%, and gains may owe capital-gains tax (a 1031 exchange can defer both). Figures are a year-1 estimate at your 24.0% rate — not tax advice; consult a CPA.
Schools (NCES district)
- District
- Farmersville ISD
- NCES district ID
- 4819080
- Math proficiency
- 38% ▼ -16.00%
- Reading proficiency
- 47% ▼ -7.00%
- Median HH income
- $56,626
- Composite
- 37.17/100
- National rank
- #4479
- State rank
- #298 of 826 in TX
Livability — Wylie
- Score
- 69/100
- State rank
- #419
- US rank
- #8623
Category grades
Schools grade is shown separately in the Schools card above.
Census & demographics
- County
- Collin County · 1,159,394 people
- City population
- 69,325
- Metro
- Dallas-Fort Worth-Arlington, TX
- Population (ZIP)
- 10,805
- Household income
- $95,250
- Rent vs Own
- Severe rent burden
- 105.0
Population outlook (Collin County) Hauer SSP2
- Today (2025)
- 1,210,074 people
- By 2030
- 1,358,201 · +12.2%
- By 2040
- 1,654,061 · +36.7%
- By 2050
- 1,937,359 · +60.1%
- By 2075
- 2,567,039 · +112.1%
- By 2100
- 2,952,048 · +144.0%
Race, ethnicity, and origin ACS 2023
- Neighborhood character
- Predominantly White (65%)
- Race & ethnicity
- White 65% Hispanic / Latino 25% Two or more races 13% Black 5% Pacific Islander 2%
- Hispanic origin (detail)
- Mexican 20% Puerto Rican 5%
- Common ancestry
- Italian 3% Serbian 2% Romanian 2%
- Foreign-born
- 5% · Canada
- Languages at home
- 84% English-only · Spanish 14% German/W. Germanic 1%
Political lean MEDSL · Collin
- 2024 margin
- R (+11.1) · D 43.1% · R 54.3% · Other 2.6%
- 2008→2024 swing
- +14.4pp toward D · 2008: -25.6pp · 2024: -11.1pp
- All cycles
- 2024: R+11.1 2020: R+4.3 2016: R+17.0 2012: R+31.6 2008: R+25.6
Not yet ingested
- Civics
- —
Market trends
- HPI YoY
- ▼ -27.67%
- Current HPI
- 304.6738
- Rent YoY
- —
- Metro
- Dallas-Fort Worth-Arlington, TX
- State GDP YoY
- ▲ 3.95%
- F500 in state
- 110
Industry mix (Fortune 500 HQ in TX)
| Industry | F500 HQs | Revenue |
|---|---|---|
| Energy | 16 | $1,198B |
|
||
| Technology | 5 | $198B |
|
||
| Engineering / Construction | 4 | $72B |
|
||
| Energy Services | 3 | $60B |
|
||
| Utilities | 3 | $41B |
|
||
| Healthcare | 2 | $330B |
|
||
Price history
-15.3% since first listed3 events — show timeline
- 2026-06-08 Listed $199,000 NTREIS
- 2026-04-21 Price Changed $199,000 NTREIS
- 2026-04-10 Listed $234,900 NTREIS
Property tax history
+11.9%/yrLatest (2025): $2,768 · -2.5% YoY. Source: county tax records.
Cash-flow waterfall
monthlySold comps — $/sqft
last 12 mo · ≤1 miLoading sold comps…