190 Frontera Dr · Bastrop, TX
Flood risk No data
- FEMA flood zone
- —
- Chance of flooding over 30 yrs
- —
- Est. flood insurance / yr
- —
Fire risk No data
- Est. fire insurance / yr
- —
Heat risk No data
- Hot days now (above threshold)
- —
- Hot days in 30 yrs
- —
Wind risk No data
- Chance of severe wind over 30 yrs
- —
Air-quality risk No data
- Unhealthy air days now
- —
- Unhealthy air days in 30 yrs
- —
Risk factors via First Street. Map © Google.
Why this score? — see what drove the D- grade
The composite is a weighted blend of 9 inputs, each scored 0–100. Each bar is that input's sub-score; the figure is the points it added to the 100-point composite (weight × sub-score).
- ARV discount +15.0/15.0
- Cash flow +8.7/30.0
- Livability +3.1/5.0
- 1% rule +2.7/10.0
- Condition / age +2.5/5.0
- DSCR +2.4/10.0
- Schools +2.4/10.0
- Rent growth +2.0/5.0
- Appreciation +0.0/10.0
$339,990
🖨 Deal sheet 📄 Offer letter ✓ Due diligence
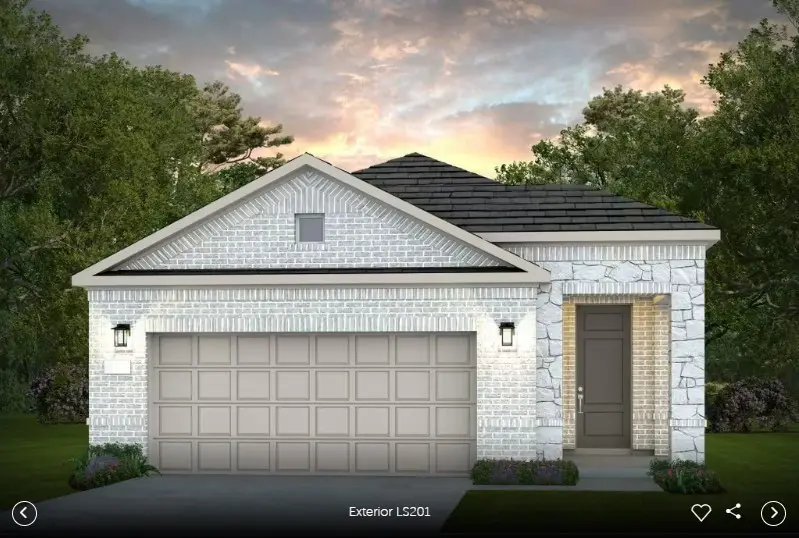
Listing remarks MLS
Relax in the Hallmark floor plan's open kitchen, spacious gathering room, and private primary suite. Explore this welcoming home design at Del Webb Lost Pines.
Key facts
- 5,662 sq ft lot
- 2 garage spots
- Community pool
Neighborhood map
What this means for you Summary
Snapshot
- This is a 3-bed/3.0-bath single-family listed at $340k.
Deal economics
- At list price, monthly cash flow is $-288 ($-3k/yr) — negative.
- To cash-flow at today's rent, offer at most $298k (12.2% below list).
- To meet the 1% rule (rent ≥ 1% of price), the offer needs to be $261k (23.2% below list).
- Recommended offer: $261k (23.2% below list) — sets the bar for 1% rule.
- Cap rate 5.3% vs local median 3.2% in Bastrop — top-decile yield for the area; either an underpriced asset or a hidden risk that comps aren't pricing in. Stress-test before assuming the spread holds.
Location & tenants
- Location reads 62/100 on livability (#947 in TX) — a middle-class / working-renter tenant base. Strengths: housing A+, cost of living A; Watch: amenities D, employment D, crime F.
- Bastrop ISD (rural): math 25% / reading 28% proficiency, ranked #670 of 826 in TX (top 81%) — low school quality limits family demand, transient renter base, plan for 1-2y turnover; 62% free/reduced lunch — lower-income household profile, screen leases tightly.
- Market conditions: Rents soft (-2.0%/yr); 1068 active listings in the ZIP; 9 comparable units currently listed for rent nearby; rentals at typical pace (median 18d on market — plan ~3-4 weeks tenant-placement turnaround); solid renter incomes; 1,841 units permitted in Bastrop County in 2024 (150 in 5+ unit buildings).
- This rent runs 35% of the median local income ($90k/yr) — at the standard rent-burdened threshold; future hikes will face affordability resistance.
Forward outlook
- Local home prices are declining (-3.0%/yr); year-one equity from $2k of loan paydown is wiped out by about $10k of value loss. Plan a longer hold.
- Bastrop County population projected at +37% by 2050 — long-run rental-demand tailwind backs the buy-and-hold thesis.
Negotiation context
- It's been on market 146 days — a 12% lower offer ($299k) is reasonable based on typical stale-listing flexibility.
- 2 sale attempts; this cycle's ask has dropped $101k (23%) from the opening price — seller is motivated, your offer sets the floor, not the list.
Questions for the listing agent
- What do current leases actually rent for vs. the listed asking? Can we see a recent rent roll and the last 12 months of T-12 income?
- It's been on market 146 days. Have you received any prior offers? Is the seller open to a 23% concession, seller financing, or rate buy-down credit?
- What does the HOA fee cover, when was the last increase, and are there any pending special assessments or reserve-fund shortfalls?
- Why hasn't it sold? Are there any deal-killer items the seller is aware of (foundation, flood, title, zoning, code violations)?
- Is there a deadline driving the sale (1031 exchange, divorce, estate, relocation)? That informs how much negotiation room exists.
- Crime grade is F in this area — have there been break-ins, vandalism, or insurance claims at this property in the last 3 years? What carrier currently insures it and at what premium?
- The area grade is low — what's the realistic commute time and amenity access for the typical tenant pool here? Any planned neighborhood developments (good or bad) we should know about?
- What's the average days-on-market for RENTAL listings here right now (not sales)? A rising rental-DOM trend means longer vacancies and softer asking-rent achievability than the comps imply.
- What's the recent tenant-quality profile in this submarket — average credit score on applications, eviction rate, late-payment / NSF rate, and stable-employment percentage? A property-management company in the area should have these aggregated.
- How much new for-sale + rental construction is in the pipeline within 1–3 miles? Heavy new supply typically softens prices + rents 12–24 months out; constrained supply supports both.
Investment metrics
- 1% rule
- 0.77% ✗
- Cap rate
- 5.28%
- Cash-on-cash
- -3.63%
- DSCR
- 0.84
- GRM
- 10.8
CMA / ARV
- ARV (median comp)
- $520,635
- List price
- $339,990
- Delta
- -34.70%
- Verdict
- UNDERPRICED
- Comps
- 20 within 1.0 mi
Show comp detail 12 sales within ~0.75 mi
| Address | Dist | Beds/Ba | Sqft | Sold | Price | $/sf | Match |
|---|---|---|---|---|---|---|---|
| 102 Pinyon Pine Dr | 0.13mi | 4/3.0 (+1) | 2,354 (+1%) | 0mo | $434,874 | $185 | 87 |
| 241 Coleto Trl | 0.35mi | 3/2.0 | 2,229 (-4%) | 3mo | $369,990 | $166 | 70 |
| 109 Coleto Trl | 0.60mi | 3/2.5 | 2,295 (-1%) | 1mo | $329,516 | $144 | 67 |
| 106 Palo Pinto Bnd | 0.26mi | 4/3.5 (+1) | 2,600 (+12%) | 2mo | $574,900 | $221 | 59 |
| 104 Coleto Trl | 0.60mi | 4/2.5 (+1) | 2,376 (+2%) | 3mo | $389,317 | $164 | 59 |
| 160 Coleto Trl | 0.47mi | 4/3.5 (+1) | 2,484 (+7%) | 3mo | $419,471 | $169 | 58 |
| 263 Coleto Trl | 0.28mi | 4/3.5 (+1) | 2,608 (+12%) | 3mo | $384,990 | $148 | 57 |
| 110 Palo Pinto Bnd | 0.27mi | 4/3.0 (+1) | 2,669 (+15%) | 2mo | $525,900 | $197 | 56 |
| 139 Kellogg Ln | 0.48mi | 4/3.0 (+1) | 2,529 (+9%) | 3mo | $525,000 | $208 | 55 |
| 141 Big Pine Creek Ln | 0.70mi | 4/3.0 (+1) | 2,495 (+7%) | 3mo | $485,990 | $195 | 48 |
| 166 Loysoya St | 0.74mi | 4/3.0 (+1) | 2,544 (+9%) | 0mo | $439,900 | $173 | 44 |
| 158 Loysoya St | 0.74mi | 4/3.0 (+1) | 2,544 (+9%) | 1mo | $439,900 | $173 | 44 |
Match score weights: distance 35% · size 25% · config 20% · recency 20%. Top-matched comps best support the ARV.
Projected returns pro-forma
-3.0% appreciation · 0.0% rent growth · sell at horizon
- IRR
- -25.8%
- Equity multiple
- 0.15×
- Total profit
- $-81,030
- Equity at exit
- $50,694
- IRR
- -35.9%
- Equity multiple
- -0.30×
- Total profit
- $-123,575
- Equity at exit
- $29,396
Cash invested: $95,197 (down + closing). Projections, not guarantees.
Landlord ↔ Tenant lean methodology
- Overall (STATE)
- 87 Strongly Landlord-Friendly
- State Texas
- 87 Strongly Landlord-Friendly · R+5
- County
- — inherits STATE
- City
- — inherits STATE
ZIP-level market 78602
- Home prices YoY
- -23.0%
- Rents YoY
- -2.0%
- Active inventory
- 1068
- Price-to-rent
- 10.8×
Monthly cashflow live
- Estimated rent
- $2,613 high interval (Pro) →
- Mortgage (P&I)
- −$1,783
- Tax est. 1.5%
- −$425 /mo · $5,100/yr
- Insurance
- −$142
- HOA
- −$2
- Vacancy / Maint / Mgmt
- −$549
- Net cashflow
- $-288
Break-even live
UW: 25.0% down · 7.5% · 30yr · 1.5% tax · 5.0% vac · 8.0% maint · 8.0% mgmt
Financing live
Cash to close
- Down payment
- $84,998
- Closing costs
- $10,200
- Reserves months
- —
- Total cash needed
- —
Loan-product check · same deal, 3 products live
Conventional
25% down · 7.5% · 30yr
- Down + closing
- —
- Monthly P&I
- —
- Monthly cashflow
- —
- DSCR
- —
- Eligible?
- —
Personal DTI + credit; lowest rate.
DSCR
20% down · 8.5% · 30yr
- Down + closing
- —
- Monthly P&I
- —
- Monthly cashflow
- —
- DSCR
- —
- Eligible?
- —
No personal income docs; deal must DSCR.
Hard money
10% down · 12.0% · 12mo
- Down + closing
- —
- Monthly P&I
- —
- Monthly cashflow
- —
- DSCR
- —
- Eligible?
- —
Short-term bridge; refi at stabilization.
Rent comps 9 comps
| Address | Beds | Baths | Sqft | Rent | $/sqft | DOM | Units | Dist |
|---|---|---|---|---|---|---|---|---|
| 337 Chisholm Trl Bastrop, TX | 3.0 | 2.0 | 2211 | $2,800 | $1.27 | 17d | 1 | 0.19mi |
| 171 Rita Blanca Bnd Bastrop, TX | 3.0 | 2.5 | 2157 | $2,600 | $1.21 | 17d | 1 | 0.48mi |
| 140 Coleto Trl Bastrop, TX | 4.0 | 2.5 | 2858 | $2,850 | $1.00 | 12d | 1 | 0.54mi |
| 131 Rita Blanca Bnd Bastrop, TX | 4.0 | 3.0 | 2295 | $2,600 | $1.13 | 43d | 1 | 0.58mi |
| 114 Maravillas Bnd Bastrop, TX | 3.0 | 2.5 | 1857 | $2,199 | $1.18 | 12d | 1 | 0.61mi |
| 131 Holzinger Bnd Bastrop, TX | 4.0 | 2.5 | 2376 | $2,800 | $1.18 | 17d | 1 | 0.66mi |
| 140 Cibolo Creek Loop Bastrop, TX | 3.0 | 2.0 | 1742 | $2,295 | $1.32 | 4d | 1 | 0.81mi |
| 202 Cibolo Creek Loop Bastrop, TX | 4.0 | 3.0 | 2022 | $2,395 | $1.18 | 23d | 1 | 0.81mi |
| 129 Powder Horn Rd Bastrop, TX | 3.0 | 2.0 | 2461 | $4,000 | $1.63 | 4d | 1 | 1.36mi |
HOA detail
- Monthly dues
- $2 · $24/yr
Listing history 21 events
-
2026-06-18days on market $339,990 Active 146 DOM
-
2026-06-17days on market $339,990 Active 145 DOM
-
2026-06-16days on market $339,990 Active 144 DOM
-
2026-06-15days on market $339,990 Active 143 DOM
-
2026-06-13days on market $339,990 Active 141 DOM
-
2026-06-09days on market $339,990 Active 137 DOM
-
2026-06-08days on market $339,990 Active 136 DOM
-
2026-06-07days on market $339,990 Active 135 DOM
-
2026-06-04days on market $339,990 Active 132 DOM
-
2026-06-03days on market $339,990 Active 131 DOM
-
2026-06-02days on market $339,990 Active 130 DOM
-
2026-06-01days on market $339,990 Active 129 DOM
-
2026-05-31days on market $339,990 Active 128 DOM
-
2026-05-03price $427,590 159-char remark
Show marketing remark (159 chars)
Relax in the Hallmark floor plan's open kitchen, spacious gathering room, and private primary suite. Explore this welcoming home design at Del Webb Lost Pines.
-
2026-04-13price $429,090 200-char remark
Show marketing remark (159 chars)
Relax in the Hallmark floor plan's open kitchen, spacious gathering room, and private primary suite. Explore this welcoming home design at Del Webb Lost Pines.
-
2026-04-13price $429,090 159-char remark
Show marketing remark (159 chars)
Relax in the Hallmark floor plan's open kitchen, spacious gathering room, and private primary suite. Explore this welcoming home design at Del Webb Lost Pines.
-
2026-03-07price $444,090 200-char remark
Show marketing remark (200 chars)
NEW CONSTRUCTION BY PULTE HOMES! Available June 2026! Relax in Hallmark floor plan's open kitchen, spacious gathering room, and private owner's suite. Explore this welcoming home design from Del Webb.
-
2026-02-19price $444,090 159-char remark
Show marketing remark (159 chars)
Relax in the Hallmark floor plan's open kitchen, spacious gathering room, and private primary suite. Explore this welcoming home design at Del Webb Lost Pines.
-
2026-01-26price $441,130 200-char remark
Show marketing remark (159 chars)
Relax in the Hallmark floor plan's open kitchen, spacious gathering room, and private primary suite. Explore this welcoming home design at Del Webb Lost Pines.
-
2026-01-26$441,130 Active 159-char remark
Show marketing remark (159 chars)
Relax in the Hallmark floor plan's open kitchen, spacious gathering room, and private primary suite. Explore this welcoming home design at Del Webb Lost Pines.
-
2026-01-23$455,040 Active 200-char remark
Show marketing remark (200 chars)
NEW CONSTRUCTION BY PULTE HOMES! Available June 2026! Relax in Hallmark floor plan's open kitchen, spacious gathering room, and private owner's suite. Explore this welcoming home design from Del Webb.
ⓘ Source: listings_history table (triggers on properties + properties_extension) + one-shot
backfill from property_details.listing_events for pre-trigger history.
Nearby sold comps map
Loading sold comps map…
Walkable amenities ~0.75 mi
Loading nearby amenities…
Taxation est. · year 1
- Rental income
- $31,351
- − Mortgage interest
- −$19,045
- − Property taxes
- −$5,100
- − Insurance
- −$1,700
- − Repairs & maintenance
- −$2,508
- − Management
- −$2,508
- − HOA
- −$24
- − Depreciation
- −$9,891
- Taxable loss
- −$9,424
- Est. tax savings @ 24.0%
- +$2,262
- After-tax cash flow
- $-1,190/yr
For passive investors: Depreciation is non-cash, so a rental often shows a tax loss while cash-flowing — sheltering income. Rental losses are passive: they offset passive income freely, and up to $25,000/yr can offset ordinary (W-2) income if you actively participate and your MAGI is under $100k (phasing out to $0 by $150k); unused losses carry forward. On sale, claimed depreciation is recaptured at up to 25%, and gains may owe capital-gains tax (a 1031 exchange can defer both). Figures are a year-1 estimate at your 24.0% rate — not tax advice; consult a CPA.
Schools (NCES district)
- District
- Bastrop ISD
- NCES district ID
- 4809570
- Math proficiency
- 25% ▼ -13.00%
- Reading proficiency
- 28% ▼ -4.00%
- Median HH income
- $56,010
- Composite
- 23.87/100
- National rank
- #7799
- State rank
- #670 of 826 in TX
Livability — Bastrop
- Score
- 62/100
- State rank
- #947
- US rank
- #16846
Category grades
Schools grade is shown separately in the Schools card above.
Census & demographics
- County
- Bastrop County · 68,601 people
- City population
- 38,190
- Metro
- Austin-Round Rock-Georgetown, TX
- Population (ZIP)
- 38,190
- Household income
- $89,968
- Rent vs Own
- Severe rent burden
- 775.0
Population outlook (Bastrop County) Hauer SSP2
- Today (2025)
- 94,260 people
- By 2030
- 101,355 · +7.5%
- By 2040
- 115,578 · +22.6%
- By 2050
- 129,464 · +37.3%
- By 2075
- 168,068 · +78.3%
- By 2100
- 194,857 · +106.7%
Race, ethnicity, and origin ACS 2023
- Neighborhood character
- Diverse neighborhood (Simpson 0.57)
- Race & ethnicity
- White 54% Hispanic / Latino 36% Two or more races 17% Black 6% Native American 1%
- Hispanic origin (detail)
- Mexican 28% Puerto Rican 2%
- Common ancestry
- Italian 3% Serbian 2% Lithuanian 2%
- Foreign-born
- 8% · Canada, Vietnam
- Languages at home
- 75% English-only · Spanish 23% German/W. Germanic 1%
Political lean MEDSL · Bastrop
- 2024 margin
- R (+18.4) · D 40.2% · R 58.6% · Other 1.2%
- 2008→2024 swing
- -10.2pp toward R · 2008: -8.2pp · 2024: -18.4pp
- All cycles
- 2024: R+18.4 2020: R+13.8 2016: R+20.4 2012: R+17.0 2008: R+8.2
Not yet ingested
- Civics
- —
Market trends
- HPI YoY
- ▼ -73.68%
- Current HPI
- 247.1145
- Rent YoY
- ▼ -2.04%
- Metro
- Austin-Round Rock-Georgetown, TX
- State GDP YoY
- ▲ 3.95%
- F500 in state
- 110
Industry mix (Fortune 500 HQ in TX)
| Industry | F500 HQs | Revenue |
|---|---|---|
| Energy | 16 | $1,198B |
|
||
| Technology | 5 | $198B |
|
||
| Engineering / Construction | 4 | $72B |
|
||
| Energy Services | 3 | $60B |
|
||
| Utilities | 3 | $41B |
|
||
| Healthcare | 2 | $330B |
|
||
Price history
-6.0% since first listed8 events — show timeline
- 2026-05-03 Price Changed $427,590 Zillow
- 2026-04-13 Price Changed $429,090 Unlock MLS
- 2026-04-13 Price Changed $429,090 Zillow
- 2026-03-07 Price Changed $444,090 Unlock MLS
- 2026-02-19 Price Changed $444,090 Zillow
- 2026-01-26 Price Changed $441,130 Unlock MLS
- 2026-01-26 Listed $441,130 Zillow
- 2026-01-23 Listed $455,040 Unlock MLS
Cash-flow waterfall
monthlySold comps — $/sqft
last 12 mo · ≤1 miLoading sold comps…