 Multi-family
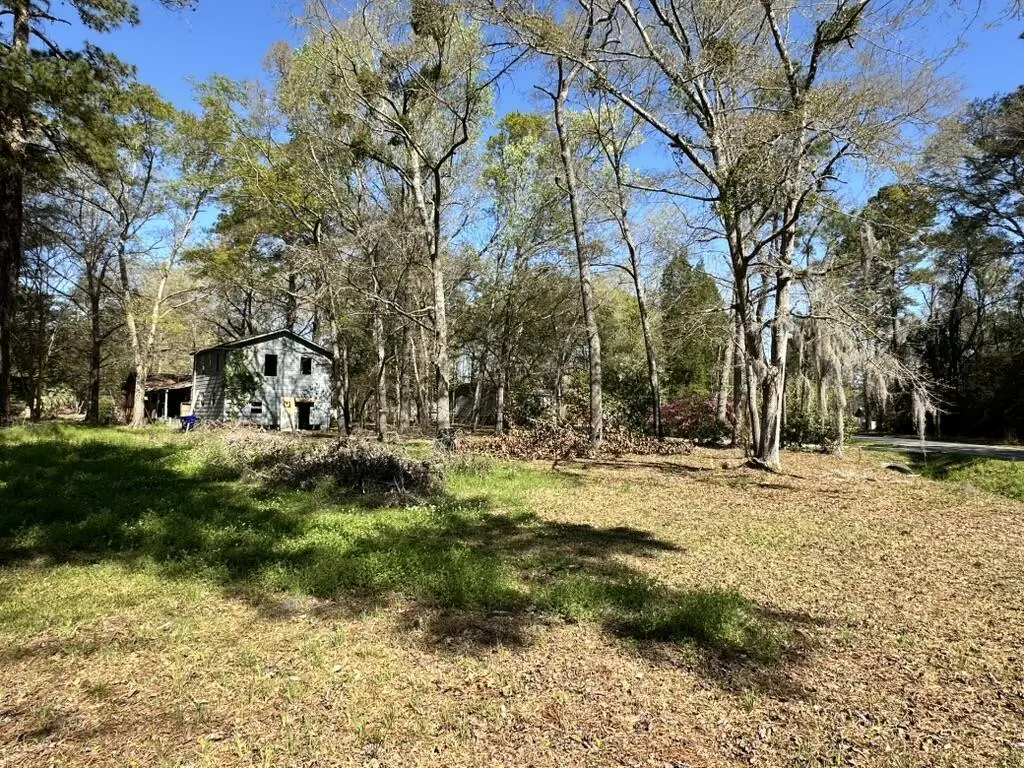
780 E Cain St · Lincolnville, SC
Flood risk 1/10 · Minimal
- FEMA flood zone
- X (unshaded)
- Chance of flooding over 30 yrs
- 0.0%
- Est. flood insurance / yr
- $507 – $1,088
Fire risk 4/10 · Minor
- Est. fire insurance / yr
- $783 – $1,453
Heat risk 8/10 · Major
- Hot days now (above 108°F)
- 7 days/yr
- Hot days in 30 yrs
- 15 days/yr
Wind risk 8/10 · Major
- Chance of severe wind over 30 yrs
- 97.0%
Air-quality risk 3/10 · Minor
- Unhealthy air days now
- 3 days/yr
- Unhealthy air days in 30 yrs
- 3 days/yr
Risk factors via First Street. Map © Google.
Why this score? — see what drove the B grade
The composite is a weighted blend of 9 inputs, each scored 0–100. Each bar is that input's sub-score; the figure is the points it added to the 100-point composite (weight × sub-score).
- Cash flow +30.0/30.0
- 1% rule +10.0/10.0
- DSCR +10.0/10.0
- ARV discount +7.5/15.0
- Schools +4.3/10.0
- Rent growth +3.5/5.0
- Livability +3.1/5.0
- Condition / age +2.5/5.0
- Appreciation +0.0/10.0
$249,990
🖨 Deal sheet 📄 Offer letter ✓ Due diligence
Multi-family units
County records classify this as Multi-Family (2-4 Unit). Listing-text estimate: 1 unit. estimate disagrees with records
Listing remarks MLS
If you've been searching for your next project, then look no further. Located in Summerville under two miles from Historic Downtown, this triplex is waiting to be customized to fit your vision. This property is 3/4th acre and the home is currently framed as a 3/2, 2/1, 2/1. With I-26 and lots of shopping and dining options within three miles of this home, this location is tough to beat. Don't miss out on this great opportunity.Also listed as residential single family detached - MLS#26008557
Key facts
- 0.75 acre lot
- Built 1978
- Listed 84 days
Property features AI
Exterior
- Home design: Single-family detached home; Two levels; Fee simple ownership
- Exterior features: Lot between 0.5 and 1 acre; No other structures on the property
Interior
- Bedrooms: Seven bedrooms
- Bathrooms: Four bathrooms
- Interior features: Seven bedrooms; Four bathrooms
Neighborhood map
What this means for you Summary
Snapshot
- This is a 7-bed/3.0-bath multifamily listed at $250k.
Deal economics
- At list price, monthly cash flow is $2k ($29k/yr) — positive.
- The deal already cash-flows at list — no discount required.
- Meets the 1% rule at list price ($5k rent vs $250k).
- Recommended offer: $235k (6.0% below list) — sets the bar for market timing.
- Cap rate 17.8% vs local median 4.0% in Lincolnville — top-decile yield for the area; either an underpriced asset or a hidden risk that comps aren't pricing in. Stress-test before assuming the spread holds.
Location & tenants
- Location reads 61/100 on livability (#215 in SC) — a middle-class / working-renter tenant base. Strengths: cost of living A+, health & safety A+, crime A-; Watch: amenities F, commute F, employment F.
- Charleston 01 (urban): math 48% / reading 53% proficiency, ranked #7 of 80 in SC (top 9%) — acceptable for families but not a draw, mixed tenant base, ~2y average lease.
- Zoned schools: Ladson Elementary (math 27% / reading 23%, grade F, #447 of 597 statewide, top 76%, 851 students, 100% FRL); Deer Park Middle (math 10% / reading 22%, grade F, #196 of 229 statewide, top 87%, 328 students, 100% FRL); Rb Stall High (math 49% / reading 63%, grade C, #126 of 196 statewide, top 65%, 1,952 students, 100% FRL) — zoned schools average 100% FRL vs 44% district-wide (56 pts higher); higher-poverty schools than district average — tighter screening recommended.
- Zoned-school proficiency averages 32% at this address vs 50% district-wide (-18 pts) — the specific schools serving this property underperform the Charleston 01 average; the district grade overstates school quality for this exact location.
- Market conditions: Rents rising (+3.9%/yr); 691 active listings in the ZIP; solid renter incomes; 4,156 units permitted in Charleston County in 2024 (857 in 5+ unit buildings).
- At $4,912/mo this rent would consume 71% of the median local household income ($83k/yr) (locally 1302% of renters already pay >50% of income on rent) — very limited rent-growth headroom before tenants either downsize or default.
Forward outlook
- Local home prices are declining (-3.0%/yr); year-one equity from $2k of loan paydown is wiped out by about $8k of value loss. Plan a longer hold.
- Charleston County population projected at +44% by 2050 — long-run rental-demand tailwind backs the buy-and-hold thesis.
- At projected returns (-3.0% appreciation + 3.9% rent growth), your $70k cash investment doubles in ~3 years — after that, you're playing with house money.
Negotiation context
- It's been on market 84 days — a 6% lower offer ($235k) is reasonable based on typical stale-listing flexibility.
- 3 sale attempts with the ask held roughly flat each time — persistent listings suggest the price (not the market) is what's stuck; bring a comps-based counter.
Risks & watch-outs
- Climate carrying-cost: severe wind risk, 97% chance of damaging wind over 30y; extreme-heat days projected 7→15/yr by 2055 (HVAC capex compounding) — expect insurance premiums to compound above CPI over the hold.
Questions for the listing agent
- It's been on market 84 days. Have you received any prior offers? Is the seller open to a 6% concession, seller financing, or rate buy-down credit?
- Built in 1978 — when were the roof, HVAC, electrical panel, plumbing, and water heater last replaced?
- Why hasn't it sold? Are there any deal-killer items the seller is aware of (foundation, flood, title, zoning, code violations)?
- Is there a deadline driving the sale (1031 exchange, divorce, estate, relocation)? That informs how much negotiation room exists.
- Schools are F-rated, which usually means shorter tenancies and higher turnover. Who's the typical renter profile here, and what's been the actual vacancy rate?
- What's the average days-on-market for RENTAL listings here right now (not sales)? A rising rental-DOM trend means longer vacancies and softer asking-rent achievability than the comps imply.
- What's the recent tenant-quality profile in this submarket — average credit score on applications, eviction rate, late-payment / NSF rate, and stable-employment percentage? A property-management company in the area should have these aggregated.
- How much new apartment / multifamily construction is in the pipeline within 1–3 miles? Heavy new supply (>2% of stock underway) typically softens rents 12–24 months out; light construction supports rent growth.
Investment metrics
- 1% rule
- 1.96% ✓
- Cap rate
- 17.76%
- Cash-on-cash
- 40.94%
- DSCR
- 2.82
- GRM
- 4.2
CMA / ARV
No comps found within radius.
Projected returns pro-forma
-3.0% appreciation · 3.93% rent growth · sell at horizon
- IRR
- 38.4%
- Equity multiple
- 2.66×
- Total profit
- $116,163
- Equity at exit
- $37,274
- IRR
- 45.3%
- Equity multiple
- 5.52×
- Total profit
- $316,123
- Equity at exit
- $21,615
Cash invested: $69,997 (down + closing). Projections, not guarantees.
Landlord ↔ Tenant lean methodology
- Overall (STATE)
- 90 Strongly Landlord-Friendly
- State South Carolina
- 90 Strongly Landlord-Friendly · R+6
- County
- — inherits STATE
- City
- — inherits STATE
ZIP-level market 29485
- Rents YoY
- 3.9%
- Active inventory
- 691
- Price-to-rent
- 11.0×
Monthly cashflow live
- Estimated rent
- $4,912 high interval (Pro) →
- Mortgage (P&I)
- −$1,311
- Tax from tax record
- −$77 /mo · $926/yr
- Insurance
- −$104
- HOA
- −$0
- Vacancy / Maint / Mgmt
- −$1,032
- Net cashflow
- $2,388
Break-even live
3-unit breakdown (identical units grouped — click to expand)
| Units | Beds | Baths | Est. rent |
|---|---|---|---|
| 1× unit | 3 | 1.5 | $1,895 |
| 2× units | 1 | 1 | $3,018 |
| #2 | 1 | 1 | $1,509 |
| #3 | 1 | 1 | $1,509 |
| Total (3 units) | $4,912 | ||
UW: 25.0% down · 7.5% · 30yr · 1.5% tax · 5.0% vac · 8.0% maint · 8.0% mgmt
Financing live
Cash to close
- Down payment
- $62,498
- Closing costs
- $7,500
- Reserves months
- —
- Total cash needed
- —
Loan-product check · same deal, 3 products live
Conventional
25% down · 7.5% · 30yr
- Down + closing
- —
- Monthly P&I
- —
- Monthly cashflow
- —
- DSCR
- —
- Eligible?
- —
Personal DTI + credit; lowest rate.
DSCR
20% down · 8.5% · 30yr
- Down + closing
- —
- Monthly P&I
- —
- Monthly cashflow
- —
- DSCR
- —
- Eligible?
- —
No personal income docs; deal must DSCR.
Hard money
10% down · 12.0% · 12mo
- Down + closing
- —
- Monthly P&I
- —
- Monthly cashflow
- —
- DSCR
- —
- Eligible?
- —
Short-term bridge; refi at stabilization.
Listing history 19 events
-
2026-06-18days on market $249,990 Active 84 DOM
-
2026-06-17days on market $249,990 Active 83 DOM
-
2026-06-16days on market $249,990 Active 82 DOM
-
2026-06-15days on market $249,990 Active 81 DOM
-
2026-06-10days on market $249,990 Active 76 DOM
-
2026-06-09days on market $249,990 Active 75 DOM
-
2026-06-08days on market $249,990 Active 74 DOM
-
2026-06-07days on market $249,990 Active 73 DOM
-
2026-06-05days on market $249,990 Active 70 DOM
-
2026-06-03days on market $249,990 Active 69 DOM
-
2026-06-01days on market $249,990 Active 67 DOM
-
2026-05-31days on market $249,990 Active 66 DOM
-
2026-03-26$249,990 Active
Show marketing remark (496 chars)
If you've been searching for your next project, then look no further. Located in Summerville under two miles from Historic Downtown, this triplex is waiting to be customized to fit your vision. This property is 3/4th acre and the home is currently framed as a 3/2, 2/1, 2/1. With I-26 and lots of shopping and dining options within three miles of this home, this location is tough to beat. Don't miss out on this great opportunity.Also listed as residential single family detached - MLS#26008557
-
2026-03-26$249,990 Active 496-char remark
Show marketing remark (496 chars)
If you've been searching for your next project, then look no further. Located in Summerville under two miles from Historic Downtown, this triplex is waiting to be customized to fit your vision. This property is 3/4th acre and the home is currently framed as a 3/2, 2/1, 2/1. With I-26 and lots of shopping and dining options within three miles of this home, this location is tough to beat. Don't miss out on this great opportunity.Also listed as residential single family detached - MLS#26008557
-
2025-07-17soldstatus $220,000
-
2025-05-29price $250,000
-
2025-05-05price $265,000
-
2025-04-07$275,000 Active
-
2017-09-20soldstatus $141,100
ⓘ Source: listings_history table (triggers on properties + properties_extension) + one-shot
backfill from property_details.listing_events for pre-trigger history.
Tax reassessment forecast SC · Resets to sale price
- Current annual tax
- $926 · $77/mo
- Projected year-2 tax
- $1,425 · $119/mo
- Expected delta
- +$499/yr (+$42/mo · 53.9%)
ⓘ Screening estimate from a state-policy table — verify with the county assessor before closing.
Climate risk First Street
- Flood 1/10 Low FEMA zone X (unshaded) · 0% chance over 30 yrs
- Wildfire 4/10 Moderate
- Heat 8/10 Severe 7 d/yr ≥108°F today · 15 d/yr by 30 yrs out
- Wind 8/10 Severe 97% chance of damaging wind over 30 yrs
- Air quality 3/10 Moderate 3 unhealthy d/yr today · 3 by 30 yrs out
Nearby sold comps map
Loading sold comps map…
Walkable amenities ~0.75 mi
Loading nearby amenities…
Taxation est. · year 1
- Rental income
- $58,944
- − Mortgage interest
- −$14,003
- − Property taxes
- −$926
- − Insurance
- −$1,250
- − Repairs & maintenance
- −$4,716
- − Management
- −$4,716
- − Depreciation
- −$7,272
- Taxable income
- $26,061
- Est. tax owed @ 24.0%
- −$6,255
- After-tax cash flow
- $22,403/yr
For passive investors: Depreciation is non-cash, so a rental often shows a tax loss while cash-flowing — sheltering income. Rental losses are passive: they offset passive income freely, and up to $25,000/yr can offset ordinary (W-2) income if you actively participate and your MAGI is under $100k (phasing out to $0 by $150k); unused losses carry forward. On sale, claimed depreciation is recaptured at up to 25%, and gains may owe capital-gains tax (a 1031 exchange can defer both). Figures are a year-1 estimate at your 24.0% rate — not tax advice; consult a CPA.
Schools (NCES district)
- District
- Charleston 01
- NCES district ID
- 4501440
- Math proficiency
- 48% ▼ -2.00%
- Reading proficiency
- 53% ▬ 0.00%
- Median HH income
- $52,376
- Composite
- 43.41/100
- National rank
- #3018
- State rank
- #7 of 80 in SC
Livability — Lincolnville
- Score
- 61/100
- State rank
- #215
- US rank
- #18010
Category grades
Schools grade is shown separately in the Schools card above.
Census & demographics
- Census place
- Lincolnville, SC
- County
- Dorchester County · 182,866 people
- City population
- 108,266
- Metro
- Charleston-North Charleston, SC
- Population (ZIP)
- 58,507
- Household income
- $82,987
- Rent vs Own
- Severe rent burden
- 1302.0
Population outlook (Charleston County) Hauer SSP2
- Today (2025)
- 480,562 people
- By 2030
- 525,921 · +9.4%
- By 2040
- 612,189 · +27.4%
- By 2050
- 691,627 · +43.9%
- By 2075
- 847,979 · +76.5%
- By 2100
- 926,482 · +92.8%
Race, ethnicity, and origin ACS 2023
- Neighborhood character
- Diverse neighborhood (Simpson 0.57)
- Race & ethnicity
- White 61% Black 23% Hispanic / Latino 7% Two or more races 7% Asian 3% Pacific Islander 2%
- Hispanic origin (detail)
- Mexican 4% Puerto Rican 1%
- Common ancestry
- Slovak 3% Italian 2% Lithuanian 2%
- Foreign-born
- 7% · Canada, China, Vietnam
- Languages at home
- 92% English-only · Spanish 4% Chinese 1% Russian/Polish/Slavic 1%
Political lean MEDSL · Charleston
- 2024 margin
- Lean D (+5.7) · D 51.9% · R 46.3% · Other 1.8%
- 2008→2024 swing
- -2.7pp toward R · 2008: 8.3pp · 2024: 5.7pp
- All cycles
- 2024: D+5.7 2020: D+12.9 2016: D+7.9 2012: D+2.4 2008: D+8.3
Not yet ingested
- Civics
- —
Market trends
- HPI YoY
- ▼ -305.43%
- Current HPI
- 210.8607
- Rent YoY
- ▲ 3.93%
- Metro
- Charleston-North Charleston, SC
- State GDP YoY
- ▲ 4.51%
- F500 in state
- 2
Industry mix (Fortune 500 HQ in SC)
| Industry | F500 HQs | Revenue |
|---|---|---|
| Packaging | 1 | $7B |
|
||
Price history
+77.2% since first listed7 events — show timeline
- 2026-03-26 Listed $249,990 Charleston Trident MLS
- 2026-03-26 Listed $249,990 Charleston Trident MLS
- 2025-07-17 Sold (Public Records) $220,000 Public Records
- 2025-05-29 Price Changed $250,000 Charleston Trident MLS
- 2025-05-05 Price Changed $265,000 Charleston Trident MLS
- 2025-04-07 Listed $275,000 Charleston Trident MLS
- 2017-09-20 Sold (Public Records) $141,100 Public Records
Property tax history
+4.2%/yrLatest (2022): $926 · -1.9% YoY. Source: county tax records.
Cash-flow waterfall
monthlySold comps — $/sqft
last 12 mo · ≤1 miLoading sold comps…